Verrayes Airbnb Market Analysis 2025: Short Term Rental Data & Vacation Rental Statistics in Aosta Valley, Italy
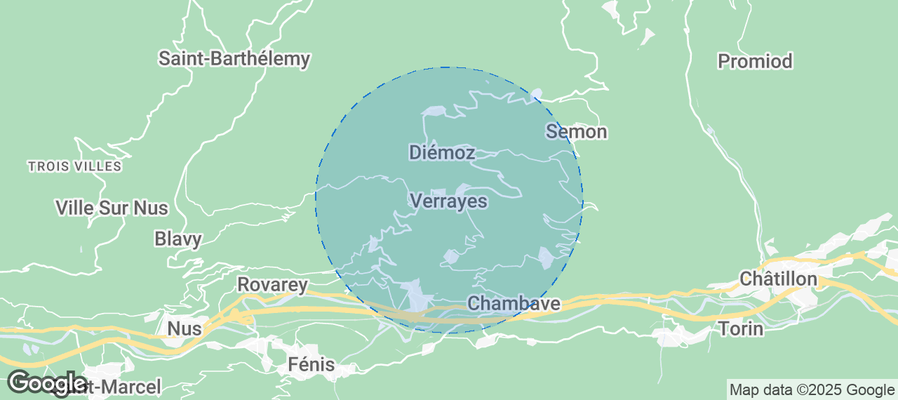
Is Airbnb profitable in Verrayes in 2025? Explore comprehensive Airbnb analytics for Verrayes, Aosta Valley, Italy to uncover income potential. This 2025 STR market report for Verrayes, based on AirROI data from October 2024 to September 2025, reveals key trends in the niche market of 18 active listings.
Whether you're considering an Airbnb investment in Verrayes, optimizing your existing vacation rental, or exploring rental arbitrage opportunities, understanding the Verrayes Airbnb data is crucial. Navigating the high regulation landscape is key to maximizing your short term rental income potential. Let's dive into the specifics.
Key Verrayes Airbnb Performance Metrics Overview
Monthly Airbnb Revenue Variations & Income Potential in Verrayes (2025)
Understanding the monthly revenue variations for Airbnb listings in Verrayes is key to maximizing your short term rental income potential. Seasonality significantly impacts earnings. Our analysis, based on data from the past 12 months, shows that the peak revenue month for STRs in Verrayes is typically August, while November often presents the lowest earnings, highlighting opportunities for strategic pricing adjustments during shoulder and low seasons. Explore the typical Airbnb income in Verrayes across different performance tiers:
- Best-in-class properties (Top 10%) achieve $4,177+ monthly, often utilizing dynamic pricing and superior guest experiences.
- Strong performing properties (Top 25%) earn $2,026 or more, indicating effective management and desirable locations/amenities.
- Typical properties (Median) generate around $1,046 per month, representing the average market performance.
- Entry-level properties (Bottom 25%) see earnings around $598, often with potential for optimization.
Average Monthly Airbnb Earnings Trend in Verrayes
Verrayes Airbnb Occupancy Rate Trends (2025)
Maximize your bookings by understanding the Verrayes STR occupancy trends. Seasonal demand shifts significantly influence how often properties are booked. Typically, Augustsees the highest demand (peak season occupancy), while November experiences the lowest (low season). Effective strategies, like adjusting minimum stays or offering promotions, can boost occupancy during slower periods. Here's how different property tiers perform in Verrayes:
- Best-in-class properties (Top 10%) achieve 60%+ occupancy, indicating high desirability and potentially optimized availability.
- Strong performing properties (Top 25%) maintain 49% or higher occupancy, suggesting good market fit and guest satisfaction.
- Typical properties (Median) have an occupancy rate around 34%.
- Entry-level properties (Bottom 25%) average 20% occupancy, potentially facing higher vacancy.
Average Monthly Occupancy Rate Trend in Verrayes
Average Daily Rate (ADR) Airbnb Trends in Verrayes (2025)
Effective short term rental pricing strategy in Verrayes involves understanding monthly ADR fluctuations. The Average Daily Rate (ADR) for Airbnb in Verrayes typically peaks in September and dips lowest during March. Leveraging Airbnb dynamic pricing tools or strategies based on this seasonality can significantly boost revenue. Here's a look at the typical nightly rates achieved:
- Best-in-class properties (Top 10%) command rates of $239+ per night, often due to premium features or locations.
- Strong performing properties (Top 25%) achieve nightly rates of $119 or more.
- Typical properties (Median) charge around $81 per night.
- Entry-level properties (Bottom 25%) earn around $67 per night.
Average Daily Rate (ADR) Trend by Month in Verrayes
Get Live Verrayes Market Intelligence 👇
Explore Real-time Analytics
Airbnb Seasonality Analysis & Trends in Verrayes (2025)
Peak Season (August, July, September)
- Revenue averages $2,661 per month
- Occupancy rates average 59.7%
- Daily rates average $127
Shoulder Season
- Revenue averages $1,523 per month
- Occupancy maintains around 30.4%
- Daily rates hold near $111
Low Season (May, October, November)
- Revenue drops to average $948 per month
- Occupancy decreases to average 23.0%
- Daily rates adjust to average $113
Seasonality Insights for Verrayes
- The Airbnb seasonality in Verrayes shows highly seasonal trends requiring careful strategy. While the sections above show seasonal averages, it's also insightful to look at the extremes:
- During the high season, the absolute peak month showcases Verrayes's highest earning potential, with monthly revenues capable of climbing to $3,295, occupancy reaching a high of 75.5%, and ADRs peaking at $132.
- Conversely, the slowest single month of the year, typically falling within the low season, marks the market's lowest point. In this month, revenue might dip to $595, occupancy could drop to 8.9%, and ADRs may adjust down to $105.
- Understanding both the seasonal averages and these monthly peaks and troughs in revenue, occupancy, and ADR is crucial for maximizing your Airbnb profit potential in Verrayes.
Seasonal Strategies for Maximizing Profit
- Peak Season: Maximize revenue through premium pricing and potentially longer minimum stays. Ensure high availability.
- Low Season: Offer competitive pricing, special promotions (e.g., extended stay discounts), and flexible cancellation policies. Target off-season travelers like remote workers or budget-conscious guests.
- Shoulder Seasons: Implement dynamic pricing that balances peak and low rates. Target weekend travelers or specific events. Offer slightly more flexible terms than peak season.
- Regularly analyze your own performance against these Verrayes seasonality benchmarks and adjust your pricing and availability strategy accordingly.
Best Areas for Airbnb Investment in Verrayes (2025)
Exploring the top neighborhoods for short-term rentals in Verrayes? This section highlights key areas, outlining why they are attractive for hosts and guests, along with notable local attractions. Consider these locations based on your target guest profile and investment strategy.
| Neighborhood / Area | Why Host Here? (Target Guests & Appeal) | Key Attractions & Landmarks |
|---|---|---|
| Verrayes Center | The heart of Verrayes, offering easy access to local shops, restaurants, and cultural sites. Ideal for tourists wanting to experience authentic local life while being close to nature. | Chiesa di San Giovanni Battista, local restaurants, scenic hiking trails, Verrayes Castle, wine tasting events |
| Champagne Region | Famous for its vineyards and wine production, this area attracts wine enthusiasts and nature lovers looking for serene landscapes and local wine experiences. | Vineyards tours, wine tasting events, local markets, hiking trails through vineyards, scenic driving routes |
| Mont Avic Regional Park | A stunning natural park that offers outdoor adventure opportunities including hiking, biking, and wildlife watching, making it perfect for the nature-loving traveler. | hiking trails, wildlife spotting, nature photography, breathtaking views, educational guides |
| Saint-Vincent | A nearby town known for its thermal baths and casino, appealing to visitors looking for relaxation and entertainment. It's a popular stop for tourists exploring the Aosta Valley. | Terme di Saint-Vincent, Saint-Vincent Casino, local dining, spa services, cultural events |
| Châtillon | A charming town with historic sites and a peaceful atmosphere, great for family vacations or quiet retreats. Offers a blend of culture, history, and nature. | Museo d'Arte e Storia, Castello di Châtillon, local workshops, nature walks, heritage sites |
| Brusson | Known for its breathtaking landscapes and outdoor activities, Brusson is a lovely mountain village perfect for skiing in the winter and hiking in the summer. | Ski resorts, hiking trails, Alpine lakes, traditional festivals, local cuisine |
| Torgnon | A well-known ski resort area, popular in winter months, and a great location for families and sports enthusiasts looking for both winter and summer activities. | Ski slopes, hiking paths, local events, family-friendly accommodations, panoramic viewpoints |
| Aosta | The main city in the valley, rich in history and culture, offering a wider array of amenities, attractions, and a vibrant local life to tourists. | Roman ruins, Aosta Cathedral, Museo Archeologico Regionale, local restaurants, shopping areas |
Understanding Airbnb License Requirements & STR Laws in Verrayes (2025)
Yes, Verrayes, Aosta Valley, Italy enforces high STR regulations. Obtaining a license and ensuring compliance is almost certainly required according to current 2025 STR laws. Always verify the latest short term rental regulations and Airbnb license requirements directly with local government authorities for Verrayes to ensure full compliance before hosting.
(Source: AirROI data, 2025, based on 67% licensed listings)
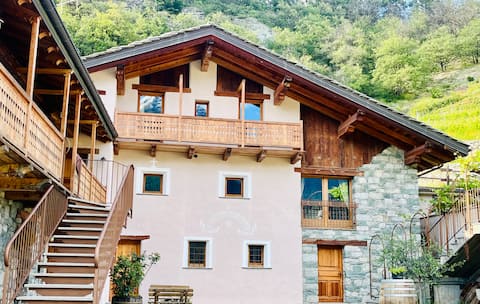
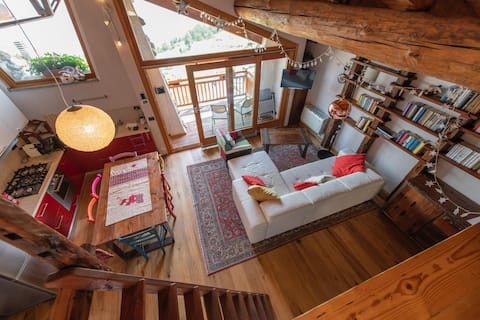
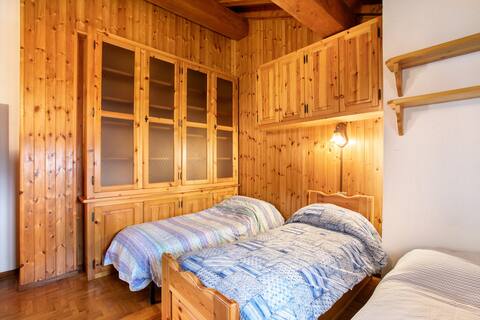
Top Performing Airbnb Properties in Verrayes (2025)
Benchmark your potential! Explore examples of top-performing Airbnb properties in Verrayesbased on Trailing Twelve Month (TTM) revenue. Analyze their characteristics, revenue, occupancy rate, and ADR to understand what drives success in this market.
La Vrille - Metcho
Entire Place • 3 bedrooms
Charming cozy cabin with amazing view
Entire Place • 3 bedrooms
Menfrey Vacation Home
Entire Place • 2 bedrooms
Chez-Nena, a cozy 45-square-meter accommodation.
Entire Place • 1 bedroom
Maison Lozon 4
Entire Place • 2 bedrooms
Maison Lozon 2
Entire Place • 2 bedrooms
Note: Performance varies based on location, size, amenities, seasonality, and management quality. Data reflects the past 12 months.
Top Performing Airbnb Hosts in Verrayes (2025)
Learn from the best! This table showcases top-performing Airbnb hosts in Verrayes based on the number of properties managed and estimated total revenue over the past year. Analyze their scale and performance metrics.
| Host Name | Properties | Grossing Revenue | Stay Reviews | Avg Rating |
|---|---|---|---|---|
| Sylvain | 1 | $51,944 | 36 | 5.00/5.0 |
| Ezio | 1 | $42,770 | 111 | 4.99/5.0 |
| Lucio | 3 | $25,274 | 74 | 4.79/5.0 |
| Holidu | 1 | $22,196 | 4 | 5.00/5.0 |
| Elena | 2 | $16,989 | 61 | 4.93/5.0 |
| Franco | 1 | $15,235 | 36 | 4.97/5.0 |
| Alessia Vancheri | 1 | $8,342 | 13 | 4.92/5.0 |
| Lorena | 1 | $7,082 | 14 | 4.93/5.0 |
| Lorella | 3 | $5,407 | 24 | 4.72/5.0 |
| Novasol | 1 | $5,109 | 2 | Not Rated |
Analyzing the strategies of top hosts, such as their property selection, pricing, and guest communication, can offer valuable lessons for optimizing your own Airbnb operations in Verrayes.
Dive Deeper: Advanced Verrayes STR Market Data (2025)
Ready to unlock more insights? AirROI provides access to advanced metrics and comprehensive Airbnb data for Verrayes. Explore detailed analytics beyond this report to refine your investment strategy, optimize pricing, and maximize your vacation rental profits.
Explore Advanced MetricsVerrayes Short-Term Rental Market Composition (2025): Property & Room Types
Room Type Distribution
Property Type Distribution
Market Composition Insights for Verrayes
- The Verrayes Airbnb market composition is heavily skewed towards Entire Home/Apt listings, which make up 100% of the 18 active rentals. This indicates strong guest preference for privacy and space.
- Looking at the property type distribution in Verrayes, House properties are the most common (55.6%), reflecting the local real estate landscape.
- Houses represent a significant 55.6% portion, catering likely to families or larger groups.
Verrayes Airbnb Room Capacity Analysis (2025): Bedroom Distribution
Distribution of Listings by Number of Bedrooms
Room Capacity Insights for Verrayes
- The dominant room capacity in Verrayes is 2 bedrooms listings, making up 50% of the market. This suggests a strong demand for properties suitable for couples or solo travelers.
- Together, 2 bedrooms and 1 bedroom properties represent 88.9% of the active Airbnb listings in Verrayes, indicating a high concentration in these sizes.
Verrayes Vacation Rental Guest Capacity Trends (2025)
Distribution of Listings by Guest Capacity
Guest Capacity Insights for Verrayes
- The most common guest capacity trend in Verrayes vacation rentals is listings accommodating 4 guests (55.6%). This suggests the primary traveler segment is likely small families or groups.
- Properties designed for 4 guests and 5 guests dominate the Verrayes STR market, accounting for 72.3% of listings.
- 11.1% of properties accommodate 6+ guests, serving the market segment for larger families or group travel in Verrayes.
- On average, properties in Verrayes are equipped to host 4.2 guests.
Verrayes Airbnb Booking Patterns (2025): Available vs. Booked Days
Available Days Distribution
Booked Days Distribution
Booking Pattern Insights for Verrayes
- The most common availability pattern in Verrayes falls within the 271-366 days range, representing 77.8% of listings. This suggests many properties have significant open periods on their calendars.
- Approximately 94.5% of listings show high availability (181+ days open annually), indicating potential for increased bookings or specific owner usage patterns.
- For booked days, the 1-30 days range is most frequent in Verrayes (33.3%), reflecting common guest stay durations or potential owner blocking patterns.
- A notable 11.1% of properties secure long booking periods (181+ days booked per year), highlighting successful long-term rental strategies or significant owner usage.
Verrayes Airbnb Minimum Stay Requirements Analysis
Distribution of Listings by Minimum Night Requirement
1 Night
2 listings
11.1% of total
2 Nights
1 listings
5.6% of total
4-6 Nights
1 listings
5.6% of total
7-29 Nights
3 listings
16.7% of total
30+ Nights
11 listings
61.1% of total
Key Insights
- The most prevalent minimum stay requirement in Verrayes is 30+ Nights, adopted by 61.1% of listings. This highlights the market's preference for longer commitments.
- Very short stays (1-2 nights) are less common (16.7%), suggesting hosts prefer slightly longer bookings to optimize turnover.
- A significant segment (61.1%) caters to monthly stays (30+ nights) in Verrayes, pointing to opportunities in the extended-stay market.
Recommendations
- Align with the market by considering a 30+ Nights minimum stay, as 61.1% of Verrayes hosts use this setting.
- If feasible, allowing 1-night stays, especially midweek or during low season, could capture last-minute bookings, as only 11.1% currently do.
- Explore offering discounts for stays of 30+ nights to attract the 61.1% of the market seeking extended stays.
- Adjust minimum nights based on seasonality – potentially shorter during low season and longer during peak demand periods in Verrayes.
Verrayes Airbnb Cancellation Policy Trends Analysis (2025)
Super Strict 60 Days
1 listings
5.6% of total
Flexible
6 listings
33.3% of total
Moderate
7 listings
38.9% of total
Strict
4 listings
22.2% of total
Cancellation Policy Insights for Verrayes
- The prevailing Airbnb cancellation policy trend in Verrayes is Moderate, used by 38.9% of listings.
- The market strongly favors guest-friendly terms, with 72.2% of listings offering Flexible or Moderate policies. This suggests guests in Verrayes may expect booking flexibility.
Recommendations for Hosts
- Consider adopting a Moderate policy to align with the 38.9% market standard in Verrayes.
- Regularly review your cancellation policy against competitors and market demand shifts in Verrayes.
Verrayes STR Booking Lead Time Analysis (2025)
Average Booking Lead Time by Month
Booking Lead Time Insights for Verrayes
- The overall average booking lead time for vacation rentals in Verrayes is 62 days.
- Guests book furthest in advance for stays during August (average 129 days), likely coinciding with peak travel demand or local events.
- The shortest booking windows occur for stays in October (average 8 days), indicating more last-minute travel plans during this time.
- Seasonally, Summer (104 days avg.) sees the longest lead times, while Fall (23 days avg.) has the shortest, reflecting typical travel planning cycles.
Recommendations for Hosts
- Use the overall average lead time (62 days) as a baseline for your pricing and availability strategy in Verrayes.
- For August stays, consider implementing length-of-stay discounts or slightly higher rates for bookings made less than 129 days out to capitalize on advance planning.
- During October, focus on last-minute booking availability and promotions, as guests book with very short notice (8 days avg.).
- Target marketing efforts for the Summer season well in advance (at least 104 days) to capture early planners.
- Monitor your own booking lead times against these Verrayes averages to identify opportunities for dynamic pricing adjustments.
Popular & Essential Airbnb Amenities in Verrayes (2025)
Amenity Prevalence
Amenity Insights for Verrayes
- Essential amenities in Verrayes that guests expect include: Kitchen. Lacking these (this) could significantly impact bookings.
- Popular amenities like TV, Hot water, Washer are common but not universal. Offering these can provide a competitive edge.
Recommendations for Hosts
- Ensure your listing includes all essential amenities for Verrayes: Kitchen.
- Consider adding popular differentiators like TV or Hot water to increase appeal.
- Highlight unique or less common amenities you offer (e.g., hot tub, dedicated workspace, EV charger) in your listing description and photos.
- Regularly check competitor amenities in Verrayes to stay competitive.
Verrayes Airbnb Guest Demographics & Profile Analysis (2025)
Guest Profile Summary for Verrayes
- The typical guest profile for Airbnb in Verrayes consists of a mix of domestic (37%) and international guests, with top international origins including France, typically belonging to the Post-2000s (Gen Z/Alpha) group (50%), primarily speaking English or French.
- Domestic travelers account for 36.5% of guests.
- Key international markets include Italy (36.5%) and France (12.7%).
- Top languages spoken are English (33%) followed by French (19.3%).
- A significant demographic segment is the Post-2000s (Gen Z/Alpha) group, representing 50% of guests.
Recommendations for Hosts
- Focus marketing internationally, particularly towards travelers from France.
- Tailor amenities and listing descriptions to appeal to the dominant Post-2000s (Gen Z/Alpha) demographic (e.g., highlight fast WiFi, smart home features, local guides).
- Highlight unique local experiences or amenities relevant to the primary guest profile.
- Consider seasonal promotions aligned with peak travel times for key origin markets.
Nearby Short-Term Rental Market Comparison
How does the Verrayes Airbnb market stack up against its neighbors? Compare key performance metrics like average monthly revenue, ADR, and occupancy rates in surrounding areas to understand the broader regional STR landscape.
| Market | Active Properties | Monthly Revenue | Daily Rate | Avg. Occupancy |
|---|---|---|---|---|
| La Rivière-Enverse | 16 | $6,280 | $719.98 | 37% |
| Lauterbrunnen | 553 | $6,030 | $517.48 | 51% |
| Les Clefs | 34 | $5,790 | $317.67 | 46% |
| Ranco | 12 | $5,486 | $485.38 | 37% |
| Grindelwald | 509 | $5,440 | $385.79 | 56% |
| Matten bei Interlaken | 63 | $5,387 | $336.44 | 59% |
| Monteu Roero | 12 | $5,346 | $407.57 | 42% |
| Zermatt | 789 | $5,160 | $490.50 | 47% |
| Interlaken | 310 | $4,983 | $396.73 | 54% |
| Niederried bei Interlaken | 17 | $4,892 | $505.36 | 39% |