Gallipoli Airbnb Market Analysis 2026: Short Term Rental Data & Vacation Rental Statistics in Apulia, Italy
Is Airbnb profitable in Gallipoli in 2026? Explore comprehensive Airbnb analytics for Gallipoli, Apulia, Italy to uncover income potential. This 2026 STR market report for Gallipoli, based on AirROI data from February 2025 to January 2026, reveals key trends in the bustling market of 1,010 active listings.
Whether you're considering an Airbnb investment in Gallipoli, optimizing your existing vacation rental, or exploring rental arbitrage opportunities, understanding the Gallipoli Airbnb data is crucial. Navigating the high regulation landscape is key to maximizing your short term rental income potential. Let's dive into the specifics.
Key Gallipoli Airbnb Performance Metrics Overview
Monthly Airbnb Revenue Variations & Income Potential in Gallipoli (2026)
Understanding the monthly revenue variations for Airbnb listings in Gallipoli is key to maximizing your short term rental income potential. Seasonality significantly impacts earnings. Our analysis, based on data from the past 12 months, shows that the peak revenue month for STRs in Gallipoli is typically August, while February often presents the lowest earnings, highlighting opportunities for strategic pricing adjustments during shoulder and low seasons. Explore the typical Airbnb income in Gallipoli across different performance tiers:
- Best-in-class properties (Top 10%) achieve $3,233+ monthly, often utilizing dynamic pricing and superior guest experiences.
- Strong performing properties (Top 25%) earn $1,912 or more, indicating effective management and desirable locations/amenities.
- Typical properties (Median) generate around $1,003 per month, representing the average market performance.
- Entry-level properties (Bottom 25%) see earnings around $460, often with potential for optimization.
Average Monthly Airbnb Earnings Trend in Gallipoli
Gallipoli Airbnb Occupancy Rate Trends (2026)
Maximize your bookings by understanding the Gallipoli STR occupancy trends. Seasonal demand shifts significantly influence how often properties are booked. Typically, Augustsees the highest demand (peak season occupancy), while December experiences the lowest (low season). Effective strategies, like adjusting minimum stays or offering promotions, can boost occupancy during slower periods. Here's how different property tiers perform in Gallipoli:
- Best-in-class properties (Top 10%) achieve 65%+ occupancy, indicating high desirability and potentially optimized availability.
- Strong performing properties (Top 25%) maintain 43% or higher occupancy, suggesting good market fit and guest satisfaction.
- Typical properties (Median) have an occupancy rate around 25%.
- Entry-level properties (Bottom 25%) average 11% occupancy, potentially facing higher vacancy.
Average Monthly Occupancy Rate Trend in Gallipoli
Average Daily Rate (ADR) Airbnb Trends in Gallipoli (2026)
Effective short term rental pricing strategy in Gallipoli involves understanding monthly ADR fluctuations. The Average Daily Rate (ADR) for Airbnb in Gallipoli typically peaks in August and dips lowest during November. Leveraging Airbnb dynamic pricing tools or strategies based on this seasonality can significantly boost revenue. Here's a look at the typical nightly rates achieved:
- Best-in-class properties (Top 10%) command rates of $274+ per night, often due to premium features or locations.
- Strong performing properties (Top 25%) achieve nightly rates of $180 or more.
- Typical properties (Median) charge around $121 per night.
- Entry-level properties (Bottom 25%) earn around $88 per night.
Average Daily Rate (ADR) Trend by Month in Gallipoli
Get Live Gallipoli Market Intelligence 👇

Explore Real-time Analytics
Airbnb Seasonality Analysis & Trends in Gallipoli (2026)
Peak Season (August, July, September)
- Revenue averages $2,680 per month
- Occupancy rates average 44.3%
- Daily rates average $179
Shoulder Season
- Revenue averages $1,276 per month
- Occupancy maintains around 28.7%
- Daily rates hold near $148
Low Season (January, February, December)
- Revenue drops to average $684 per month
- Occupancy decreases to average 18.0%
- Daily rates adjust to average $147
Seasonality Insights for Gallipoli
- The Airbnb seasonality in Gallipoli shows highly seasonal trends requiring careful strategy. While the sections above show seasonal averages, it's also insightful to look at the extremes:
- During the high season, the absolute peak month showcases Gallipoli's highest earning potential, with monthly revenues capable of climbing to $3,449, occupancy reaching a high of 50.8%, and ADRs peaking at $204.
- Conversely, the slowest single month of the year, typically falling within the low season, marks the market's lowest point. In this month, revenue might dip to $612, occupancy could drop to 16.6%, and ADRs may adjust down to $137.
- Understanding both the seasonal averages and these monthly peaks and troughs in revenue, occupancy, and ADR is crucial for maximizing your Airbnb profit potential in Gallipoli.
Seasonal Strategies for Maximizing Profit
- Peak Season: Maximize revenue through premium pricing and potentially longer minimum stays. Ensure high availability.
- Low Season: Offer competitive pricing, special promotions (e.g., extended stay discounts), and flexible cancellation policies. Target off-season travelers like remote workers or budget-conscious guests.
- Shoulder Seasons: Implement dynamic pricing that balances peak and low rates. Target weekend travelers or specific events. Offer slightly more flexible terms than peak season.
- Regularly analyze your own performance against these Gallipoli seasonality benchmarks and adjust your pricing and availability strategy accordingly.
Best Areas for Airbnb Investment in Gallipoli (2026)
Exploring the top neighborhoods for short-term rentals in Gallipoli? This section highlights key areas, outlining why they are attractive for hosts and guests, along with notable local attractions. Consider these locations based on your target guest profile and investment strategy.
| Neighborhood / Area | Why Host Here? (Target Guests & Appeal) | Key Attractions & Landmarks |
|---|---|---|
| Centro Storico | The historic center of Gallipoli, known for its stunning old town and charming streets. This area attracts tourists interested in history, culture, and beautiful architecture. | Gallipoli Castle, Angelis Chapel, Cattedrale di Sant'Agata, Piazza della Repubblica, Lido San Giovanni |
| Baia Verde | A beautiful beach area known for its sandy shores and vibrant nightlife. Ideal for tourists looking to enjoy the sun, sea, and coastal entertainment. | Baia Verde Beach, Lido Zen Beach, Parco Gondar, Galleria Pozzo Verde |
| Lido Conchiglie | A picturesque beach area with clear waters, perfect for families and beachgoers. A few kilometers from Gallipoli, it provides a quieter beach experience. | Lido Conchiglie Beach, Torre del Fiume |
| Rivabella | An emerging beach area preferred by families and locals, offering a more tranquil atmosphere away from the crowds. Suitable for those looking for a relaxing beach getaway. | Rivabella Beach, Punta Prosciutto |
| Sannicola | A nearby town with a rich local culture and few tourist crowds, offering an authentic Italian experience. Good for guests wanting to explore beyond typical tourist spots. | Chiesa di San Giuseppe, Castello di Sannicola |
| Santa Maria al Bagno | A charming coastal village known for its beautiful beaches and family-friendly atmosphere. It’s a great location for visitors who enjoy a quieter seaside stay. | Santa Maria al Bagno Beach, Museo della Memoria e dell'Accoglienza, Porto di Nardò |
| Torre dell'Omomorto | Known for its scenic views and historical significance, this area is great for visitors interested in nature and outdoor activities along with a touch of history. | Torre dell'Omomorto, Wild Beach |
| Mancaversa | A small seaside village popular with families, offering numerous dining and recreational options while still being close to Gallipoli's attractions. | Mancaversa Beach, Parco naturale regionale di porto Selvaggio |
Understanding Airbnb License Requirements & STR Laws in Gallipoli (2026)
Yes, Gallipoli, Apulia, Italy enforces high STR regulations. Obtaining a license and ensuring compliance is almost certainly required according to current 2026 STR laws. Always verify the latest short term rental regulations and Airbnb license requirements directly with local government authorities for Gallipoli to ensure full compliance before hosting.
(Source: AirROI data, 2026, based on 81% licensed listings)
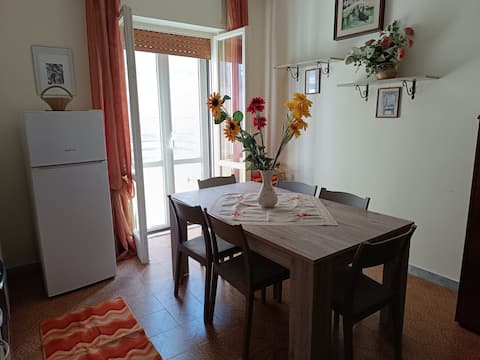
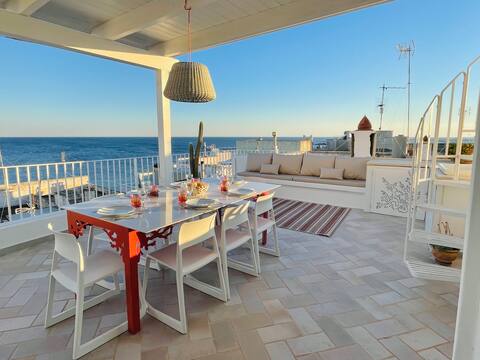
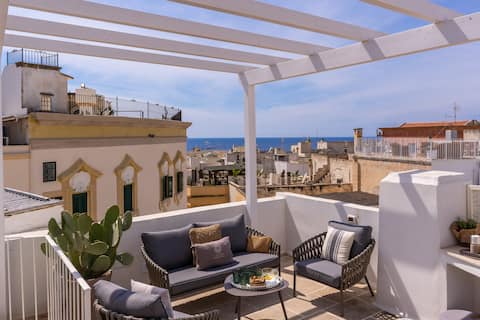
Top Performing Airbnb Properties in Gallipoli (2026)
Benchmark your potential! Explore examples of top-performing Airbnb properties in Gallipolibased on Trailing Twelve Month (TTM) revenue. Analyze their characteristics, revenue, occupancy rate, and ADR to understand what drives success in this market.

Sunrise's House - Seafront - Downtown Gallipoli
Entire Place • 1 bedroom
SEA HOME Gallipoli_150 meters from the sea_2-minute walk
Entire Place • 2 bedrooms
Fabulous historic Palazzetto breathtaking seaview
Entire Place • 4 bedrooms
Palazzo Santa Caterina - Valentina's Houses
Entire Place • 4 bedrooms

Villa Panacea
Entire Place • 3 bedrooms

Sunset's House - Seafront - Gallipoli Center
Entire Place • 1 bedroom
Note: Performance varies based on location, size, amenities, seasonality, and management quality. Data reflects the past 12 months.
Top Performing Airbnb Hosts in Gallipoli (2026)
Learn from the best! This table showcases top-performing Airbnb hosts in Gallipoli based on the number of properties managed and estimated total revenue over the past year. Analyze their scale and performance metrics.
| Host Name | Properties | Grossing Revenue | Stay Reviews | Avg Rating |
|---|---|---|---|---|
| Alessandra | 48 | $363,430 | 244 | 4.45/5.0 |
| Barbarhouse SRL | 47 | $343,354 | 829 | 4.35/5.0 |
| Salvatore | 3 | $291,904 | 61 | 4.85/5.0 |
| Ludovica | 10 | $221,692 | 70 | 4.61/5.0 |
| Valentina | 6 | $215,716 | 426 | 4.79/5.0 |
| Domenico | 16 | $201,116 | 305 | 4.95/5.0 |
| Alessio | 35 | $193,242 | 174 | 4.25/5.0 |
| Shs Salento Holiday Services | 26 | $179,582 | 86 | 4.71/5.0 |
| ~ Buena Onda | 8 | $174,717 | 58 | 4.68/5.0 |
| Fabio | 10 | $137,046 | 98 | 4.63/5.0 |
Analyzing the strategies of top hosts, such as their property selection, pricing, and guest communication, can offer valuable lessons for optimizing your own Airbnb operations in Gallipoli.
Dive Deeper: Advanced Gallipoli STR Market Data (2026)
Ready to unlock more insights? AirROI provides access to advanced metrics and comprehensive Airbnb data for Gallipoli. Explore detailed analytics beyond this report to refine your investment strategy, optimize pricing, and maximize your vacation rental profits.
Explore Advanced MetricsGallipoli Short-Term Rental Market Composition (2026): Property & Room Types
Room Type Distribution
Property Type Distribution
Market Composition Insights for Gallipoli
- The Gallipoli Airbnb market composition is heavily skewed towards Entire Home/Apt listings, which make up 87.4% of the 1,010 active rentals. This indicates strong guest preference for privacy and space.
- Looking at the property type distribution in Gallipoli, Apartment/Condo properties are the most common (57.8%), reflecting the local real estate landscape.
- Houses represent a significant 30.7% portion, catering likely to families or larger groups.
- The presence of 10.1% Hotel/Boutique listings indicates integration with traditional hospitality.
- Smaller segments like others, outdoor/unique, unique stays (combined 1.4%) offer potential for unique stay experiences.
Gallipoli Airbnb Room Capacity Analysis (2026): Bedroom Distribution
Distribution of Listings by Number of Bedrooms
Room Capacity Insights for Gallipoli
- The dominant room capacity in Gallipoli is 2 bedrooms listings, making up 36.8% of the market. This suggests a strong demand for properties suitable for couples or solo travelers.
- Together, 2 bedrooms and 1 bedroom properties represent 72.4% of the active Airbnb listings in Gallipoli, indicating a high concentration in these sizes.
Gallipoli Vacation Rental Guest Capacity Trends (2026)
Distribution of Listings by Guest Capacity
Guest Capacity Insights for Gallipoli
- The most common guest capacity trend in Gallipoli vacation rentals is listings accommodating 4 guests (27.1%). This suggests the primary traveler segment is likely small families or groups.
- Properties designed for 4 guests and 6 guests dominate the Gallipoli STR market, accounting for 44.4% of listings.
- 34.6% of properties accommodate 6+ guests, serving the market segment for larger families or group travel in Gallipoli.
- On average, properties in Gallipoli are equipped to host 4.5 guests.
Gallipoli Airbnb Booking Patterns (2026): Available vs. Booked Days
Available Days Distribution
Booked Days Distribution
Booking Pattern Insights for Gallipoli
- The most common availability pattern in Gallipoli falls within the 271-366 days range, representing 85.5% of listings. This suggests many properties have significant open periods on their calendars.
- Approximately 98.4% of listings show high availability (181+ days open annually), indicating potential for increased bookings or specific owner usage patterns.
- For booked days, the 31-90 days range is most frequent in Gallipoli (44.7%), reflecting common guest stay durations or potential owner blocking patterns.
- A notable 2.1% of properties secure long booking periods (181+ days booked per year), highlighting successful long-term rental strategies or significant owner usage.
Gallipoli Airbnb Minimum Stay Requirements Analysis
Distribution of Listings by Minimum Night Requirement
1 Night
85 listings
8.4% of total
2 Nights
59 listings
5.8% of total
3 Nights
73 listings
7.2% of total
4-6 Nights
175 listings
17.3% of total
7-29 Nights
109 listings
10.8% of total
30+ Nights
509 listings
50.4% of total
Key Insights
- The most prevalent minimum stay requirement in Gallipoli is 30+ Nights, adopted by 50.4% of listings. This highlights the market's preference for longer commitments.
- Very short stays (1-2 nights) are less common (14.2%), suggesting hosts prefer slightly longer bookings to optimize turnover.
- A significant segment (50.4%) caters to monthly stays (30+ nights) in Gallipoli, pointing to opportunities in the extended-stay market.
Recommendations
- Align with the market by considering a 30+ Nights minimum stay, as 50.4% of Gallipoli hosts use this setting.
- If feasible, allowing 1-night stays, especially midweek or during low season, could capture last-minute bookings, as only 8.4% currently do.
- Explore offering discounts for stays of 30+ nights to attract the 50.4% of the market seeking extended stays.
- Adjust minimum nights based on seasonality – potentially shorter during low season and longer during peak demand periods in Gallipoli.
Gallipoli Airbnb Cancellation Policy Trends Analysis (2026)
Limited
1 listings
0.1% of total
Super Strict 30 Days
41 listings
4.1% of total
Super Strict 60 Days
68 listings
6.8% of total
Flexible
143 listings
14.2% of total
Moderate
229 listings
22.8% of total
Firm
381 listings
37.9% of total
Strict
143 listings
14.2% of total
Cancellation Policy Insights for Gallipoli
- The prevailing Airbnb cancellation policy trend in Gallipoli is Firm, used by 37.9% of listings.
- A majority (52.1%) of hosts in Gallipoli utilize Firm or Strict policies, indicating a market where hosts prioritize booking security.
Recommendations for Hosts
- Consider adopting a Firm policy to align with the 37.9% market standard in Gallipoli.
- Using a Strict policy might deter some guests, as only 14.2% of listings use it. Evaluate if potential revenue protection outweighs possible lower booking rates.
- Regularly review your cancellation policy against competitors and market demand shifts in Gallipoli.
Gallipoli STR Booking Lead Time Analysis (2026)
Average Booking Lead Time by Month
Booking Lead Time Insights for Gallipoli
- The overall average booking lead time for vacation rentals in Gallipoli is 58 days.
- Guests book furthest in advance for stays during August (average 75 days), likely coinciding with peak travel demand or local events.
- The shortest booking windows occur for stays in January (average 25 days), indicating more last-minute travel plans during this time.
- Seasonally, Summer (63 days avg.) sees the longest lead times, while Winter (28 days avg.) has the shortest, reflecting typical travel planning cycles.
Recommendations for Hosts
- Use the overall average lead time (58 days) as a baseline for your pricing and availability strategy in Gallipoli.
- For August stays, consider implementing length-of-stay discounts or slightly higher rates for bookings made less than 75 days out to capitalize on advance planning.
- Target marketing efforts for the Summer season well in advance (at least 63 days) to capture early planners.
- Monitor your own booking lead times against these Gallipoli averages to identify opportunities for dynamic pricing adjustments.
Popular & Essential Airbnb Amenities in Gallipoli (2026)
Amenity Prevalence
Amenity Insights for Gallipoli
- Popular amenities like Air conditioning, TV, Kitchen are common but not universal. Offering these can provide a competitive edge.
Recommendations for Hosts
- Consider adding popular differentiators like Air conditioning or TV to increase appeal.
- Highlight unique or less common amenities you offer (e.g., hot tub, dedicated workspace, EV charger) in your listing description and photos.
- Regularly check competitor amenities in Gallipoli to stay competitive.
Gallipoli Airbnb Guest Demographics & Profile Analysis (2026)
Guest Profile Summary for Gallipoli
- The typical guest profile for Airbnb in Gallipoli consists of predominantly international visitors (82%), with top international origins including France, typically belonging to the Post-2000s (Gen Z/Alpha) group (50%), primarily speaking English or French.
- Domestic travelers account for 18.3% of guests.
- Key international markets include Italy (18.3%) and France (17%).
- Top languages spoken are English (37%) followed by French (16%).
- A significant demographic segment is the Post-2000s (Gen Z/Alpha) group, representing 50% of guests.
Recommendations for Hosts
- Focus marketing internationally, particularly towards travelers from France.
- Tailor amenities and listing descriptions to appeal to the dominant Post-2000s (Gen Z/Alpha) demographic (e.g., highlight fast WiFi, smart home features, local guides).
- Highlight unique local experiences or amenities relevant to the primary guest profile.
- Consider seasonal promotions aligned with peak travel times for key origin markets.
Nearby Short-Term Rental Market Comparison
How does the Gallipoli Airbnb market stack up against its neighbors? Compare key performance metrics like average monthly revenue, ADR, and occupancy rates in surrounding areas to understand the broader regional STR landscape.
| Market | Active Properties | Monthly Revenue | Daily Rate | Avg. Occupancy |
|---|---|---|---|---|
| San Michele Salentino | 76 | $2,635 | $296.04 | 46% |
| Sanarica | 14 | $2,311 | $227.51 | 35% |
| Castellana Grotte | 194 | $2,129 | $242.07 | 42% |
| Carovigno | 442 | $2,005 | $283.77 | 41% |
| Polignano a Mare | 718 | $1,915 | $201.20 | 43% |
| San Vito dei Normanni | 168 | $1,885 | $272.31 | 42% |
| Muro Leccese | 29 | $1,863 | $336.37 | 35% |
| Ostuni | 1,596 | $1,855 | $262.11 | 37% |
| Lequile | 22 | $1,790 | $177.86 | 45% |
| Monopoli | 1,240 | $1,734 | $200.27 | 42% |