Grottaglie Airbnb Market Analysis 2026: Short Term Rental Data & Vacation Rental Statistics in Apulia, Italy
Is Airbnb profitable in Grottaglie in 2026? Explore comprehensive Airbnb analytics for Grottaglie, Apulia, Italy to uncover income potential. This 2026 STR market report for Grottaglie, based on AirROI data from February 2025 to January 2026, reveals key trends in the niche market of 39 active listings.
Whether you're considering an Airbnb investment in Grottaglie, optimizing your existing vacation rental, or exploring rental arbitrage opportunities, understanding the Grottaglie Airbnb data is crucial. Navigating the high regulation landscape is key to maximizing your short term rental income potential. Let's dive into the specifics.
Key Grottaglie Airbnb Performance Metrics Overview
Monthly Airbnb Revenue Variations & Income Potential in Grottaglie (2026)
Understanding the monthly revenue variations for Airbnb listings in Grottaglie is key to maximizing your short term rental income potential. Seasonality significantly impacts earnings. Our analysis, based on data from the past 12 months, shows that the peak revenue month for STRs in Grottaglie is typically August, while November often presents the lowest earnings, highlighting opportunities for strategic pricing adjustments during shoulder and low seasons. Explore the typical Airbnb income in Grottaglie across different performance tiers:
- Best-in-class properties (Top 10%) achieve $3,065+ monthly, often utilizing dynamic pricing and superior guest experiences.
- Strong performing properties (Top 25%) earn $1,491 or more, indicating effective management and desirable locations/amenities.
- Typical properties (Median) generate around $620 per month, representing the average market performance.
- Entry-level properties (Bottom 25%) see earnings around $304, often with potential for optimization.
Average Monthly Airbnb Earnings Trend in Grottaglie
Grottaglie Airbnb Occupancy Rate Trends (2026)
Maximize your bookings by understanding the Grottaglie STR occupancy trends. Seasonal demand shifts significantly influence how often properties are booked. Typically, Augustsees the highest demand (peak season occupancy), while November experiences the lowest (low season). Effective strategies, like adjusting minimum stays or offering promotions, can boost occupancy during slower periods. Here's how different property tiers perform in Grottaglie:
- Best-in-class properties (Top 10%) achieve 63%+ occupancy, indicating high desirability and potentially optimized availability.
- Strong performing properties (Top 25%) maintain 41% or higher occupancy, suggesting good market fit and guest satisfaction.
- Typical properties (Median) have an occupancy rate around 20%.
- Entry-level properties (Bottom 25%) average 10% occupancy, potentially facing higher vacancy.
Average Monthly Occupancy Rate Trend in Grottaglie
Average Daily Rate (ADR) Airbnb Trends in Grottaglie (2026)
Effective short term rental pricing strategy in Grottaglie involves understanding monthly ADR fluctuations. The Average Daily Rate (ADR) for Airbnb in Grottaglie typically peaks in December and dips lowest during March. Leveraging Airbnb dynamic pricing tools or strategies based on this seasonality can significantly boost revenue. Here's a look at the typical nightly rates achieved:
- Best-in-class properties (Top 10%) command rates of $248+ per night, often due to premium features or locations.
- Strong performing properties (Top 25%) achieve nightly rates of $121 or more.
- Typical properties (Median) charge around $88 per night.
- Entry-level properties (Bottom 25%) earn around $65 per night.
Average Daily Rate (ADR) Trend by Month in Grottaglie
Get Live Grottaglie Market Intelligence 👇

Explore Real-time Analytics
Airbnb Seasonality Analysis & Trends in Grottaglie (2026)
Peak Season (August, January, September)
- Revenue averages $2,327 per month
- Occupancy rates average 33.1%
- Daily rates average $142
Shoulder Season
- Revenue averages $1,309 per month
- Occupancy maintains around 28.2%
- Daily rates hold near $123
Low Season (February, November, December)
- Revenue drops to average $679 per month
- Occupancy decreases to average 21.9%
- Daily rates adjust to average $141
Seasonality Insights for Grottaglie
- The Airbnb seasonality in Grottaglie shows highly seasonal trends requiring careful strategy. While the sections above show seasonal averages, it's also insightful to look at the extremes:
- During the high season, the absolute peak month showcases Grottaglie's highest earning potential, with monthly revenues capable of climbing to $2,594, occupancy reaching a high of 45.8%, and ADRs peaking at $159.
- Conversely, the slowest single month of the year, typically falling within the low season, marks the market's lowest point. In this month, revenue might dip to $507, occupancy could drop to 18.1%, and ADRs may adjust down to $109.
- Understanding both the seasonal averages and these monthly peaks and troughs in revenue, occupancy, and ADR is crucial for maximizing your Airbnb profit potential in Grottaglie.
Seasonal Strategies for Maximizing Profit
- Peak Season: Maximize revenue through premium pricing and potentially longer minimum stays. Ensure high availability.
- Low Season: Offer competitive pricing, special promotions (e.g., extended stay discounts), and flexible cancellation policies. Target off-season travelers like remote workers or budget-conscious guests.
- Shoulder Seasons: Implement dynamic pricing that balances peak and low rates. Target weekend travelers or specific events. Offer slightly more flexible terms than peak season.
- Regularly analyze your own performance against these Grottaglie seasonality benchmarks and adjust your pricing and availability strategy accordingly.
Best Areas for Airbnb Investment in Grottaglie (2026)
Exploring the top neighborhoods for short-term rentals in Grottaglie? This section highlights key areas, outlining why they are attractive for hosts and guests, along with notable local attractions. Consider these locations based on your target guest profile and investment strategy.
| Neighborhood / Area | Why Host Here? (Target Guests & Appeal) | Key Attractions & Landmarks |
|---|---|---|
| Centro Storico | The historic center of Grottaglie, known for its beautiful architecture, local crafts, and charming streets. It attracts tourists interested in culture and history, making it a prime location for Airbnb. | Castello Episcopio, Ceramics shops, San Francesco Church, Piazza G. De Tirrenia, Palazzo Chiaramonte |
| Parco della Civiltà | A tranquil area ideal for families and nature lovers, featuring parks and recreation facilities. It's a great escape for those looking to relax yet still be close to the city. | Parco della Civiltà, Sports facilities, Walking trails |
| Quartiere delle Ceramiche | Famous for its artisan ceramic production, this neighborhood appeals to tourists interested in local crafts and art, providing a unique cultural experience. | Ceramic workshops, Local art galleries, Annual ceramic festivals |
| Via Mazzini | This bustling street is lined with shops and eateries, popular among both locals and tourists. Its vibrant atmosphere makes it attractive for short-term rentals. | Shops and boutiques, Cafes and restaurants, Local markets |
| Teatro Comunale di Grottaglie | Located near the main cultural hub, this area is great for those interested in performing arts and events, attracting cultural tourists. | Teatro Comunale, Various performance events, Art exhibits nearby |
| Grottaglie Vineyards | Close to vineyards and wineries, it’s a prime location for wine lovers and those seeking rustic charm. Offers unique experiences for guests who want to explore local wines. | Vineyard tours, Wine tasting events, Agritourism experiences |
| San Marzano | This neighboring town is known for its wine production and traditional Apulian cuisine, attracting culinary tourists looking for local experiences. | Local wineries, Traditional restaurants, Food festivals |
| Coastal Proximity | Being close to the coast offers access to beautiful beaches and seaside activities, drawing in vacationers looking for sun and relaxation. | Nearby beaches, Water sports activities, Coastal walks |
Understanding Airbnb License Requirements & STR Laws in Grottaglie (2026)
Yes, Grottaglie, Apulia, Italy enforces high STR regulations. Obtaining a license and ensuring compliance is almost certainly required according to current 2026 STR laws. Always verify the latest short term rental regulations and Airbnb license requirements directly with local government authorities for Grottaglie to ensure full compliance before hosting.
(Source: AirROI data, 2026, based on 82% licensed listings)
Top Performing Airbnb Properties in Grottaglie (2026)
Benchmark your potential! Explore examples of top-performing Airbnb properties in Grottagliebased on Trailing Twelve Month (TTM) revenue. Analyze their characteristics, revenue, occupancy rate, and ADR to understand what drives success in this market.
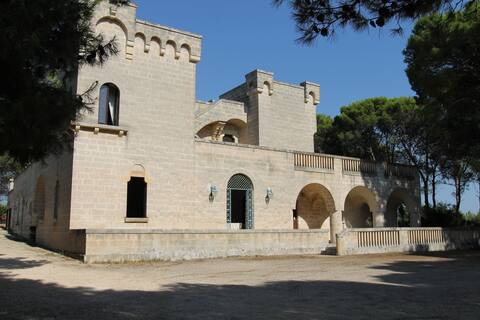
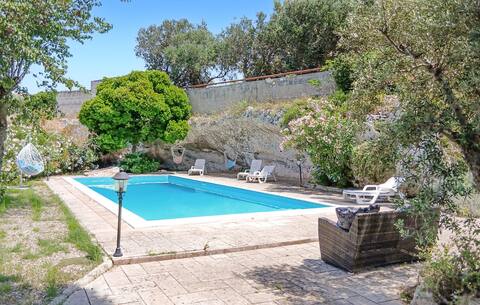
Splendid Villa with Swimming Pool, peaceful oasis!!!
Entire Place • 7 bedrooms

Cozy home in Grottaglie with kitchen
Entire Place • 3 bedrooms
Villa d'Itria
Entire Place • 3 bedrooms
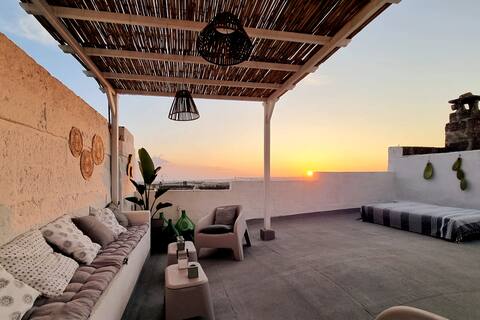
''Li Pumi'' House in Grottaglie - entire home
Entire Place • 2 bedrooms

Entire property - Historic centre, Grottaglie
Entire Place • 2 bedrooms

MOH® Il Maniero - Episcopio Castle, Grottaglie
Entire Place • 2 bedrooms
Note: Performance varies based on location, size, amenities, seasonality, and management quality. Data reflects the past 12 months.
Top Performing Airbnb Hosts in Grottaglie (2026)
Learn from the best! This table showcases top-performing Airbnb hosts in Grottaglie based on the number of properties managed and estimated total revenue over the past year. Analyze their scale and performance metrics.
| Host Name | Properties | Grossing Revenue | Stay Reviews | Avg Rating |
|---|---|---|---|---|
| Marcantonio | 1 | $51,957 | 4 | 5.00/5.0 |
| Novasol | 1 | $36,534 | 5 | 5.00/5.0 |
| Novasol | 1 | $29,905 | 1 | Not Rated |
| Pietro | 1 | $26,929 | 57 | 5.00/5.0 |
| Fabio | 1 | $26,696 | 11 | 4.91/5.0 |
| Le Maioliche | 5 | $21,103 | 67 | 4.75/5.0 |
| Leonardo | 1 | $20,044 | 13 | 4.92/5.0 |
| Novasol | 1 | $19,182 | 6 | 4.50/5.0 |
| Ciro | 1 | $16,198 | 72 | 4.89/5.0 |
| Novasol | 1 | $16,084 | 1 | Not Rated |
Analyzing the strategies of top hosts, such as their property selection, pricing, and guest communication, can offer valuable lessons for optimizing your own Airbnb operations in Grottaglie.
Dive Deeper: Advanced Grottaglie STR Market Data (2026)
Ready to unlock more insights? AirROI provides access to advanced metrics and comprehensive Airbnb data for Grottaglie. Explore detailed analytics beyond this report to refine your investment strategy, optimize pricing, and maximize your vacation rental profits.
Explore Advanced MetricsGrottaglie Short-Term Rental Market Composition (2026): Property & Room Types
Room Type Distribution
Property Type Distribution
Market Composition Insights for Grottaglie
- The Grottaglie Airbnb market composition is heavily skewed towards Entire Home/Apt listings, which make up 74.4% of the 39 active rentals. This indicates strong guest preference for privacy and space.
- Looking at the property type distribution in Grottaglie, House properties are the most common (46.2%), reflecting the local real estate landscape.
- Houses represent a significant 46.2% portion, catering likely to families or larger groups.
- The presence of 20.5% Hotel/Boutique listings indicates integration with traditional hospitality.
- Smaller segments like unique stays, outdoor/unique (combined 5.2%) offer potential for unique stay experiences.
Grottaglie Airbnb Room Capacity Analysis (2026): Bedroom Distribution
Distribution of Listings by Number of Bedrooms
Room Capacity Insights for Grottaglie
- The dominant room capacity in Grottaglie is 1 bedroom listings, making up 43.6% of the market. This suggests a strong demand for properties suitable for couples or solo travelers.
- Together, 1 bedroom and 2 bedrooms properties represent 69.2% of the active Airbnb listings in Grottaglie, indicating a high concentration in these sizes.
Grottaglie Vacation Rental Guest Capacity Trends (2026)
Distribution of Listings by Guest Capacity
Guest Capacity Insights for Grottaglie
- The most common guest capacity trend in Grottaglie vacation rentals is listings accommodating 4 guests (30.8%). This suggests the primary traveler segment is likely small families or groups.
- Properties designed for 4 guests and 3 guests dominate the Grottaglie STR market, accounting for 48.7% of listings.
- 18.0% of properties accommodate 6+ guests, serving the market segment for larger families or group travel in Grottaglie.
- On average, properties in Grottaglie are equipped to host 3.3 guests.
Grottaglie Airbnb Booking Patterns (2026): Available vs. Booked Days
Available Days Distribution
Booked Days Distribution
Booking Pattern Insights for Grottaglie
- The most common availability pattern in Grottaglie falls within the 271-366 days range, representing 76.9% of listings. This suggests many properties have significant open periods on their calendars.
- Approximately 94.8% of listings show high availability (181+ days open annually), indicating potential for increased bookings or specific owner usage patterns.
- For booked days, the 31-90 days range is most frequent in Grottaglie (41%), reflecting common guest stay durations or potential owner blocking patterns.
- A notable 5.1% of properties secure long booking periods (181+ days booked per year), highlighting successful long-term rental strategies or significant owner usage.
Grottaglie Airbnb Minimum Stay Requirements Analysis
Distribution of Listings by Minimum Night Requirement
1 Night
19 listings
48.7% of total
2 Nights
7 listings
17.9% of total
3 Nights
1 listings
2.6% of total
4-6 Nights
2 listings
5.1% of total
30+ Nights
10 listings
25.6% of total
Key Insights
- The most prevalent minimum stay requirement in Grottaglie is 1 Night, adopted by 48.7% of listings. This highlights the market's preference for shorter, flexible bookings.
- A strong majority (66.6%) of the Grottaglie Airbnb data shows acceptance of very short stays (1-2 nights), indicating a dynamic, high-turnover market.
- A significant segment (25.6%) caters to monthly stays (30+ nights) in Grottaglie, pointing to opportunities in the extended-stay market.
Recommendations
- Align with the market by considering a 1 Night minimum stay, as 48.7% of Grottaglie hosts use this setting.
- Explore offering discounts for stays of 30+ nights to attract the 25.6% of the market seeking extended stays.
- Adjust minimum nights based on seasonality – potentially shorter during low season and longer during peak demand periods in Grottaglie.
Grottaglie Airbnb Cancellation Policy Trends Analysis (2026)
Super Strict 60 Days
4 listings
10.5% of total
Flexible
17 listings
44.7% of total
Moderate
10 listings
26.3% of total
Firm
5 listings
13.2% of total
Strict
2 listings
5.3% of total
Cancellation Policy Insights for Grottaglie
- The prevailing Airbnb cancellation policy trend in Grottaglie is Flexible, used by 44.7% of listings.
- The market strongly favors guest-friendly terms, with 71.0% of listings offering Flexible or Moderate policies. This suggests guests in Grottaglie may expect booking flexibility.
- Strict cancellation policies are quite rare (5.3%), potentially making listings with this policy less competitive unless justified by high demand or property type.
Recommendations for Hosts
- Consider adopting a Flexible policy to align with the 44.7% market standard in Grottaglie.
- Using a Strict policy might deter some guests, as only 5.3% of listings use it. Evaluate if potential revenue protection outweighs possible lower booking rates.
- Regularly review your cancellation policy against competitors and market demand shifts in Grottaglie.
Grottaglie STR Booking Lead Time Analysis (2026)
Average Booking Lead Time by Month
Booking Lead Time Insights for Grottaglie
- The overall average booking lead time for vacation rentals in Grottaglie is 65 days.
- Guests book furthest in advance for stays during August (average 91 days), likely coinciding with peak travel demand or local events.
- The shortest booking windows occur for stays in November (average 15 days), indicating more last-minute travel plans during this time.
- Seasonally, Summer (67 days avg.) sees the longest lead times, while Winter (32 days avg.) has the shortest, reflecting typical travel planning cycles.
Recommendations for Hosts
- Use the overall average lead time (65 days) as a baseline for your pricing and availability strategy in Grottaglie.
- For August stays, consider implementing length-of-stay discounts or slightly higher rates for bookings made less than 91 days out to capitalize on advance planning.
- Target marketing efforts for the Summer season well in advance (at least 67 days) to capture early planners.
- Monitor your own booking lead times against these Grottaglie averages to identify opportunities for dynamic pricing adjustments.
Popular & Essential Airbnb Amenities in Grottaglie (2026)
Amenity Prevalence
Amenity Insights for Grottaglie
- Essential amenities in Grottaglie that guests expect include: Wifi. Lacking these (this) could significantly impact bookings.
- Popular amenities like Heating, Air conditioning, TV are common but not universal. Offering these can provide a competitive edge.
Recommendations for Hosts
- Ensure your listing includes all essential amenities for Grottaglie: Wifi.
- Consider adding popular differentiators like Heating or Air conditioning to increase appeal.
- Highlight unique or less common amenities you offer (e.g., hot tub, dedicated workspace, EV charger) in your listing description and photos.
- Regularly check competitor amenities in Grottaglie to stay competitive.
Grottaglie Airbnb Guest Demographics & Profile Analysis (2026)
Guest Profile Summary for Grottaglie
- The typical guest profile for Airbnb in Grottaglie consists of predominantly international visitors (88%), with top international origins including United Kingdom, typically belonging to the Post-2000s (Gen Z/Alpha) group (50%), primarily speaking English or French.
- Domestic travelers account for 11.6% of guests.
- Key international markets include France (30.2%) and United Kingdom (15.1%).
- Top languages spoken are English (36.4%) followed by French (21.5%).
- A significant demographic segment is the Post-2000s (Gen Z/Alpha) group, representing 50% of guests.
Recommendations for Hosts
- Focus marketing internationally, particularly towards travelers from United Kingdom.
- Tailor amenities and listing descriptions to appeal to the dominant Post-2000s (Gen Z/Alpha) demographic (e.g., highlight fast WiFi, smart home features, local guides).
- Highlight unique local experiences or amenities relevant to the primary guest profile.
- Consider seasonal promotions aligned with peak travel times for key origin markets.
Nearby Short-Term Rental Market Comparison
How does the Grottaglie Airbnb market stack up against its neighbors? Compare key performance metrics like average monthly revenue, ADR, and occupancy rates in surrounding areas to understand the broader regional STR landscape.
| Market | Active Properties | Monthly Revenue | Daily Rate | Avg. Occupancy |
|---|---|---|---|---|
| San Michele Salentino | 76 | $2,635 | $296.04 | 46% |
| Sanarica | 14 | $2,311 | $227.51 | 35% |
| Castellana Grotte | 194 | $2,129 | $242.07 | 42% |
| Carovigno | 442 | $2,005 | $283.77 | 41% |
| Polignano a Mare | 718 | $1,915 | $201.20 | 43% |
| San Vito dei Normanni | 168 | $1,885 | $272.31 | 42% |
| Muro Leccese | 29 | $1,863 | $336.37 | 35% |
| Ostuni | 1,596 | $1,855 | $262.11 | 37% |
| Lequile | 22 | $1,790 | $177.86 | 45% |
| Monopoli | 1,240 | $1,734 | $200.27 | 42% |