Leverano Airbnb Market Analysis 2026: Short Term Rental Data & Vacation Rental Statistics in Apulia, Italy
Is Airbnb profitable in Leverano in 2026? Explore comprehensive Airbnb analytics for Leverano, Apulia, Italy to uncover income potential. This 2026 STR market report for Leverano, based on AirROI data from February 2025 to January 2026, reveals key trends in the niche market of 55 active listings.
Whether you're considering an Airbnb investment in Leverano, optimizing your existing vacation rental, or exploring rental arbitrage opportunities, understanding the Leverano Airbnb data is crucial. Navigating the high regulation landscape is key to maximizing your short term rental income potential. Let's dive into the specifics.
Key Leverano Airbnb Performance Metrics Overview
Monthly Airbnb Revenue Variations & Income Potential in Leverano (2026)
Understanding the monthly revenue variations for Airbnb listings in Leverano is key to maximizing your short term rental income potential. Seasonality significantly impacts earnings. Our analysis, based on data from the past 12 months, shows that the peak revenue month for STRs in Leverano is typically August, while February often presents the lowest earnings, highlighting opportunities for strategic pricing adjustments during shoulder and low seasons. Explore the typical Airbnb income in Leverano across different performance tiers:
- Best-in-class properties (Top 10%) achieve $1,921+ monthly, often utilizing dynamic pricing and superior guest experiences.
- Strong performing properties (Top 25%) earn $1,112 or more, indicating effective management and desirable locations/amenities.
- Typical properties (Median) generate around $622 per month, representing the average market performance.
- Entry-level properties (Bottom 25%) see earnings around $253, often with potential for optimization.
Average Monthly Airbnb Earnings Trend in Leverano
Leverano Airbnb Occupancy Rate Trends (2026)
Maximize your bookings by understanding the Leverano STR occupancy trends. Seasonal demand shifts significantly influence how often properties are booked. Typically, Augustsees the highest demand (peak season occupancy), while May experiences the lowest (low season). Effective strategies, like adjusting minimum stays or offering promotions, can boost occupancy during slower periods. Here's how different property tiers perform in Leverano:
- Best-in-class properties (Top 10%) achieve 60%+ occupancy, indicating high desirability and potentially optimized availability.
- Strong performing properties (Top 25%) maintain 40% or higher occupancy, suggesting good market fit and guest satisfaction.
- Typical properties (Median) have an occupancy rate around 19%.
- Entry-level properties (Bottom 25%) average 9% occupancy, potentially facing higher vacancy.
Average Monthly Occupancy Rate Trend in Leverano
Average Daily Rate (ADR) Airbnb Trends in Leverano (2026)
Effective short term rental pricing strategy in Leverano involves understanding monthly ADR fluctuations. The Average Daily Rate (ADR) for Airbnb in Leverano typically peaks in August and dips lowest during January. Leveraging Airbnb dynamic pricing tools or strategies based on this seasonality can significantly boost revenue. Here's a look at the typical nightly rates achieved:
- Best-in-class properties (Top 10%) command rates of $192+ per night, often due to premium features or locations.
- Strong performing properties (Top 25%) achieve nightly rates of $127 or more.
- Typical properties (Median) charge around $90 per night.
- Entry-level properties (Bottom 25%) earn around $71 per night.
Average Daily Rate (ADR) Trend by Month in Leverano
Get Live Leverano Market Intelligence 👇

Explore Real-time Analytics
Airbnb Seasonality Analysis & Trends in Leverano (2026)
Peak Season (August, November, July)
- Revenue averages $1,648 per month
- Occupancy rates average 47.3%
- Daily rates average $117
Shoulder Season
- Revenue averages $689 per month
- Occupancy maintains around 21.5%
- Daily rates hold near $106
Low Season (February, March, May)
- Revenue drops to average $379 per month
- Occupancy decreases to average 15.7%
- Daily rates adjust to average $109
Seasonality Insights for Leverano
- The Airbnb seasonality in Leverano shows highly seasonal trends requiring careful strategy. While the sections above show seasonal averages, it's also insightful to look at the extremes:
- During the high season, the absolute peak month showcases Leverano's highest earning potential, with monthly revenues capable of climbing to $2,166, occupancy reaching a high of 54.7%, and ADRs peaking at $129.
- Conversely, the slowest single month of the year, typically falling within the low season, marks the market's lowest point. In this month, revenue might dip to $305, occupancy could drop to 11.0%, and ADRs may adjust down to $101.
- Understanding both the seasonal averages and these monthly peaks and troughs in revenue, occupancy, and ADR is crucial for maximizing your Airbnb profit potential in Leverano.
Seasonal Strategies for Maximizing Profit
- Peak Season: Maximize revenue through premium pricing and potentially longer minimum stays. Ensure high availability.
- Low Season: Offer competitive pricing, special promotions (e.g., extended stay discounts), and flexible cancellation policies. Target off-season travelers like remote workers or budget-conscious guests.
- Shoulder Seasons: Implement dynamic pricing that balances peak and low rates. Target weekend travelers or specific events. Offer slightly more flexible terms than peak season.
- Regularly analyze your own performance against these Leverano seasonality benchmarks and adjust your pricing and availability strategy accordingly.
Best Areas for Airbnb Investment in Leverano (2026)
Exploring the top neighborhoods for short-term rentals in Leverano? This section highlights key areas, outlining why they are attractive for hosts and guests, along with notable local attractions. Consider these locations based on your target guest profile and investment strategy.
| Neighborhood / Area | Why Host Here? (Target Guests & Appeal) | Key Attractions & Landmarks |
|---|---|---|
| Centro Storico | The historic center of Leverano, known for its charming narrow streets and historical architecture. A popular choice for tourists looking to experience local culture and history. | Church of Santa Maria della Consolazione, Civic Tower, Piazza Mukrino, Local restaurants, Art galleries |
| Vigneti | The wine-producing area surrounding Leverano, known for its vineyards and beautiful landscapes. Attracts wine enthusiasts and travelers looking for a rural retreat. | Wine tours and tastings, Vineyard walking trails, Local festivals, Agriturismos, Scenic countryside views |
| Posto Rosso | A beautiful beach area nearby, perfect for sunbathers and families. Hosts many summer visitors looking for a quiet beach getaway. | Local beaches, Beachfront restaurants, Water sports activities, Sunset views, Lifeguarded areas |
| Leverano Market Area | The area surrounding the local market, bustling with activity and local charm. Great for those wanting to experience daily Italian life and local cuisine. | Weekly markets, Local culinary delicacies, Food stalls, Cafes and bakeries, Shopping |
| Corte de' Frati | A quaint neighborhood known for its peaceful atmosphere and community vibe. Ideal for long-term stays and retreat seekers. | Quiet parks, Community events, Holiday festivals, Local craft shops, Artisan workshops |
| Countryside Farms | The peaceful countryside surrounding Leverano, perfect for travelers looking for relaxation and nature. Ideal for those interested in agritourism. | Farm stays, Nature walks, Organic produce, Local wildlife, Countryside beauty |
| Salice Salentino | A nearby town known for its wine production and local festivals, attracting visitors who want a more rural experience while being close to Leverano. | Wine festivals, Cultural events, Local gastronomy, Historical sites, Community gatherings |
| Scenic Coastal Routes | The coastal roads leading to Leverano offer stunning views and access to various beaches and small coves, appealing to travelers who love coastal adventures. | Biking and walking paths, Hidden beaches, Scenic lookout points, Picnic spots, Coastal parks |
Understanding Airbnb License Requirements & STR Laws in Leverano (2026)
Yes, Leverano, Apulia, Italy enforces high STR regulations. Obtaining a license and ensuring compliance is almost certainly required according to current 2026 STR laws. Always verify the latest short term rental regulations and Airbnb license requirements directly with local government authorities for Leverano to ensure full compliance before hosting.
(Source: AirROI data, 2026, based on 80% licensed listings)
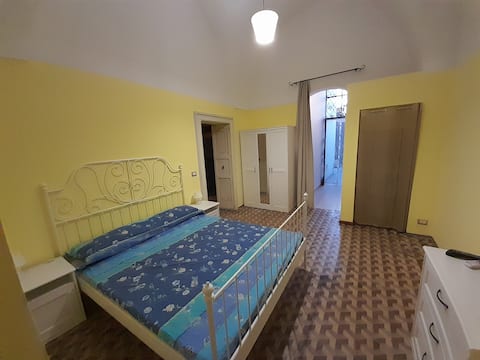
Top Performing Airbnb Properties in Leverano (2026)
Benchmark your potential! Explore examples of top-performing Airbnb properties in Leveranobased on Trailing Twelve Month (TTM) revenue. Analyze their characteristics, revenue, occupancy rate, and ADR to understand what drives success in this market.

Millions Star Home by Cala Salento
Entire Place • 4 bedrooms
Sweet Home
Entire Place • 1 bedroom

NeroAmaro Home - Salento Selection
Entire Place • 2 bedrooms

Comfortable, independent double bedroom.
Entire Place • 1 bedroom

ANCIENT PUGLIA: PAMPI TWO-BEDROOM APARTMENT
Entire Place • 1 bedroom

Apartment in the center of Leverano
Entire Place • 1 bedroom
Note: Performance varies based on location, size, amenities, seasonality, and management quality. Data reflects the past 12 months.
Top Performing Airbnb Hosts in Leverano (2026)
Learn from the best! This table showcases top-performing Airbnb hosts in Leverano based on the number of properties managed and estimated total revenue over the past year. Analyze their scale and performance metrics.
| Host Name | Properties | Grossing Revenue | Stay Reviews | Avg Rating |
|---|---|---|---|---|
| Salento Selection | 2 | $22,893 | 3 | Not Rated |
| Cala Salento | 1 | $20,441 | 1 | Not Rated |
| David | 1 | $16,149 | 3 | 4.67/5.0 |
| Barbarhouse SRL | 4 | $13,998 | 11 | 4.54/5.0 |
| Taniel | 2 | $13,667 | 7 | 5.00/5.0 |
| Tonia | 1 | $12,977 | 26 | 4.88/5.0 |
| Filippo | 2 | $11,822 | 51 | 4.91/5.0 |
| Alessio | 2 | $11,018 | 5 | 5.00/5.0 |
| Isaia | 1 | $11,010 | 32 | 4.88/5.0 |
| Carlo | 4 | $10,942 | 20 | 4.35/5.0 |
Analyzing the strategies of top hosts, such as their property selection, pricing, and guest communication, can offer valuable lessons for optimizing your own Airbnb operations in Leverano.
Dive Deeper: Advanced Leverano STR Market Data (2026)
Ready to unlock more insights? AirROI provides access to advanced metrics and comprehensive Airbnb data for Leverano. Explore detailed analytics beyond this report to refine your investment strategy, optimize pricing, and maximize your vacation rental profits.
Explore Advanced MetricsLeverano Short-Term Rental Market Composition (2026): Property & Room Types
Room Type Distribution
Property Type Distribution
Market Composition Insights for Leverano
- The Leverano Airbnb market composition is heavily skewed towards Entire Home/Apt listings, which make up 76.4% of the 55 active rentals. This indicates strong guest preference for privacy and space.
- Looking at the property type distribution in Leverano, House properties are the most common (45.5%), reflecting the local real estate landscape.
- Houses represent a significant 45.5% portion, catering likely to families or larger groups.
- The presence of 18.2% Hotel/Boutique listings indicates integration with traditional hospitality.
- Smaller segments like others (combined 1.8%) offer potential for unique stay experiences.
Leverano Airbnb Room Capacity Analysis (2026): Bedroom Distribution
Distribution of Listings by Number of Bedrooms
Room Capacity Insights for Leverano
- The dominant room capacity in Leverano is 1 bedroom listings, making up 54.5% of the market. This suggests a strong demand for properties suitable for couples or solo travelers.
- Together, 1 bedroom and 2 bedrooms properties represent 76.3% of the active Airbnb listings in Leverano, indicating a high concentration in these sizes.
- With over half the market (54.5%) consisting of studios or 1-bedroom units, Leverano is particularly well-suited for individuals or couples.
Leverano Vacation Rental Guest Capacity Trends (2026)
Distribution of Listings by Guest Capacity
Guest Capacity Insights for Leverano
- The most common guest capacity trend in Leverano vacation rentals is listings accommodating 4 guests (32.7%). This suggests the primary traveler segment is likely small families or groups.
- Properties designed for 4 guests and 2 guests dominate the Leverano STR market, accounting for 58.2% of listings.
- On average, properties in Leverano are equipped to host 3.3 guests.
Leverano Airbnb Booking Patterns (2026): Available vs. Booked Days
Available Days Distribution
Booked Days Distribution
Booking Pattern Insights for Leverano
- The most common availability pattern in Leverano falls within the 271-366 days range, representing 90.9% of listings. This suggests many properties have significant open periods on their calendars.
- Approximately 98.2% of listings show high availability (181+ days open annually), indicating potential for increased bookings or specific owner usage patterns.
- For booked days, the 31-90 days range is most frequent in Leverano (49.1%), reflecting common guest stay durations or potential owner blocking patterns.
- A notable 1.8% of properties secure long booking periods (181+ days booked per year), highlighting successful long-term rental strategies or significant owner usage.
Leverano Airbnb Minimum Stay Requirements Analysis
Distribution of Listings by Minimum Night Requirement
1 Night
13 listings
23.6% of total
2 Nights
5 listings
9.1% of total
3 Nights
4 listings
7.3% of total
4-6 Nights
8 listings
14.5% of total
7-29 Nights
10 listings
18.2% of total
30+ Nights
15 listings
27.3% of total
Key Insights
- The most prevalent minimum stay requirement in Leverano is 30+ Nights, adopted by 27.3% of listings. This highlights the market's preference for longer commitments.
- A significant segment (27.3%) caters to monthly stays (30+ nights) in Leverano, pointing to opportunities in the extended-stay market.
Recommendations
- Align with the market by considering a 30+ Nights minimum stay, as 27.3% of Leverano hosts use this setting.
- If feasible, allowing 1-night stays, especially midweek or during low season, could capture last-minute bookings, as only 23.6% currently do.
- Explore offering discounts for stays of 30+ nights to attract the 27.3% of the market seeking extended stays.
- Adjust minimum nights based on seasonality – potentially shorter during low season and longer during peak demand periods in Leverano.
Leverano Airbnb Cancellation Policy Trends Analysis (2026)
Super Strict 60 Days
1 listings
1.8% of total
Limited
2 listings
3.6% of total
Flexible
9 listings
16.4% of total
Moderate
28 listings
50.9% of total
Firm
6 listings
10.9% of total
Strict
9 listings
16.4% of total
Cancellation Policy Insights for Leverano
- The prevailing Airbnb cancellation policy trend in Leverano is Moderate, used by 50.9% of listings.
- There's a relatively balanced mix between guest-friendly (67.3%) and stricter (27.3%) policies, offering choices for different guest needs.
Recommendations for Hosts
- Consider adopting a Moderate policy to align with the 50.9% market standard in Leverano.
- Regularly review your cancellation policy against competitors and market demand shifts in Leverano.
Leverano STR Booking Lead Time Analysis (2026)
Average Booking Lead Time by Month
Booking Lead Time Insights for Leverano
- The overall average booking lead time for vacation rentals in Leverano is 36 days.
- Guests book furthest in advance for stays during November (average 131 days), likely coinciding with peak travel demand or local events.
- The shortest booking windows occur for stays in February (average 1 days), indicating more last-minute travel plans during this time.
- Seasonally, Fall (66 days avg.) sees the longest lead times, while Winter (4 days avg.) has the shortest, reflecting typical travel planning cycles.
Recommendations for Hosts
- Use the overall average lead time (36 days) as a baseline for your pricing and availability strategy in Leverano.
- For November stays, consider implementing length-of-stay discounts or slightly higher rates for bookings made less than 131 days out to capitalize on advance planning.
- During February, focus on last-minute booking availability and promotions, as guests book with very short notice (1 days avg.).
- Target marketing efforts for the Fall season well in advance (at least 66 days) to capture early planners.
- Monitor your own booking lead times against these Leverano averages to identify opportunities for dynamic pricing adjustments.
Popular & Essential Airbnb Amenities in Leverano (2026)
Amenity Prevalence
Amenity Insights for Leverano
- Essential amenities in Leverano that guests expect include: Air conditioning. Lacking these (this) could significantly impact bookings.
- Popular amenities like TV, Hot water, Bed linens are common but not universal. Offering these can provide a competitive edge.
Recommendations for Hosts
- Ensure your listing includes all essential amenities for Leverano: Air conditioning.
- Prioritize adding missing essentials: Air conditioning.
- Consider adding popular differentiators like TV or Hot water to increase appeal.
- Highlight unique or less common amenities you offer (e.g., hot tub, dedicated workspace, EV charger) in your listing description and photos.
- Regularly check competitor amenities in Leverano to stay competitive.
Leverano Airbnb Guest Demographics & Profile Analysis (2026)
Guest Profile Summary for Leverano
- The typical guest profile for Airbnb in Leverano consists of a mix of domestic (64%) and international guests, often arriving from nearby Rome, typically belonging to the Post-2000s (Gen Z/Alpha) group (50%), primarily speaking English or Italian.
- Domestic travelers account for 64.4% of guests.
- Key international markets include Italy (64.4%) and France (10.2%).
- Top languages spoken are English (34.2%) followed by Italian (26.3%).
- A significant demographic segment is the Post-2000s (Gen Z/Alpha) group, representing 50% of guests.
Recommendations for Hosts
- Target domestic marketing efforts towards travelers from Rome and Bologna.
- Tailor amenities and listing descriptions to appeal to the dominant Post-2000s (Gen Z/Alpha) demographic (e.g., highlight fast WiFi, smart home features, local guides).
- Highlight unique local experiences or amenities relevant to the primary guest profile.
- Consider seasonal promotions aligned with peak travel times for key origin markets.
Nearby Short-Term Rental Market Comparison
How does the Leverano Airbnb market stack up against its neighbors? Compare key performance metrics like average monthly revenue, ADR, and occupancy rates in surrounding areas to understand the broader regional STR landscape.
| Market | Active Properties | Monthly Revenue | Daily Rate | Avg. Occupancy |
|---|---|---|---|---|
| San Michele Salentino | 76 | $2,635 | $296.04 | 46% |
| Sanarica | 14 | $2,311 | $227.51 | 35% |
| Castellana Grotte | 194 | $2,129 | $242.07 | 42% |
| Carovigno | 442 | $2,005 | $283.77 | 41% |
| Polignano a Mare | 718 | $1,915 | $201.20 | 43% |
| San Vito dei Normanni | 168 | $1,885 | $272.31 | 42% |
| Muro Leccese | 29 | $1,863 | $336.37 | 35% |
| Ostuni | 1,596 | $1,855 | $262.11 | 37% |
| Lequile | 22 | $1,790 | $177.86 | 45% |
| Monopoli | 1,240 | $1,734 | $200.27 | 42% |