Bonifati Airbnb Market Analysis 2025: Short Term Rental Data & Vacation Rental Statistics in Calabria, Italy
Is Airbnb profitable in Bonifati in 2025? Explore comprehensive Airbnb analytics for Bonifati, Calabria, Italy to uncover income potential. This 2025 STR market report for Bonifati, based on AirROI data from September 2024 to August 2025, reveals key trends in the niche market of 18 active listings.
Whether you're considering an Airbnb investment in Bonifati, optimizing your existing vacation rental, or exploring rental arbitrage opportunities, understanding the Bonifati Airbnb data is crucial. Leveraging the low regulation environment is key to maximizing your short term rental income potential. Let's dive into the specifics.
Key Bonifati Airbnb Performance Metrics Overview
Monthly Airbnb Revenue Variations & Income Potential in Bonifati (2025)
Understanding the monthly revenue variations for Airbnb listings in Bonifati is key to maximizing your short term rental income potential. Seasonality significantly impacts earnings. Our analysis, based on data from the past 12 months, shows that the peak revenue month for STRs in Bonifati is typically August, while May often presents the lowest earnings, highlighting opportunities for strategic pricing adjustments during shoulder and low seasons. Explore the typical Airbnb income in Bonifati across different performance tiers:
- Best-in-class properties (Top 10%) achieve $3,195+ monthly, often utilizing dynamic pricing and superior guest experiences.
- Strong performing properties (Top 25%) earn $2,416 or more, indicating effective management and desirable locations/amenities.
- Typical properties (Median) generate around $887 per month, representing the average market performance.
- Entry-level properties (Bottom 25%) see earnings around $438, often with potential for optimization.
Average Monthly Airbnb Earnings Trend in Bonifati
Bonifati Airbnb Occupancy Rate Trends (2025)
Maximize your bookings by understanding the Bonifati STR occupancy trends. Seasonal demand shifts significantly influence how often properties are booked. Typically, Augustsees the highest demand (peak season occupancy), while May experiences the lowest (low season). Effective strategies, like adjusting minimum stays or offering promotions, can boost occupancy during slower periods. Here's how different property tiers perform in Bonifati:
- Best-in-class properties (Top 10%) achieve 46%+ occupancy, indicating high desirability and potentially optimized availability.
- Strong performing properties (Top 25%) maintain 33% or higher occupancy, suggesting good market fit and guest satisfaction.
- Typical properties (Median) have an occupancy rate around 16%.
- Entry-level properties (Bottom 25%) average 12% occupancy, potentially facing higher vacancy.
Average Monthly Occupancy Rate Trend in Bonifati
Average Daily Rate (ADR) Airbnb Trends in Bonifati (2025)
Effective short term rental pricing strategy in Bonifati involves understanding monthly ADR fluctuations. The Average Daily Rate (ADR) for Airbnb in Bonifati typically peaks in August and dips lowest during February. Leveraging Airbnb dynamic pricing tools or strategies based on this seasonality can significantly boost revenue. Here's a look at the typical nightly rates achieved:
- Best-in-class properties (Top 10%) command rates of $331+ per night, often due to premium features or locations.
- Strong performing properties (Top 25%) achieve nightly rates of $197 or more.
- Typical properties (Median) charge around $106 per night.
- Entry-level properties (Bottom 25%) earn around $80 per night.
Average Daily Rate (ADR) Trend by Month in Bonifati
Get Live Bonifati Market Intelligence 👇

Explore Real-time Analytics
Airbnb Seasonality Analysis & Trends in Bonifati (2025)
Peak Season (August, July, November)
- Revenue averages $2,925 per month
- Occupancy rates average 36.5%
- Daily rates average $176
Shoulder Season
- Revenue averages $1,099 per month
- Occupancy maintains around 23.1%
- Daily rates hold near $153
Low Season (January, May, June)
- Revenue drops to average $532 per month
- Occupancy decreases to average 10.5%
- Daily rates adjust to average $166
Seasonality Insights for Bonifati
- The Airbnb seasonality in Bonifati shows highly seasonal trends requiring careful strategy. While the sections above show seasonal averages, it's also insightful to look at the extremes:
- During the high season, the absolute peak month showcases Bonifati's highest earning potential, with monthly revenues capable of climbing to $4,475, occupancy reaching a high of 51.0%, and ADRs peaking at $190.
- Conversely, the slowest single month of the year, typically falling within the low season, marks the market's lowest point. In this month, revenue might dip to $334, occupancy could drop to 6.4%, and ADRs may adjust down to $147.
- Understanding both the seasonal averages and these monthly peaks and troughs in revenue, occupancy, and ADR is crucial for maximizing your Airbnb profit potential in Bonifati.
Seasonal Strategies for Maximizing Profit
- Peak Season: Maximize revenue through premium pricing and potentially longer minimum stays. Ensure high availability.
- Low Season: Offer competitive pricing, special promotions (e.g., extended stay discounts), and flexible cancellation policies. Target off-season travelers like remote workers or budget-conscious guests.
- Shoulder Seasons: Implement dynamic pricing that balances peak and low rates. Target weekend travelers or specific events. Offer slightly more flexible terms than peak season.
- Regularly analyze your own performance against these Bonifati seasonality benchmarks and adjust your pricing and availability strategy accordingly.
Best Areas for Airbnb Investment in Bonifati (2025)
Exploring the top neighborhoods for short-term rentals in Bonifati? This section highlights key areas, outlining why they are attractive for hosts and guests, along with notable local attractions. Consider these locations based on your target guest profile and investment strategy.
| Neighborhood / Area | Why Host Here? (Target Guests & Appeal) | Key Attractions & Landmarks |
|---|---|---|
| Bonifati Beach | A beautiful stretch of coastline with stunning views and crystal-clear waters. Popular with tourists looking for a relaxing beach getaway, it offers easy access to amenities and local restaurants. | Spiaggia di Bonifati, Chiesa di San Lazzaro, Scogliera di Bonifati, Ristorante Da Franco, Gelateria Pizzeria Santa Maria |
| Scilla | Charming coastal village known for its picturesque views and rich history. It attracts tourists interested in culture, history, and beautiful beaches. | Château de Scilla, Spiaggia di Scilla, Torre di Ruffo, Museo Nazionale della Magna Grecia, Promenade Medicea |
| Diamante | Famous for its murals and vibrant nightlife, Diamante is a lively town that attracts a younger crowd looking for both culture and fun. | Murales di Diamante, Spiaggia di Diamante, Centro Storico di Diamante, Ristoranti tipici, Festival del Peperoncino |
| Tortora | Rich in historical sites and beautiful beaches, Tortora is a perfect destination for families and history enthusiasts. | Torre di Rienzo, Cattedrale di San Bartolomeo, Spiaggia di Tortora, Parco Archeologico di Tortora, Sentiero del Peperoncino |
| Praia a Mare | A stunning coastal town known for its beautiful beaches and vibrant summer activities. It appeals to families and beach lovers alike. | Isola di Dino, Spiaggia di Praia a Mare, Basilica di Santa Maria della Grotta, Parco Nazionale del Pollino, Viale della Libertà |
| Cirella | A quiet town with stunning sea views and nearby archaeological sites, great for those looking for tranquility near the beach. | Ruderi di Cirella, Spiagge di Cirella, Parco Archeologico, Torre dei Rava, Local markets |
| Fuscaldo | Nestled between mountains and the sea, Fuscaldo offers both beach access and hiking opportunities, appealing to nature lovers. | Spiaggia di Fuscaldo, Monte Cocuzzo, Castello di Fuscaldo, Ristoranti con cucina tipica, Borgo antico di Fuscaldo |
| Lake Averno | A serene lake area perfect for those who enjoy nature walks and scenic views. A hidden gem that offers a unique experience away from the beach. | Lago di Averno, Riserva Naturale Litorale di Bonifati, Sentieri naturalistici, Ristoranti di pesce, Area pic-nic |
Understanding Airbnb License Requirements & STR Laws in Bonifati (2025)
While Bonifati, Calabria, Italy currently shows low STR regulations, specific Airbnb license requirements might still exist or change. Always verify the latest short term rental regulations and Airbnb license requirements directly with local government authorities for Bonifati to ensure full compliance before hosting.
(Source: AirROI data, 2025, finding no licensed listings among those analyzed)
Top Performing Airbnb Properties in Bonifati (2025)
Benchmark your potential! Explore examples of top-performing Airbnb properties in Bonifatibased on Trailing Twelve Month (TTM) revenue. Analyze their characteristics, revenue, occupancy rate, and ADR to understand what drives success in this market.

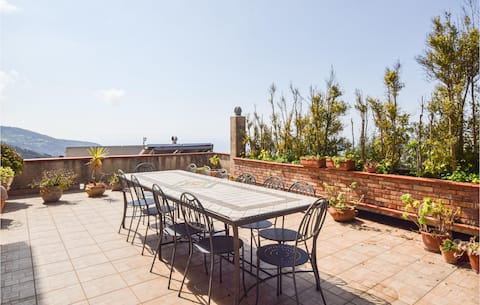
Villa in front of the sea with private garden
Entire Place • 3 bedrooms
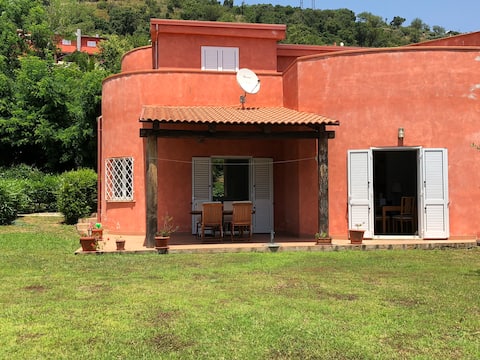
Beautiful apartment in Bonifati
Entire Place • 3 bedrooms

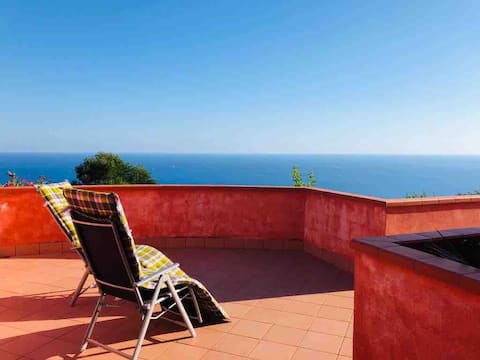
Luxury Beach Front Villa, Private Garden, Sea View
Entire Place • 3 bedrooms
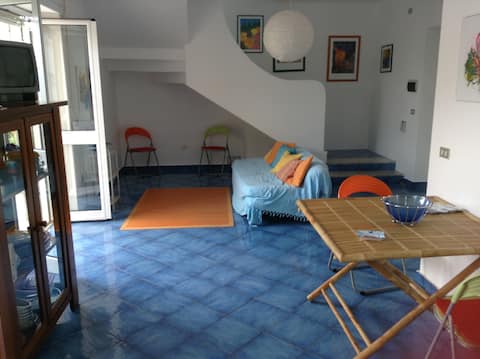
Spacious villa, stunning views & infinity pool
Entire Place • 3 bedrooms
Villa Cherry Luxury Residence with Large Swimming Pool
Entire Place • 3 bedrooms
Beautiful oceanfront villa
Entire Place • 3 bedrooms
Note: Performance varies based on location, size, amenities, seasonality, and management quality. Data reflects the past 12 months.
Top Performing Airbnb Hosts in Bonifati (2025)
Learn from the best! This table showcases top-performing Airbnb hosts in Bonifati based on the number of properties managed and estimated total revenue over the past year. Analyze their scale and performance metrics.
| Host Name | Properties | Grossing Revenue | Stay Reviews | Avg Rating |
|---|---|---|---|---|
| Valerio | 1 | $31,001 | 27 | 4.96/5.0 |
| Novasol | 1 | $19,218 | 1 | Not Rated |
| Walter | 6 | $17,899 | 26 | 5.00/5.0 |
| Nick | 1 | $6,797 | 20 | 5.00/5.0 |
| Annalisa | 2 | $4,983 | 7 | 5.00/5.0 |
| Villa Sul Mare | 1 | $4,228 | 1 | Not Rated |
| Nicola | 1 | $3,406 | 7 | 4.86/5.0 |
| Tina | 1 | $1,659 | 9 | 4.33/5.0 |
| Marco | 1 | $1,536 | 2 | Not Rated |
| Giulia | 1 | $1,003 | 2 | Not Rated |
Analyzing the strategies of top hosts, such as their property selection, pricing, and guest communication, can offer valuable lessons for optimizing your own Airbnb operations in Bonifati.
Dive Deeper: Advanced Bonifati STR Market Data (2025)
Ready to unlock more insights? AirROI provides access to advanced metrics and comprehensive Airbnb data for Bonifati. Explore detailed analytics beyond this report to refine your investment strategy, optimize pricing, and maximize your vacation rental profits.
Explore Advanced MetricsBonifati Short-Term Rental Market Composition (2025): Property & Room Types
Room Type Distribution
Property Type Distribution
Market Composition Insights for Bonifati
- The Bonifati Airbnb market composition is heavily skewed towards Entire Home/Apt listings, which make up 83.3% of the 18 active rentals. This indicates strong guest preference for privacy and space.
- Looking at the property type distribution in Bonifati, House properties are the most common (66.7%), reflecting the local real estate landscape.
- Houses represent a significant 66.7% portion, catering likely to families or larger groups.
- The presence of 16.7% Hotel/Boutique listings indicates integration with traditional hospitality.
Bonifati Airbnb Room Capacity Analysis (2025): Bedroom Distribution
Distribution of Listings by Number of Bedrooms
Room Capacity Insights for Bonifati
- The dominant room capacity in Bonifati is 3 bedrooms listings, making up 44.4% of the market. This suggests a strong demand for properties suitable for families or small groups.
- Together, 3 bedrooms and 2 bedrooms properties represent 77.7% of the active Airbnb listings in Bonifati, indicating a high concentration in these sizes.
- A significant 50.0% of listings offer 3+ bedrooms, catering to larger groups and families seeking more space in Bonifati.
Bonifati Vacation Rental Guest Capacity Trends (2025)
Distribution of Listings by Guest Capacity
Guest Capacity Insights for Bonifati
- The most common guest capacity trend in Bonifati vacation rentals is listings accommodating 6 guests (33.3%). This suggests the primary traveler segment is likely larger groups.
- Properties designed for 6 guests and 4 guests dominate the Bonifati STR market, accounting for 55.5% of listings.
- 55.6% of properties accommodate 6+ guests, serving the market segment for larger families or group travel in Bonifati.
- On average, properties in Bonifati are equipped to host 5.0 guests.
Bonifati Airbnb Booking Patterns (2025): Available vs. Booked Days
Available Days Distribution
Booked Days Distribution
Booking Pattern Insights for Bonifati
- The most common availability pattern in Bonifati falls within the 271-366 days range, representing 94.4% of listings. This suggests many properties have significant open periods on their calendars.
- Approximately 100.0% of listings show high availability (181+ days open annually), indicating potential for increased bookings or specific owner usage patterns.
- For booked days, the 1-30 days range is most frequent in Bonifati (72.2%), reflecting common guest stay durations or potential owner blocking patterns.
Bonifati Airbnb Minimum Stay Requirements Analysis
Distribution of Listings by Minimum Night Requirement
1 Night
3 listings
16.7% of total
3 Nights
4 listings
22.2% of total
4-6 Nights
3 listings
16.7% of total
7-29 Nights
2 listings
11.1% of total
30+ Nights
6 listings
33.3% of total
Key Insights
- The most prevalent minimum stay requirement in Bonifati is 30+ Nights, adopted by 33.3% of listings. This highlights the market's preference for longer commitments.
- Very short stays (1-2 nights) are less common (16.7%), suggesting hosts prefer slightly longer bookings to optimize turnover.
- A significant segment (33.3%) caters to monthly stays (30+ nights) in Bonifati, pointing to opportunities in the extended-stay market.
Recommendations
- Align with the market by considering a 30+ Nights minimum stay, as 33.3% of Bonifati hosts use this setting.
- If feasible, allowing 1-night stays, especially midweek or during low season, could capture last-minute bookings, as only 16.7% currently do.
- Explore offering discounts for stays of 30+ nights to attract the 33.3% of the market seeking extended stays.
- Adjust minimum nights based on seasonality – potentially shorter during low season and longer during peak demand periods in Bonifati.
Bonifati Airbnb Cancellation Policy Trends Analysis (2025)
Super Strict 60 Days
1 listings
5.6% of total
Flexible
2 listings
11.1% of total
Moderate
8 listings
44.4% of total
Strict
7 listings
38.9% of total
Cancellation Policy Insights for Bonifati
- The prevailing Airbnb cancellation policy trend in Bonifati is Moderate, used by 44.4% of listings.
- There's a relatively balanced mix between guest-friendly (55.5%) and stricter (38.9%) policies, offering choices for different guest needs.
Recommendations for Hosts
- Consider adopting a Moderate policy to align with the 44.4% market standard in Bonifati.
- With 38.9% using Strict terms, this is a viable option in Bonifati, particularly for high-value properties or during peak demand periods.
- Regularly review your cancellation policy against competitors and market demand shifts in Bonifati.
Bonifati STR Booking Lead Time Analysis (2025)
Average Booking Lead Time by Month
Booking Lead Time Insights for Bonifati
- The overall average booking lead time for vacation rentals in Bonifati is 58 days.
- Guests book furthest in advance for stays during August (average 146 days), likely coinciding with peak travel demand or local events.
- The shortest booking windows occur for stays in March (average 1 days), indicating more last-minute travel plans during this time.
- Seasonally, Summer (94 days avg.) sees the longest lead times, while Winter (5 days avg.) has the shortest, reflecting typical travel planning cycles.
Recommendations for Hosts
- Use the overall average lead time (58 days) as a baseline for your pricing and availability strategy in Bonifati.
- For August stays, consider implementing length-of-stay discounts or slightly higher rates for bookings made less than 146 days out to capitalize on advance planning.
- During March, focus on last-minute booking availability and promotions, as guests book with very short notice (1 days avg.).
- Target marketing efforts for the Summer season well in advance (at least 94 days) to capture early planners.
- Monitor your own booking lead times against these Bonifati averages to identify opportunities for dynamic pricing adjustments.
Popular & Essential Airbnb Amenities in Bonifati (2025)
Amenity Prevalence
Amenity Insights for Bonifati
- Essential amenities in Bonifati that guests expect include: Washer. Lacking these (this) could significantly impact bookings.
- Popular amenities like TV, Free parking on premises, Hair dryer are common but not universal. Offering these can provide a competitive edge.
- Warning: Wifi is not universally provided but is considered essential globally. Ensure reliable Wifi is offered.
Recommendations for Hosts
- Ensure your listing includes all essential amenities for Bonifati: Washer.
- Consider adding popular differentiators like TV or Free parking on premises to increase appeal.
- Highlight unique or less common amenities you offer (e.g., hot tub, dedicated workspace, EV charger) in your listing description and photos.
- Regularly check competitor amenities in Bonifati to stay competitive.
Bonifati Airbnb Guest Demographics & Profile Analysis (2025)
Guest Profile Summary for Bonifati
- The typical guest profile for Airbnb in Bonifati consists of predominantly international visitors (92%), with top international origins including United States, typically belonging to the Post-2000s (Gen Z/Alpha) group (50%), primarily speaking English or French.
- Domestic travelers account for 7.7% of guests.
- Key international markets include Canada (30.8%) and United States (23.1%).
- Top languages spoken are English (50%) followed by French (21.4%).
- A significant demographic segment is the Post-2000s (Gen Z/Alpha) group, representing 50% of guests.
Recommendations for Hosts
- Focus marketing internationally, particularly towards travelers from United States.
- Tailor amenities and listing descriptions to appeal to the dominant Post-2000s (Gen Z/Alpha) demographic (e.g., highlight fast WiFi, smart home features, local guides).
- Highlight unique local experiences or amenities relevant to the primary guest profile.
- Consider seasonal promotions aligned with peak travel times for key origin markets.
Nearby Short-Term Rental Market Comparison
How does the Bonifati Airbnb market stack up against its neighbors? Compare key performance metrics like average monthly revenue, ADR, and occupancy rates in surrounding areas to understand the broader regional STR landscape.
| Market | Active Properties | Monthly Revenue | Daily Rate | Avg. Occupancy |
|---|---|---|---|---|
| Positano | 730 | $6,505 | $634.57 | 50% |
| Praiano | 352 | $4,280 | $444.98 | 50% |
| Conca dei Marini | 127 | $3,694 | $394.01 | 46% |
| Sorrento | 1,565 | $3,600 | $338.63 | 48% |
| Capri | 420 | $3,597 | $577.11 | 36% |
| Massa Lubrense | 821 | $3,198 | $397.88 | 41% |
| Amalfi | 488 | $3,009 | $308.39 | 44% |
| Furore | 156 | $2,800 | $324.75 | 50% |
| Ravello | 272 | $2,798 | $322.35 | 42% |
| Atrani | 124 | $2,686 | $225.86 | 50% |