Cariati Airbnb Market Analysis 2025: Short Term Rental Data & Vacation Rental Statistics in Cosenza, Italy
Is Airbnb profitable in Cariati in 2025? Explore comprehensive Airbnb analytics for Cariati, Cosenza, Italy to uncover income potential. This 2025 STR market report for Cariati, based on AirROI data from September 2024 to August 2025, reveals key trends in the niche market of 18 active listings.
Whether you're considering an Airbnb investment in Cariati, optimizing your existing vacation rental, or exploring rental arbitrage opportunities, understanding the Cariati Airbnb data is crucial. Leveraging the low regulation environment is key to maximizing your short term rental income potential. Let's dive into the specifics.
Key Cariati Airbnb Performance Metrics Overview
Monthly Airbnb Revenue Variations & Income Potential in Cariati (2025)
Understanding the monthly revenue variations for Airbnb listings in Cariati is key to maximizing your short term rental income potential. Seasonality significantly impacts earnings. Our analysis, based on data from the past 12 months, shows that the peak revenue month for STRs in Cariati is typically July, while May often presents the lowest earnings, highlighting opportunities for strategic pricing adjustments during shoulder and low seasons. Explore the typical Airbnb income in Cariati across different performance tiers:
- Best-in-class properties (Top 10%) achieve $1,711+ monthly, often utilizing dynamic pricing and superior guest experiences.
- Strong performing properties (Top 25%) earn $786 or more, indicating effective management and desirable locations/amenities.
- Typical properties (Median) generate around $381 per month, representing the average market performance.
- Entry-level properties (Bottom 25%) see earnings around $208, often with potential for optimization.
Average Monthly Airbnb Earnings Trend in Cariati
Cariati Airbnb Occupancy Rate Trends (2025)
Maximize your bookings by understanding the Cariati STR occupancy trends. Seasonal demand shifts significantly influence how often properties are booked. Typically, Marchsees the highest demand (peak season occupancy), while May experiences the lowest (low season). Effective strategies, like adjusting minimum stays or offering promotions, can boost occupancy during slower periods. Here's how different property tiers perform in Cariati:
- Best-in-class properties (Top 10%) achieve 39%+ occupancy, indicating high desirability and potentially optimized availability.
- Strong performing properties (Top 25%) maintain 32% or higher occupancy, suggesting good market fit and guest satisfaction.
- Typical properties (Median) have an occupancy rate around 21%.
- Entry-level properties (Bottom 25%) average 13% occupancy, potentially facing higher vacancy.
Average Monthly Occupancy Rate Trend in Cariati
Average Daily Rate (ADR) Airbnb Trends in Cariati (2025)
Effective short term rental pricing strategy in Cariati involves understanding monthly ADR fluctuations. The Average Daily Rate (ADR) for Airbnb in Cariati typically peaks in August and dips lowest during February. Leveraging Airbnb dynamic pricing tools or strategies based on this seasonality can significantly boost revenue. Here's a look at the typical nightly rates achieved:
- Best-in-class properties (Top 10%) command rates of $132+ per night, often due to premium features or locations.
- Strong performing properties (Top 25%) achieve nightly rates of $99 or more.
- Typical properties (Median) charge around $70 per night.
- Entry-level properties (Bottom 25%) earn around $53 per night.
Average Daily Rate (ADR) Trend by Month in Cariati
Get Live Cariati Market Intelligence 👇

Explore Real-time Analytics
Airbnb Seasonality Analysis & Trends in Cariati (2025)
Peak Season (July, October, August)
- Revenue averages $1,184 per month
- Occupancy rates average 29.8%
- Daily rates average $86
Shoulder Season
- Revenue averages $504 per month
- Occupancy maintains around 25.5%
- Daily rates hold near $76
Low Season (January, May, June)
- Revenue drops to average $214 per month
- Occupancy decreases to average 12.5%
- Daily rates adjust to average $84
Seasonality Insights for Cariati
- The Airbnb seasonality in Cariati shows highly seasonal trends requiring careful strategy. While the sections above show seasonal averages, it's also insightful to look at the extremes:
- During the high season, the absolute peak month showcases Cariati's highest earning potential, with monthly revenues capable of climbing to $1,319, occupancy reaching a high of 44.1%, and ADRs peaking at $93.
- Conversely, the slowest single month of the year, typically falling within the low season, marks the market's lowest point. In this month, revenue might dip to $95, occupancy could drop to 4.9%, and ADRs may adjust down to $74.
- Understanding both the seasonal averages and these monthly peaks and troughs in revenue, occupancy, and ADR is crucial for maximizing your Airbnb profit potential in Cariati.
Seasonal Strategies for Maximizing Profit
- Peak Season: Maximize revenue through premium pricing and potentially longer minimum stays. Ensure high availability.
- Low Season: Offer competitive pricing, special promotions (e.g., extended stay discounts), and flexible cancellation policies. Target off-season travelers like remote workers or budget-conscious guests.
- Shoulder Seasons: Implement dynamic pricing that balances peak and low rates. Target weekend travelers or specific events. Offer slightly more flexible terms than peak season.
- Regularly analyze your own performance against these Cariati seasonality benchmarks and adjust your pricing and availability strategy accordingly.
Best Areas for Airbnb Investment in Cariati (2025)
Exploring the top neighborhoods for short-term rentals in Cariati? This section highlights key areas, outlining why they are attractive for hosts and guests, along with notable local attractions. Consider these locations based on your target guest profile and investment strategy.
| Neighborhood / Area | Why Host Here? (Target Guests & Appeal) | Key Attractions & Landmarks |
|---|---|---|
| Old Town Cariati | Charming historical center with narrow streets, traditional architecture, and a strong local atmosphere. Ideal for tourists wanting to experience authentic Italian culture and cuisine. | Castle of Cariati, Church of San Domenico, Palazzo de Marco, Piazza Matteotti, Museum of Cariati |
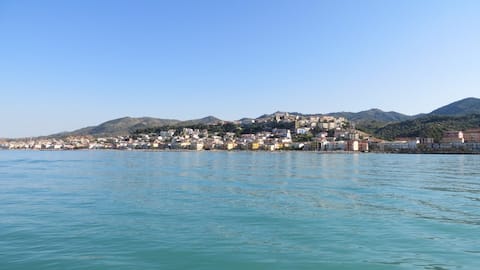
| Spiaggia di Cariati | Stunning beach area that attracts visitors during the summer months. Great for those looking to enjoy sun, sand, and water activities. | Lunch bars and beach clubs, Local shops, Water sports, Scenic beach walks, Sunbathing spots |
| Cariati Marina | Vibrant marina area popular with boaters and tourists, offering restaurants and cafes with sea views. Good for travelers seeking waterfront experiences. | Marina di Cariati, Restaurants with fresh seafood, Boat rentals, Fishing opportunities, Scenic promenades |
| Parco della Sila | Proximity to the Sila National Park provides nature lovers with an escape into stunning landscapes, nature trails, and outdoor activities. | Hiking trails, Wildlife observing, Picnic areas, Mountain views, Cultural experiences in nearby towns |
| Castello di Cariati | The historic castle area offers panoramic views and a rich history. It’s ideal for cultural tourism and photography. | Castle ruins, Viewpoint overlooking the coast, Historical significance, Local art galleries, Cafes nearby |
| Corso Garibaldi | Main street in Cariati filled with shops, cafes, and local life. A great choice for those who want to be in the heart of town where everything happens. | Local shops, Cafes and restaurants, Weekly markets, Local events and festivals, Town square activities |
| Via Roma | A welcoming residential area with a local flavor and access to amenities. Perfect for tourists wanting an authentic experience away from tourist traps. | Local eateries, Family-run shops, Community events, Access to public transport, Scenic residential streets |
| Cultural Festivals | Cariati hosts various cultural festivals that attract visitors throughout the year, making areas around these festivals prime for hosting. | Sagra della Nduja, Festa di San Domenico, Cultural events, Food festivals, Local music performances |
Understanding Airbnb License Requirements & STR Laws in Cariati (2025)
While Cariati, Cosenza, Italy currently shows low STR regulations, specific Airbnb license requirements might still exist or change. Always verify the latest short term rental regulations and Airbnb license requirements directly with local government authorities for Cariati to ensure full compliance before hosting.
(Source: AirROI data, 2025, based on 6% licensed listings)
Top Performing Airbnb Properties in Cariati (2025)
Benchmark your potential! Explore examples of top-performing Airbnb properties in Cariatibased on Trailing Twelve Month (TTM) revenue. Analyze their characteristics, revenue, occupancy rate, and ADR to understand what drives success in this market.

Breathtaking sea views 300 meters from the beach
Entire Place • 2 bedrooms
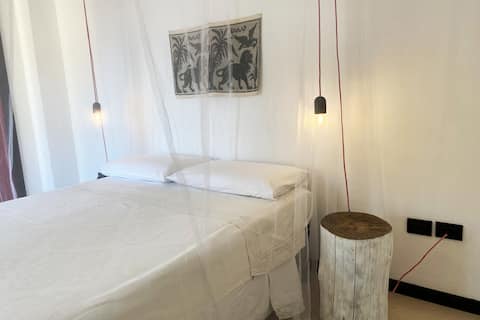
A 2-minute walk to the beach
Entire Place • 2 bedrooms
Single-family townhouse
Entire Place • 1 bedroom

Casa Vacanze Da Fra
Entire Place • 1 bedroom
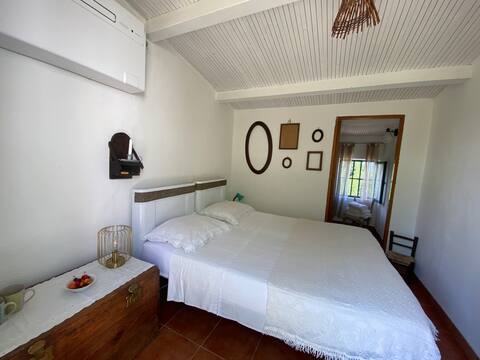
Immersed in nature with a sea view
Private Room • 1 bedroom
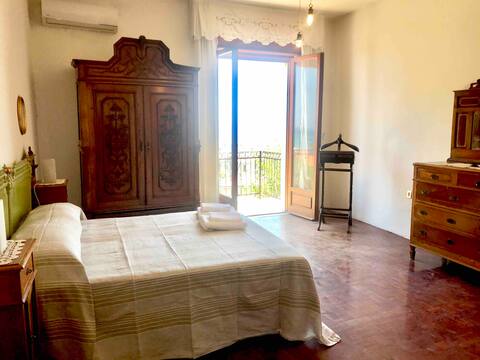
Room in city center with Sea View 5 minutes from the beach
Private Room • N/A
Note: Performance varies based on location, size, amenities, seasonality, and management quality. Data reflects the past 12 months.
Top Performing Airbnb Hosts in Cariati (2025)
Learn from the best! This table showcases top-performing Airbnb hosts in Cariati based on the number of properties managed and estimated total revenue over the past year. Analyze their scale and performance metrics.
| Host Name | Properties | Grossing Revenue | Stay Reviews | Avg Rating |
|---|---|---|---|---|
| Antonella | 5 | $28,818 | 23 | 4.72/5.0 |
| Antonio | 1 | $3,528 | 2 | Not Rated |
| Francesca | 1 | $3,187 | 14 | 4.57/5.0 |
| Giuseppe | 1 | $1,692 | 3 | 4.33/5.0 |
| Giuseppe | 2 | $943 | 7 | 4.58/5.0 |
| Host #299163825 | 1 | $940 | 1 | Not Rated |
| Milena | 1 | $677 | 2 | Not Rated |
| Francesco | 1 | $656 | 6 | 4.00/5.0 |
| Anna | 1 | $521 | 4 | 4.75/5.0 |
| Nicola | 1 | $441 | 2 | Not Rated |
Analyzing the strategies of top hosts, such as their property selection, pricing, and guest communication, can offer valuable lessons for optimizing your own Airbnb operations in Cariati.
Dive Deeper: Advanced Cariati STR Market Data (2025)
Ready to unlock more insights? AirROI provides access to advanced metrics and comprehensive Airbnb data for Cariati. Explore detailed analytics beyond this report to refine your investment strategy, optimize pricing, and maximize your vacation rental profits.
Explore Advanced MetricsCariati Short-Term Rental Market Composition (2025): Property & Room Types
Room Type Distribution
Property Type Distribution
Market Composition Insights for Cariati
- The Cariati Airbnb market composition is heavily skewed towards Entire Home/Apt listings, which make up 72.2% of the 18 active rentals. This indicates strong guest preference for privacy and space.
- Looking at the property type distribution in Cariati, House properties are the most common (55.6%), reflecting the local real estate landscape.
- Houses represent a significant 55.6% portion, catering likely to families or larger groups.
Cariati Airbnb Room Capacity Analysis (2025): Bedroom Distribution
Distribution of Listings by Number of Bedrooms
Room Capacity Insights for Cariati
- The dominant room capacity in Cariati is 2 bedrooms listings, making up 33.3% of the market. This suggests a strong demand for properties suitable for couples or solo travelers.
- Together, 2 bedrooms and 1 bedroom properties represent 55.5% of the active Airbnb listings in Cariati, indicating a high concentration in these sizes.
Cariati Vacation Rental Guest Capacity Trends (2025)
Distribution of Listings by Guest Capacity
Guest Capacity Insights for Cariati
- The most common guest capacity trend in Cariati vacation rentals is listings accommodating 4 guests (33.3%). This suggests the primary traveler segment is likely small families or groups.
- Properties designed for 4 guests and 8+ guests dominate the Cariati STR market, accounting for 50.0% of listings.
- 22.3% of properties accommodate 6+ guests, serving the market segment for larger families or group travel in Cariati.
- On average, properties in Cariati are equipped to host 3.7 guests.
Cariati Airbnb Booking Patterns (2025): Available vs. Booked Days
Available Days Distribution
Booked Days Distribution
Booking Pattern Insights for Cariati
- The most common availability pattern in Cariati falls within the 271-366 days range, representing 100% of listings. This suggests many properties have significant open periods on their calendars.
- Approximately 100.0% of listings show high availability (181+ days open annually), indicating potential for increased bookings or specific owner usage patterns.
- For booked days, the 1-30 days range is most frequent in Cariati (72.2%), reflecting common guest stay durations or potential owner blocking patterns.
Cariati Airbnb Minimum Stay Requirements Analysis
Distribution of Listings by Minimum Night Requirement
1 Night
1 listings
5.6% of total
2 Nights
4 listings
22.2% of total
3 Nights
1 listings
5.6% of total
4-6 Nights
1 listings
5.6% of total
7-29 Nights
7 listings
38.9% of total
30+ Nights
4 listings
22.2% of total
Key Insights
- The most prevalent minimum stay requirement in Cariati is 7-29 Nights, adopted by 38.9% of listings. This highlights the market's preference for shorter, flexible bookings.
- A significant segment (22.2%) caters to monthly stays (30+ nights) in Cariati, pointing to opportunities in the extended-stay market.
Recommendations
- Align with the market by considering a 7-29 Nights minimum stay, as 38.9% of Cariati hosts use this setting.
- If feasible, allowing 1-night stays, especially midweek or during low season, could capture last-minute bookings, as only 5.6% currently do.
- Explore offering discounts for stays of 30+ nights to attract the 22.2% of the market seeking extended stays.
- Adjust minimum nights based on seasonality – potentially shorter during low season and longer during peak demand periods in Cariati.
Cariati Airbnb Cancellation Policy Trends Analysis (2025)
Flexible
5 listings
27.8% of total
Moderate
3 listings
16.7% of total
Strict
10 listings
55.6% of total
Cancellation Policy Insights for Cariati
- The prevailing Airbnb cancellation policy trend in Cariati is Strict, used by 55.6% of listings.
- A majority (55.6%) of hosts in Cariati utilize Firm or Strict policies, indicating a market where hosts prioritize booking security.
Recommendations for Hosts
- Consider adopting a Strict policy to align with the 55.6% market standard in Cariati.
- With 55.6% using Strict terms, this is a viable option in Cariati, particularly for high-value properties or during peak demand periods.
- Regularly review your cancellation policy against competitors and market demand shifts in Cariati.
Cariati STR Booking Lead Time Analysis (2025)
Average Booking Lead Time by Month
Booking Lead Time Insights for Cariati
- The overall average booking lead time for vacation rentals in Cariati is 53 days.
- Guests book furthest in advance for stays during August (average 130 days), likely coinciding with peak travel demand or local events.
- The shortest booking windows occur for stays in February (average 1 days), indicating more last-minute travel plans during this time.
- Seasonally, Summer (60 days avg.) sees the longest lead times, while Winter (2 days avg.) has the shortest, reflecting typical travel planning cycles.
Recommendations for Hosts
- Use the overall average lead time (53 days) as a baseline for your pricing and availability strategy in Cariati.
- For August stays, consider implementing length-of-stay discounts or slightly higher rates for bookings made less than 130 days out to capitalize on advance planning.
- During February, focus on last-minute booking availability and promotions, as guests book with very short notice (1 days avg.).
- Target marketing efforts for the Summer season well in advance (at least 60 days) to capture early planners.
- Monitor your own booking lead times against these Cariati averages to identify opportunities for dynamic pricing adjustments.
Popular & Essential Airbnb Amenities in Cariati (2025)
Amenity Prevalence
Amenity Insights for Cariati
- Popular amenities like Kitchen, Essentials, Washer are common but not universal. Offering these can provide a competitive edge.
- Warning: Wifi is not universally provided but is considered essential globally. Ensure reliable Wifi is offered.
Recommendations for Hosts
- Consider adding popular differentiators like Kitchen or Essentials to increase appeal.
- Highlight unique or less common amenities you offer (e.g., hot tub, dedicated workspace, EV charger) in your listing description and photos.
- Regularly check competitor amenities in Cariati to stay competitive.
Cariati Airbnb Guest Demographics & Profile Analysis (2025)
Guest Profile Summary for Cariati
- The typical guest profile for Airbnb in Cariati consists of predominantly international visitors (86%), with top international origins including Spain, typically belonging to the Post-2000s (Gen Z/Alpha) group (50%), primarily speaking English or German.
- Domestic travelers account for 14.3% of guests.
- Key international markets include Germany (28.6%) and Spain (14.3%).
- Top languages spoken are English (40%) followed by German (20%).
- A significant demographic segment is the Post-2000s (Gen Z/Alpha) group, representing 50% of guests.
Recommendations for Hosts
- Focus marketing internationally, particularly towards travelers from Spain.
- Tailor amenities and listing descriptions to appeal to the dominant Post-2000s (Gen Z/Alpha) demographic (e.g., highlight fast WiFi, smart home features, local guides).
- Highlight unique local experiences or amenities relevant to the primary guest profile.
- Consider seasonal promotions aligned with peak travel times for key origin markets.
Nearby Short-Term Rental Market Comparison
How does the Cariati Airbnb market stack up against its neighbors? Compare key performance metrics like average monthly revenue, ADR, and occupancy rates in surrounding areas to understand the broader regional STR landscape.
| Market | Active Properties | Monthly Revenue | Daily Rate | Avg. Occupancy |
|---|---|---|---|---|
| San Michele Salentino | 74 | $2,295 | $303.14 | 42% |
| Torchiara | 17 | $2,156 | $331.04 | 28% |
| Castellana Grotte | 193 | $1,896 | $226.75 | 40% |
| Polignano a Mare | 654 | $1,829 | $202.79 | 42% |
| Torregrotta | 10 | $1,776 | $365.51 | 27% |
| Carovigno | 445 | $1,704 | $281.65 | 38% |
| Ostuni | 1,524 | $1,610 | $248.86 | 35% |
| San Vito dei Normanni | 166 | $1,601 | $256.21 | 37% |
| Ceglie Messapica | 382 | $1,574 | $245.66 | 36% |
| Monopoli | 1,175 | $1,548 | $192.76 | 40% |