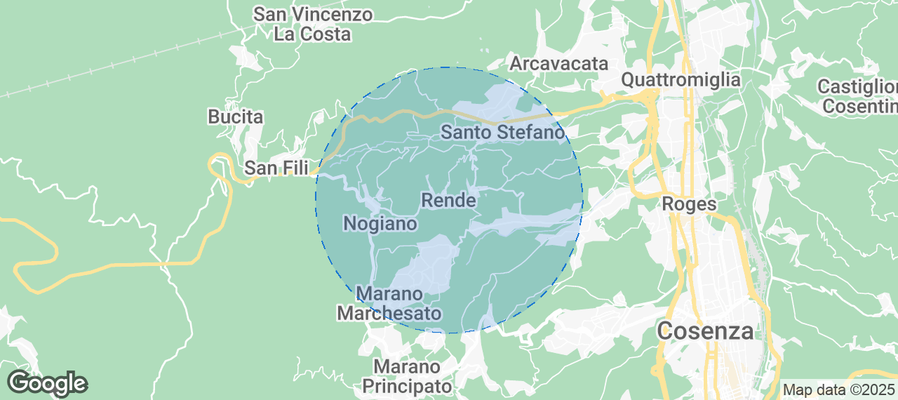
Rende Airbnb Market Analysis 2025: Short Term Rental Data & Vacation Rental Statistics in Cosenza, Italy
Is Airbnb profitable in Rende in 2025? Explore comprehensive Airbnb analytics for Rende, Cosenza, Italy to uncover income potential. This 2025 STR market report for Rende, based on AirROI data from July 2024 to June 2025, reveals key trends in the niche market of 18 active listings.
Whether you're considering an Airbnb investment in Rende, optimizing your existing vacation rental, or exploring rental arbitrage opportunities, understanding the Rende Airbnb data is crucial. Leveraging the low regulation environment is key to maximizing your short term rental income potential. Let's dive into the specifics.
Key Rende Airbnb Performance Metrics Overview
Monthly Airbnb Revenue Variations & Income Potential in Rende (2025)
Understanding the monthly revenue variations for Airbnb listings in Rende is key to maximizing your short term rental income potential. Seasonality significantly impacts earnings. Our analysis, based on data from the past 12 months, shows that the peak revenue month for STRs in Rende is typically May, while November often presents the lowest earnings, highlighting opportunities for strategic pricing adjustments during shoulder and low seasons. Explore the typical Airbnb income in Rende across different performance tiers:
- Best-in-class properties (Top 10%) achieve $2,441+ monthly, often utilizing dynamic pricing and superior guest experiences.
- Strong performing properties (Top 25%) earn $894 or more, indicating effective management and desirable locations/amenities.
- Typical properties (Median) generate around $441 per month, representing the average market performance.
- Entry-level properties (Bottom 25%) see earnings around $254, often with potential for optimization.
Average Monthly Airbnb Earnings Trend in Rende
Rende Airbnb Occupancy Rate Trends (2025)
Maximize your bookings by understanding the Rende STR occupancy trends. Seasonal demand shifts significantly influence how often properties are booked. Typically, Maysees the highest demand (peak season occupancy), while November experiences the lowest (low season). Effective strategies, like adjusting minimum stays or offering promotions, can boost occupancy during slower periods. Here's how different property tiers perform in Rende:
- Best-in-class properties (Top 10%) achieve 69%+ occupancy, indicating high desirability and potentially optimized availability.
- Strong performing properties (Top 25%) maintain 49% or higher occupancy, suggesting good market fit and guest satisfaction.
- Typical properties (Median) have an occupancy rate around 25%.
- Entry-level properties (Bottom 25%) average 16% occupancy, potentially facing higher vacancy.
Average Monthly Occupancy Rate Trend in Rende
Average Daily Rate (ADR) Airbnb Trends in Rende (2025)
Effective short term rental pricing strategy in Rende involves understanding monthly ADR fluctuations. The Average Daily Rate (ADR) for Airbnb in Rende typically peaks in June and dips lowest during September. Leveraging Airbnb dynamic pricing tools or strategies based on this seasonality can significantly boost revenue. Here's a look at the typical nightly rates achieved:
- Best-in-class properties (Top 10%) command rates of $89+ per night, often due to premium features or locations.
- Strong performing properties (Top 25%) achieve nightly rates of $68 or more.
- Typical properties (Median) charge around $51 per night.
- Entry-level properties (Bottom 25%) earn around $36 per night.
Average Daily Rate (ADR) Trend by Month in Rende
Get Live Rende Market Intelligence 👇
Explore Real-time Analytics
Airbnb Seasonality Analysis & Trends in Rende (2025)
Peak Season (May, June, August)
- Revenue averages $1,854 per month
- Occupancy rates average 44.5%
- Daily rates average $76
Shoulder Season
- Revenue averages $771 per month
- Occupancy maintains around 35.0%
- Daily rates hold near $64
Low Season (January, February, November)
- Revenue drops to average $345 per month
- Occupancy decreases to average 22.3%
- Daily rates adjust to average $63
Seasonality Insights for Rende
- The Airbnb seasonality in Rende shows highly seasonal trends requiring careful strategy. While the sections above show seasonal averages, it's also insightful to look at the extremes:
- During the high season, the absolute peak month showcases Rende's highest earning potential, with monthly revenues capable of climbing to $2,526, occupancy reaching a high of 66.1%, and ADRs peaking at $86.
- Conversely, the slowest single month of the year, typically falling within the low season, marks the market's lowest point. In this month, revenue might dip to $211, occupancy could drop to 17.7%, and ADRs may adjust down to $58.
- Understanding both the seasonal averages and these monthly peaks and troughs in revenue, occupancy, and ADR is crucial for maximizing your Airbnb profit potential in Rende.
Seasonal Strategies for Maximizing Profit
- Peak Season: Maximize revenue through premium pricing and potentially longer minimum stays. Ensure high availability.
- Low Season: Offer competitive pricing, special promotions (e.g., extended stay discounts), and flexible cancellation policies. Target off-season travelers like remote workers or budget-conscious guests.
- Shoulder Seasons: Implement dynamic pricing that balances peak and low rates. Target weekend travelers or specific events. Offer slightly more flexible terms than peak season.
- Regularly analyze your own performance against these Rende seasonality benchmarks and adjust your pricing and availability strategy accordingly.
Best Areas for Airbnb Investment in Rende (2025)
Exploring the top neighborhoods for short-term rentals in Rende? This section highlights key areas, outlining why they are attractive for hosts and guests, along with notable local attractions. Consider these locations based on your target guest profile and investment strategy.
| Neighborhood / Area | Why Host Here? (Target Guests & Appeal) | Key Attractions & Landmarks |
|---|---|---|
| Centro Storico | The historical center of Rende features charming streets, ancient buildings, and a vibrant atmosphere. It attracts visitors interested in culture and history, making it ideal for Airbnb. | Rende Castle, Chiesa di Santa Maria della Visitazione, Piazza Italia, Museo del Presente, Università della Calabria |
| Università della Calabria | Located near the university, this area attracts students, visiting professors, and families visiting students. A prime location for long-term stays and academic visitors. | Università della Calabria, Teatro Auditorium, Parco della Biodiversità, Sport facilities |
| Villaggio Frassa | A suburban area that combines residential comfort with proximity to both nature and urban amenities. Suitable for families and longer stays. | Parco Frasso, Local markets, Hiking trails nearby, Family-friendly cafes |
| Viale della Libertà | A busy thoroughfare known for shops and dining options. It attracts visitors who prefer active urban environments, making it a lively option for hosting. | Shopping centers, Restaurants and bars, Public transit access, Cultural events |
| Castiglione Cosentino | A nearby quaint and picturesque village with stunning views and local charm, offering a more serene Airbnb experience. | Historic architecture, Local festivals, Natural landscapes, Cultural heritage sites |
| Cosenza | As the nearby city with rich history and vibrant culture, it attracts many tourists year-round and provides easy access to Rende for guests seeking urban amenities. | Cosenza Cathedral, Alarico Castle, Museum of Brettii and Enotri, Nuova Cosenza Shopping Complex |
| Rende Nuova | A more modern district known for its residential buildings and convenience. It appeals to young professionals and business travelers. | Shopping plazas, Local eateries, Parks and green spaces, Business centers |
| Parco Nazionale della Sila | A short drive from Rende, this national park offers stunning natural beauty and outdoor activities. Perfect for tourists looking for nature retreats and adventure. | Hiking trails, Lake Arvo, Wildlife viewing, Picnic areas |
Understanding Airbnb License Requirements & STR Laws in Rende (2025)
While Rende, Cosenza, Italy currently shows low STR regulations, specific Airbnb license requirements might still exist or change. Always verify the latest short term rental regulations and Airbnb license requirements directly with local government authorities for Rende to ensure full compliance before hosting.
(Source: AirROI data, 2025, finding no licensed listings among those analyzed)
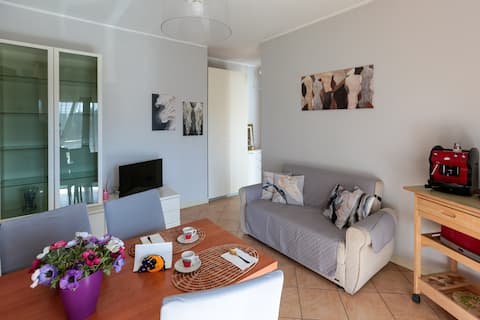
Top Performing Airbnb Properties in Rende (2025)
Benchmark your potential! Explore examples of top-performing Airbnb properties in Rendebased on Trailing Twelve Month (TTM) revenue. Analyze their characteristics, revenue, occupancy rate, and ADR to understand what drives success in this market.

Villa del Borgo
Entire Place • 5 bedrooms

Civico 23
Entire Place • 2 bedrooms

Villa Rossana
Entire Place • 6 bedrooms
Casa Verina - Colorful balconies - Quattromiglia
Entire Place • 1 bedroom

Campus Residence - Double Room
Entire Place • 1 bedroom

La Villetta
Entire Place • 2 bedrooms
Note: Performance varies based on location, size, amenities, seasonality, and management quality. Data reflects the past 12 months.
Top Performing Airbnb Hosts in Rende (2025)
Learn from the best! This table showcases top-performing Airbnb hosts in Rende based on the number of properties managed and estimated total revenue over the past year. Analyze their scale and performance metrics.
| Host Name | Properties | Grossing Revenue | Stay Reviews | Avg Rating |
|---|---|---|---|---|
| Novasol | 1 | $45,229 | 6 | 4.67/5.0 |
| Nicola | 2 | $9,938 | 43 | 4.83/5.0 |
| Mario | 2 | $8,357 | 6 | 5.00/5.0 |
| Rosanna | 1 | $8,258 | 53 | 4.98/5.0 |
| Novasol | 1 | $7,383 | 5 | 4.80/5.0 |
| Manuel | 1 | $6,949 | 16 | 5.00/5.0 |
| Francesco | 1 | $5,525 | 76 | 4.82/5.0 |
| Andrea | 1 | $2,771 | 8 | 5.00/5.0 |
| Host #112292925 | 1 | $1,790 | 0 | Not Rated |
| Luca | 1 | $849 | 46 | 4.59/5.0 |
Analyzing the strategies of top hosts, such as their property selection, pricing, and guest communication, can offer valuable lessons for optimizing your own Airbnb operations in Rende.
Dive Deeper: Advanced Rende STR Market Data (2025)
Ready to unlock more insights? AirROI provides access to advanced metrics and comprehensive Airbnb data for Rende. Explore detailed analytics beyond this report to refine your investment strategy, optimize pricing, and maximize your vacation rental profits.
Explore Advanced MetricsRende Short-Term Rental Market Composition (2025): Property & Room Types
Room Type Distribution
Property Type Distribution
Market Composition Insights for Rende
- The Rende Airbnb market composition is heavily skewed towards Entire Home/Apt listings, which make up 72.2% of the 18 active rentals. This indicates strong guest preference for privacy and space.
- Looking at the property type distribution in Rende, Apartment/Condo properties are the most common (44.4%), reflecting the local real estate landscape.
- Houses represent a significant 38.9% portion, catering likely to families or larger groups.
- The presence of 16.7% Hotel/Boutique listings indicates integration with traditional hospitality.
Rende Airbnb Room Capacity Analysis (2025): Bedroom Distribution
Distribution of Listings by Number of Bedrooms
Room Capacity Insights for Rende
- The dominant room capacity in Rende is 2 bedrooms listings, making up 33.3% of the market. This suggests a strong demand for properties suitable for couples or solo travelers.
- Together, 2 bedrooms and 1 bedroom properties represent 61.1% of the active Airbnb listings in Rende, indicating a high concentration in these sizes.
- A significant 27.9% of listings offer 3+ bedrooms, catering to larger groups and families seeking more space in Rende.
Rende Vacation Rental Guest Capacity Trends (2025)
Distribution of Listings by Guest Capacity
Guest Capacity Insights for Rende
- The most common guest capacity trend in Rende vacation rentals is listings accommodating 3 guests (27.8%). This suggests the primary traveler segment is likely small families or groups.
- Properties designed for 3 guests and 2 guests dominate the Rende STR market, accounting for 50.0% of listings.
- 16.7% of properties accommodate 6+ guests, serving the market segment for larger families or group travel in Rende.
- On average, properties in Rende are equipped to host 3.1 guests.
Rende Airbnb Booking Patterns (2025): Available vs. Booked Days
Available Days Distribution
Booked Days Distribution
Booking Pattern Insights for Rende
- The most common availability pattern in Rende falls within the 271-366 days range, representing 66.7% of listings. This suggests many properties have significant open periods on their calendars.
- Approximately 100.0% of listings show high availability (181+ days open annually), indicating potential for increased bookings or specific owner usage patterns.
- For booked days, the 1-30 days range is most frequent in Rende (44.4%), reflecting common guest stay durations or potential owner blocking patterns.
Rende Airbnb Minimum Stay Requirements Analysis
Distribution of Listings by Minimum Night Requirement
1 Night
9 listings
50% of total
2 Nights
3 listings
16.7% of total
4-6 Nights
1 listings
5.6% of total
7-29 Nights
3 listings
16.7% of total
30+ Nights
2 listings
11.1% of total
Key Insights
- The most prevalent minimum stay requirement in Rende is 1 Night, adopted by 50% of listings. This highlights the market's preference for shorter, flexible bookings.
- A strong majority (66.7%) of the Rende Airbnb data shows acceptance of very short stays (1-2 nights), indicating a dynamic, high-turnover market.
- A significant segment (11.1%) caters to monthly stays (30+ nights) in Rende, pointing to opportunities in the extended-stay market.
Recommendations
- Align with the market by considering a 1 Night minimum stay, as 50% of Rende hosts use this setting.
- Explore offering discounts for stays of 30+ nights to attract the 11.1% of the market seeking extended stays.
- Adjust minimum nights based on seasonality – potentially shorter during low season and longer during peak demand periods in Rende.
Rende Airbnb Cancellation Policy Trends Analysis (2025)
Super Strict 60 Days
2 listings
11.8% of total
Flexible
9 listings
52.9% of total
Moderate
3 listings
17.6% of total
Strict
3 listings
17.6% of total
Cancellation Policy Insights for Rende
- The prevailing Airbnb cancellation policy trend in Rende is Flexible, used by 52.9% of listings.
- The market strongly favors guest-friendly terms, with 70.5% of listings offering Flexible or Moderate policies. This suggests guests in Rende may expect booking flexibility.
Recommendations for Hosts
- Consider adopting a Flexible policy to align with the 52.9% market standard in Rende.
- Given the high prevalence of Flexible policies (52.9%), offering this can enhance booking appeal, especially during shoulder seasons.
- Regularly review your cancellation policy against competitors and market demand shifts in Rende.
Rende STR Booking Lead Time Analysis (2025)
Average Booking Lead Time by Month
Booking Lead Time Insights for Rende
- The overall average booking lead time for vacation rentals in Rende is 25 days.
- Guests book furthest in advance for stays during June (average 46 days), likely coinciding with peak travel demand or local events.
- The shortest booking windows occur for stays in November (average 9 days), indicating more last-minute travel plans during this time.
- Seasonally, Summer (36 days avg.) sees the longest lead times, while Winter (19 days avg.) has the shortest, reflecting typical travel planning cycles.
Recommendations for Hosts
- Use the overall average lead time (25 days) as a baseline for your pricing and availability strategy in Rende.
- For June stays, consider implementing length-of-stay discounts or slightly higher rates for bookings made less than 46 days out to capitalize on advance planning.
- During November, focus on last-minute booking availability and promotions, as guests book with very short notice (9 days avg.).
- Target marketing efforts for the Summer season well in advance (at least 36 days) to capture early planners.
- Monitor your own booking lead times against these Rende averages to identify opportunities for dynamic pricing adjustments.
Popular & Essential Airbnb Amenities in Rende (2025)
Amenity data is currently unavailable for Rende.
Rende Airbnb Guest Demographics & Profile Analysis (2025)
Guest Profile Summary for Rende
- The typical guest profile for Airbnb in Rende consists of a mix of domestic (49%) and international guests, with top international origins including United States, typically belonging to the Post-2000s (Gen Z/Alpha) group (50%), primarily speaking English or Italian.
- Domestic travelers account for 48.9% of guests.
- Key international markets include Italy (48.9%) and United States (10.6%).
- Top languages spoken are English (35.6%) followed by Italian (27.4%).
- A significant demographic segment is the Post-2000s (Gen Z/Alpha) group, representing 50% of guests.
Recommendations for Hosts
- Balance marketing efforts between domestic and international channels based on the guest mix.
- Tailor amenities and listing descriptions to appeal to the dominant Post-2000s (Gen Z/Alpha) demographic (e.g., highlight fast WiFi, smart home features, local guides).
- Highlight unique local experiences or amenities relevant to the primary guest profile.
- Consider seasonal promotions aligned with peak travel times for key origin markets.
Nearby Short-Term Rental Market Comparison
How does the Rende Airbnb market stack up against its neighbors? Compare key performance metrics like average monthly revenue, ADR, and occupancy rates in surrounding areas to understand the broader regional STR landscape.
| Market | Active Properties | Monthly Revenue | Daily Rate | Avg. Occupancy |
|---|---|---|---|---|
| San Michele Salentino | 72 | $2,214 | $278.84 | 43% |
| Torchiara | 18 | $2,030 | $298.32 | 28% |
| Castellana Grotte | 186 | $1,800 | $225.20 | 41% |
| Torregrotta | 16 | $1,773 | $262.70 | 33% |
| Polignano a Mare | 666 | $1,767 | $197.20 | 43% |
| Carovigno | 453 | $1,707 | $264.18 | 41% |
| Ostuni | 1,583 | $1,567 | $237.00 | 37% |
| Monopoli | 1,178 | $1,519 | $190.58 | 41% |
| Ceglie Messapica | 398 | $1,500 | $231.34 | 39% |
| Martina Franca | 610 | $1,485 | $209.23 | 38% |