Villapiana Airbnb Market Analysis 2025: Short Term Rental Data & Vacation Rental Statistics in Cosenza, Italy
Is Airbnb profitable in Villapiana in 2025? Explore comprehensive Airbnb analytics for Villapiana, Cosenza, Italy to uncover income potential. This 2025 STR market report for Villapiana, based on AirROI data from September 2024 to August 2025, reveals key trends in the niche market of 18 active listings.
Whether you're considering an Airbnb investment in Villapiana, optimizing your existing vacation rental, or exploring rental arbitrage opportunities, understanding the Villapiana Airbnb data is crucial. Leveraging the low regulation environment is key to maximizing your short term rental income potential. Let's dive into the specifics.
Key Villapiana Airbnb Performance Metrics Overview
Monthly Airbnb Revenue Variations & Income Potential in Villapiana (2025)
Understanding the monthly revenue variations for Airbnb listings in Villapiana is key to maximizing your short term rental income potential. Seasonality significantly impacts earnings. Our analysis, based on data from the past 12 months, shows that the peak revenue month for STRs in Villapiana is typically July, while February often presents the lowest earnings, highlighting opportunities for strategic pricing adjustments during shoulder and low seasons. Explore the typical Airbnb income in Villapiana across different performance tiers:
- Best-in-class properties (Top 10%) achieve $901+ monthly, often utilizing dynamic pricing and superior guest experiences.
- Strong performing properties (Top 25%) earn $659 or more, indicating effective management and desirable locations/amenities.
- Typical properties (Median) generate around $275 per month, representing the average market performance.
- Entry-level properties (Bottom 25%) see earnings around $119, often with potential for optimization.
Average Monthly Airbnb Earnings Trend in Villapiana
Villapiana Airbnb Occupancy Rate Trends (2025)
Maximize your bookings by understanding the Villapiana STR occupancy trends. Seasonal demand shifts significantly influence how often properties are booked. Typically, Julysees the highest demand (peak season occupancy), while February experiences the lowest (low season). Effective strategies, like adjusting minimum stays or offering promotions, can boost occupancy during slower periods. Here's how different property tiers perform in Villapiana:
- Best-in-class properties (Top 10%) achieve 39%+ occupancy, indicating high desirability and potentially optimized availability.
- Strong performing properties (Top 25%) maintain 26% or higher occupancy, suggesting good market fit and guest satisfaction.
- Typical properties (Median) have an occupancy rate around 13%.
- Entry-level properties (Bottom 25%) average 7% occupancy, potentially facing higher vacancy.
Average Monthly Occupancy Rate Trend in Villapiana
Average Daily Rate (ADR) Airbnb Trends in Villapiana (2025)
Effective short term rental pricing strategy in Villapiana involves understanding monthly ADR fluctuations. The Average Daily Rate (ADR) for Airbnb in Villapiana typically peaks in September and dips lowest during April. Leveraging Airbnb dynamic pricing tools or strategies based on this seasonality can significantly boost revenue. Here's a look at the typical nightly rates achieved:
- Best-in-class properties (Top 10%) command rates of $361+ per night, often due to premium features or locations.
- Strong performing properties (Top 25%) achieve nightly rates of $100 or more.
- Typical properties (Median) charge around $82 per night.
- Entry-level properties (Bottom 25%) earn around $61 per night.
Average Daily Rate (ADR) Trend by Month in Villapiana
Get Live Villapiana Market Intelligence 👇

Explore Real-time Analytics
Airbnb Seasonality Analysis & Trends in Villapiana (2025)
Peak Season (July, August, September)
- Revenue averages $967 per month
- Occupancy rates average 34.3%
- Daily rates average $109
Shoulder Season
- Revenue averages $325 per month
- Occupancy maintains around 15.8%
- Daily rates hold near $104
Low Season (February, March, November)
- Revenue drops to average $97 per month
- Occupancy decreases to average 6.3%
- Daily rates adjust to average $127
Seasonality Insights for Villapiana
- The Airbnb seasonality in Villapiana shows highly seasonal trends requiring careful strategy. While the sections above show seasonal averages, it's also insightful to look at the extremes:
- During the high season, the absolute peak month showcases Villapiana's highest earning potential, with monthly revenues capable of climbing to $1,234, occupancy reaching a high of 37.1%, and ADRs peaking at $129.
- Conversely, the slowest single month of the year, typically falling within the low season, marks the market's lowest point. In this month, revenue might dip to $47, occupancy could drop to 3.6%, and ADRs may adjust down to $72.
- Understanding both the seasonal averages and these monthly peaks and troughs in revenue, occupancy, and ADR is crucial for maximizing your Airbnb profit potential in Villapiana.
Seasonal Strategies for Maximizing Profit
- Peak Season: Maximize revenue through premium pricing and potentially longer minimum stays. Ensure high availability.
- Low Season: Offer competitive pricing, special promotions (e.g., extended stay discounts), and flexible cancellation policies. Target off-season travelers like remote workers or budget-conscious guests.
- Shoulder Seasons: Implement dynamic pricing that balances peak and low rates. Target weekend travelers or specific events. Offer slightly more flexible terms than peak season.
- Regularly analyze your own performance against these Villapiana seasonality benchmarks and adjust your pricing and availability strategy accordingly.
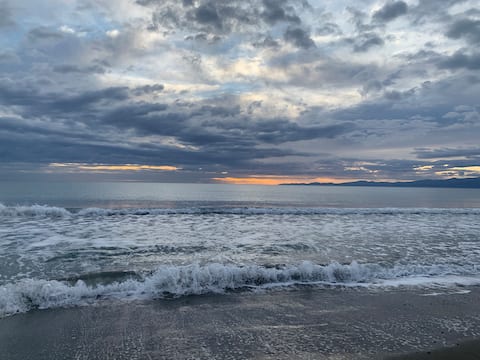
Best Areas for Airbnb Investment in Villapiana (2025)
Exploring the top neighborhoods for short-term rentals in Villapiana? This section highlights key areas, outlining why they are attractive for hosts and guests, along with notable local attractions. Consider these locations based on your target guest profile and investment strategy.
| Neighborhood / Area | Why Host Here? (Target Guests & Appeal) | Key Attractions & Landmarks |
|---|---|---|
| Villapiana Lido | A popular seaside resort area known for its beautiful sandy beaches and family-friendly atmosphere. It's ideal for tourists looking for relaxation and sunbathing. | Villapiana Beach, Spiaggia di Villapiana, local seafood restaurants, Beachfront promenades, water sports activities |
| Villapiana Alta | The historic center of Villapiana, offering stunning views and a glimpse into traditional Italian life. Attracts visitors interested in culture and history. | Church of San Rocco, Ancient stone houses, Local festivals, Scenic viewpoints, Historic architecture |
| Torre di Pisa | A quiet area known for its natural beauty and secluded beaches, perfect for those looking for a peaceful retreat away from the crowds. | Secluded beaches, Natural parks, Hiking trails, Wildlife watching, Fishing spots |
| Amendolara | Nearby coastal town offering historical attractions and beautiful landscapes, attracting visitors interested in exploring the region's heritage. | Castello di Amendolara, local vineyards, traditional cuisine, Scenic coastal views, Cultural events |
| Cosenza (nearby) | The nearby historic city offers a rich cultural scene, ideal for guests who want a city experience combined with access to the coast. | Cosenza Cathedral, Basilica di San Domenico, Museo dei Brettii, Centro Storico, Historical landmarks |
| Sibari | Known for its archaeological heritage and a wide array of tourist services, appealing to history buffs and beach-goers alike. | Sibari Archaeological Park, Sibari Beach, local restaurants, Cultural events, Natural parks |
| Rossano | Famous for its ancient history and the Codex Purpureus Rossanensis, this town attracts cultural tourists looking for unique experiences. | Rossano Cathedral, Codex Museum, Castello di Rossano, Historical tours, Local crafts |
| Castrovillari (nearby) | A cultural hub with stunning natural scenery in the Pollino National Park, attracting outdoor enthusiasts and culture seekers. | Pollino National Park, Castrovillari Old Town, local festivals, Scenic hiking trails, Archaeological museums |
Understanding Airbnb License Requirements & STR Laws in Villapiana (2025)
While Villapiana, Cosenza, Italy currently shows low STR regulations, specific Airbnb license requirements might still exist or change. Always verify the latest short term rental regulations and Airbnb license requirements directly with local government authorities for Villapiana to ensure full compliance before hosting.
(Source: AirROI data, 2025, finding no licensed listings among those analyzed)
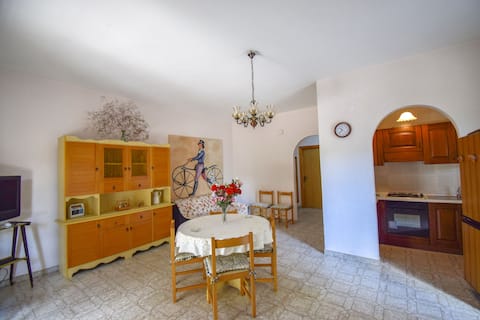
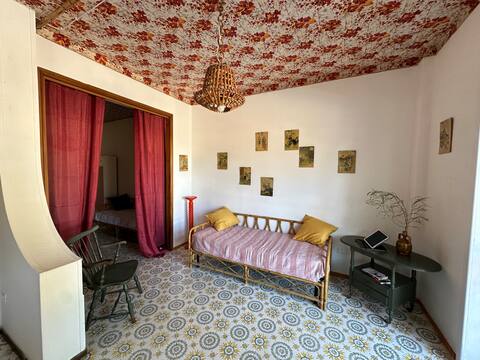
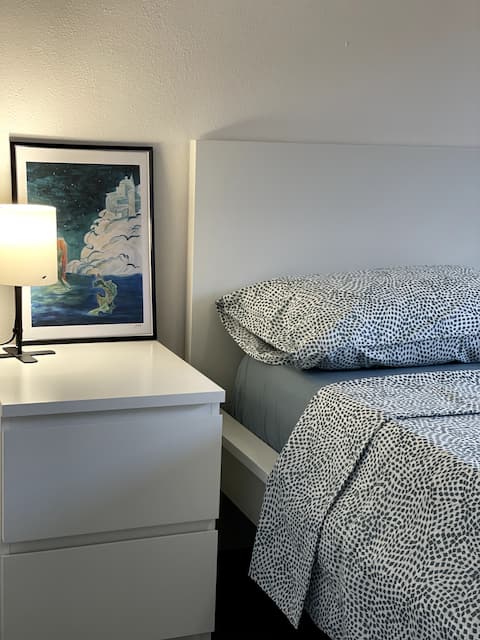
Top Performing Airbnb Properties in Villapiana (2025)
Benchmark your potential! Explore examples of top-performing Airbnb properties in Villapianabased on Trailing Twelve Month (TTM) revenue. Analyze their characteristics, revenue, occupancy rate, and ADR to understand what drives success in this market.
Apt pinnacchio with ac near sea
Entire Place • 2 bedrooms
CASA NINA BY THE SEA
Entire Place • 2 bedrooms

Ground floor house on the sea
Entire Place • 1 bedroom
A stone's throw from the beach
Entire Place • 2 bedrooms
Entire newly renovated accommodation
Entire Place • 1 bedroom
Casa Villapiana lido
Entire Place • 2 bedrooms
Note: Performance varies based on location, size, amenities, seasonality, and management quality. Data reflects the past 12 months.
Top Performing Airbnb Hosts in Villapiana (2025)
Learn from the best! This table showcases top-performing Airbnb hosts in Villapiana based on the number of properties managed and estimated total revenue over the past year. Analyze their scale and performance metrics.
| Host Name | Properties | Grossing Revenue | Stay Reviews | Avg Rating |
|---|---|---|---|---|
| Samantha Geco Vacation Rentals | 1 | $8,008 | 1 | Not Rated |
| Marco E Esmeralda | 1 | $7,541 | 35 | 4.83/5.0 |
| Giuliano | 4 | $5,686 | 23 | 4.90/5.0 |
| Gaetano | 2 | $3,019 | 10 | 4.50/5.0 |
| Tiziana | 1 | $2,653 | 2 | Not Rated |
| Francesco | 3 | $2,556 | 17 | 4.06/5.0 |
| Francesca | 1 | $2,190 | 5 | 4.60/5.0 |
| Caterina | 1 | $2,164 | 1 | Not Rated |
| Iolanda | 1 | $1,893 | 11 | 4.73/5.0 |
| Paola | 1 | $875 | 4 | 5.00/5.0 |
Analyzing the strategies of top hosts, such as their property selection, pricing, and guest communication, can offer valuable lessons for optimizing your own Airbnb operations in Villapiana.
Dive Deeper: Advanced Villapiana STR Market Data (2025)
Ready to unlock more insights? AirROI provides access to advanced metrics and comprehensive Airbnb data for Villapiana. Explore detailed analytics beyond this report to refine your investment strategy, optimize pricing, and maximize your vacation rental profits.
Explore Advanced MetricsVillapiana Short-Term Rental Market Composition (2025): Property & Room Types
Room Type Distribution
Property Type Distribution
Market Composition Insights for Villapiana
- The Villapiana Airbnb market composition is heavily skewed towards Entire Home/Apt listings, which make up 100% of the 18 active rentals. This indicates strong guest preference for privacy and space.
- Looking at the property type distribution in Villapiana, Apartment/Condo properties are the most common (61.1%), reflecting the local real estate landscape.
- Houses represent a significant 38.9% portion, catering likely to families or larger groups.
Villapiana Airbnb Room Capacity Analysis (2025): Bedroom Distribution
Distribution of Listings by Number of Bedrooms
Room Capacity Insights for Villapiana
- The dominant room capacity in Villapiana is 2 bedrooms listings, making up 83.3% of the market. This suggests a strong demand for properties suitable for couples or solo travelers.
- Together, 2 bedrooms and 1 bedroom properties represent 100.0% of the active Airbnb listings in Villapiana, indicating a high concentration in these sizes.
Villapiana Vacation Rental Guest Capacity Trends (2025)
Distribution of Listings by Guest Capacity
Guest Capacity Insights for Villapiana
- The most common guest capacity trend in Villapiana vacation rentals is listings accommodating 5 guests (44.4%). This suggests the primary traveler segment is likely larger groups.
- Properties designed for 5 guests and 6 guests dominate the Villapiana STR market, accounting for 72.2% of listings.
- 27.8% of properties accommodate 6+ guests, serving the market segment for larger families or group travel in Villapiana.
- On average, properties in Villapiana are equipped to host 4.9 guests.
Villapiana Airbnb Booking Patterns (2025): Available vs. Booked Days
Available Days Distribution
Booked Days Distribution
Booking Pattern Insights for Villapiana
- The most common availability pattern in Villapiana falls within the 271-366 days range, representing 94.4% of listings. This suggests many properties have significant open periods on their calendars.
- Approximately 100.0% of listings show high availability (181+ days open annually), indicating potential for increased bookings or specific owner usage patterns.
- For booked days, the 1-30 days range is most frequent in Villapiana (77.8%), reflecting common guest stay durations or potential owner blocking patterns.
Villapiana Airbnb Minimum Stay Requirements Analysis
Distribution of Listings by Minimum Night Requirement
2 Nights
1 listings
5.6% of total
3 Nights
1 listings
5.6% of total
4-6 Nights
1 listings
5.6% of total
7-29 Nights
9 listings
50% of total
30+ Nights
6 listings
33.3% of total
Key Insights
- The most prevalent minimum stay requirement in Villapiana is 7-29 Nights, adopted by 50% of listings. This highlights the market's preference for shorter, flexible bookings.
- Very short stays (1-2 nights) are less common (5.6%), suggesting hosts prefer slightly longer bookings to optimize turnover.
- A significant segment (33.3%) caters to monthly stays (30+ nights) in Villapiana, pointing to opportunities in the extended-stay market.
Recommendations
- Align with the market by considering a 7-29 Nights minimum stay, as 50% of Villapiana hosts use this setting.
- Explore offering discounts for stays of 30+ nights to attract the 33.3% of the market seeking extended stays.
- Adjust minimum nights based on seasonality – potentially shorter during low season and longer during peak demand periods in Villapiana.
Villapiana Airbnb Cancellation Policy Trends Analysis (2025)
Super Strict 30 Days
1 listings
5.6% of total
Flexible
1 listings
5.6% of total
Moderate
6 listings
33.3% of total
Strict
10 listings
55.6% of total
Cancellation Policy Insights for Villapiana
- The prevailing Airbnb cancellation policy trend in Villapiana is Strict, used by 55.6% of listings.
- A majority (55.6%) of hosts in Villapiana utilize Firm or Strict policies, indicating a market where hosts prioritize booking security.
Recommendations for Hosts
- Consider adopting a Strict policy to align with the 55.6% market standard in Villapiana.
- With 55.6% using Strict terms, this is a viable option in Villapiana, particularly for high-value properties or during peak demand periods.
- Regularly review your cancellation policy against competitors and market demand shifts in Villapiana.
Villapiana STR Booking Lead Time Analysis (2025)
Average Booking Lead Time by Month
Booking Lead Time Insights for Villapiana
- The overall average booking lead time for vacation rentals in Villapiana is 49 days.
- Guests book furthest in advance for stays during August (average 159 days), likely coinciding with peak travel demand or local events.
- The shortest booking windows occur for stays in November (average 1 days), indicating more last-minute travel plans during this time.
- Seasonally, Summer (101 days avg.) sees the longest lead times, while Spring (3 days avg.) has the shortest, reflecting typical travel planning cycles.
Recommendations for Hosts
- Use the overall average lead time (49 days) as a baseline for your pricing and availability strategy in Villapiana.
- For August stays, consider implementing length-of-stay discounts or slightly higher rates for bookings made less than 159 days out to capitalize on advance planning.
- During November, focus on last-minute booking availability and promotions, as guests book with very short notice (1 days avg.).
- Target marketing efforts for the Summer season well in advance (at least 101 days) to capture early planners.
- Monitor your own booking lead times against these Villapiana averages to identify opportunities for dynamic pricing adjustments.
Popular & Essential Airbnb Amenities in Villapiana (2025)
Amenity Prevalence
Amenity Insights for Villapiana
- Essential amenities in Villapiana that guests expect include: Kitchen. Lacking these (this) could significantly impact bookings.
- Popular amenities like Washer, Essentials, Hot water are common but not universal. Offering these can provide a competitive edge.
Recommendations for Hosts
- Ensure your listing includes all essential amenities for Villapiana: Kitchen.
- Consider adding popular differentiators like Washer or Essentials to increase appeal.
- Highlight unique or less common amenities you offer (e.g., hot tub, dedicated workspace, EV charger) in your listing description and photos.
- Regularly check competitor amenities in Villapiana to stay competitive.
Villapiana Airbnb Guest Demographics & Profile Analysis (2025)
Guest Profile Summary for Villapiana
- The typical guest profile for Airbnb in Villapiana consists of a mix of domestic (36%) and international guests, with top international origins including Argentina, typically belonging to the Pre-1950s (Silent Gen) group (50%), primarily speaking English or German.
- Domestic travelers account for 36.4% of guests.
- Key international markets include Italy (36.4%) and Argentina (18.2%).
- Top languages spoken are English (33.3%) followed by German (22.2%).
- A significant demographic segment is the Post-2000s (Gen Z/Alpha) group, representing 50% of guests.
Recommendations for Hosts
- Focus marketing internationally, particularly towards travelers from Argentina.
- Tailor amenities and listing descriptions to appeal to the dominant Pre-1950s (Silent Gen) demographic while maintaining broad appeal across age groups.
- Highlight unique local experiences or amenities relevant to the primary guest profile.
- Consider seasonal promotions aligned with peak travel times for key origin markets.
Nearby Short-Term Rental Market Comparison
How does the Villapiana Airbnb market stack up against its neighbors? Compare key performance metrics like average monthly revenue, ADR, and occupancy rates in surrounding areas to understand the broader regional STR landscape.
| Market | Active Properties | Monthly Revenue | Daily Rate | Avg. Occupancy |
|---|---|---|---|---|
| San Michele Salentino | 74 | $2,295 | $303.14 | 42% |
| Torchiara | 17 | $2,156 | $331.04 | 28% |
| Castellana Grotte | 193 | $1,896 | $226.75 | 40% |
| Polignano a Mare | 654 | $1,829 | $202.79 | 42% |
| Torregrotta | 10 | $1,776 | $365.51 | 27% |
| Carovigno | 445 | $1,704 | $281.65 | 38% |
| Ostuni | 1,524 | $1,610 | $248.86 | 35% |
| San Vito dei Normanni | 166 | $1,601 | $256.21 | 37% |
| Ceglie Messapica | 382 | $1,574 | $245.66 | 36% |
| Monopoli | 1,175 | $1,548 | $192.76 | 40% |