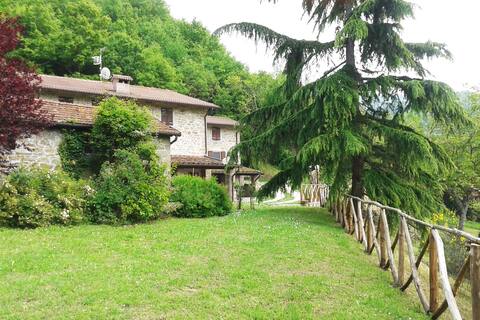
Bagno di Romagna Airbnb Market Analysis 2025: Short Term Rental Data & Vacation Rental Statistics in Emilia-Romagna, Italy
Is Airbnb profitable in Bagno di Romagna in 2025? Explore comprehensive Airbnb analytics for Bagno di Romagna, Emilia-Romagna, Italy to uncover income potential. This 2025 STR market report for Bagno di Romagna, based on AirROI data from July 2024 to June 2025, reveals key trends in the niche market of 18 active listings.
Whether you're considering an Airbnb investment in Bagno di Romagna, optimizing your existing vacation rental, or exploring rental arbitrage opportunities, understanding the Bagno di Romagna Airbnb data is crucial. Leveraging the low regulation environment is key to maximizing your short term rental income potential. Let's dive into the specifics.
Key Bagno di Romagna Airbnb Performance Metrics Overview
Monthly Airbnb Revenue Variations & Income Potential in Bagno di Romagna (2025)
Understanding the monthly revenue variations for Airbnb listings in Bagno di Romagna is key to maximizing your short term rental income potential. Seasonality significantly impacts earnings. Our analysis, based on data from the past 12 months, shows that the peak revenue month for STRs in Bagno di Romagna is typically August, while November often presents the lowest earnings, highlighting opportunities for strategic pricing adjustments during shoulder and low seasons. Explore the typical Airbnb income in Bagno di Romagna across different performance tiers:
- Best-in-class properties (Top 10%) achieve $1,912+ monthly, often utilizing dynamic pricing and superior guest experiences.
- Strong performing properties (Top 25%) earn $1,260 or more, indicating effective management and desirable locations/amenities.
- Typical properties (Median) generate around $758 per month, representing the average market performance.
- Entry-level properties (Bottom 25%) see earnings around $358, often with potential for optimization.
Average Monthly Airbnb Earnings Trend in Bagno di Romagna
Bagno di Romagna Airbnb Occupancy Rate Trends (2025)
Maximize your bookings by understanding the Bagno di Romagna STR occupancy trends. Seasonal demand shifts significantly influence how often properties are booked. Typically, Augustsees the highest demand (peak season occupancy), while November experiences the lowest (low season). Effective strategies, like adjusting minimum stays or offering promotions, can boost occupancy during slower periods. Here's how different property tiers perform in Bagno di Romagna:
- Best-in-class properties (Top 10%) achieve 51%+ occupancy, indicating high desirability and potentially optimized availability.
- Strong performing properties (Top 25%) maintain 35% or higher occupancy, suggesting good market fit and guest satisfaction.
- Typical properties (Median) have an occupancy rate around 21%.
- Entry-level properties (Bottom 25%) average 11% occupancy, potentially facing higher vacancy.
Average Monthly Occupancy Rate Trend in Bagno di Romagna
Average Daily Rate (ADR) Airbnb Trends in Bagno di Romagna (2025)
Effective short term rental pricing strategy in Bagno di Romagna involves understanding monthly ADR fluctuations. The Average Daily Rate (ADR) for Airbnb in Bagno di Romagna typically peaks in February and dips lowest during November. Leveraging Airbnb dynamic pricing tools or strategies based on this seasonality can significantly boost revenue. Here's a look at the typical nightly rates achieved:
- Best-in-class properties (Top 10%) command rates of $199+ per night, often due to premium features or locations.
- Strong performing properties (Top 25%) achieve nightly rates of $110 or more.
- Typical properties (Median) charge around $87 per night.
- Entry-level properties (Bottom 25%) earn around $71 per night.
Average Daily Rate (ADR) Trend by Month in Bagno di Romagna
Get Live Bagno di Romagna Market Intelligence 👇

Explore Real-time Analytics
Airbnb Seasonality Analysis & Trends in Bagno di Romagna (2025)
Peak Season (August, September, April)
- Revenue averages $1,451 per month
- Occupancy rates average 34.2%
- Daily rates average $112
Shoulder Season
- Revenue averages $1,026 per month
- Occupancy maintains around 25.3%
- Daily rates hold near $115
Low Season (February, May, November)
- Revenue drops to average $655 per month
- Occupancy decreases to average 19.7%
- Daily rates adjust to average $120
Seasonality Insights for Bagno di Romagna
- The Airbnb seasonality in Bagno di Romagna shows highly seasonal trends requiring careful strategy. While the sections above show seasonal averages, it's also insightful to look at the extremes:
- During the high season, the absolute peak month showcases Bagno di Romagna's highest earning potential, with monthly revenues capable of climbing to $1,832, occupancy reaching a high of 48.4%, and ADRs peaking at $130.
- Conversely, the slowest single month of the year, typically falling within the low season, marks the market's lowest point. In this month, revenue might dip to $603, occupancy could drop to 16.7%, and ADRs may adjust down to $107.
- Understanding both the seasonal averages and these monthly peaks and troughs in revenue, occupancy, and ADR is crucial for maximizing your Airbnb profit potential in Bagno di Romagna.
Seasonal Strategies for Maximizing Profit
- Peak Season: Maximize revenue through premium pricing and potentially longer minimum stays. Ensure high availability.
- Low Season: Offer competitive pricing, special promotions (e.g., extended stay discounts), and flexible cancellation policies. Target off-season travelers like remote workers or budget-conscious guests.
- Shoulder Seasons: Implement dynamic pricing that balances peak and low rates. Target weekend travelers or specific events. Offer slightly more flexible terms than peak season.
- Regularly analyze your own performance against these Bagno di Romagna seasonality benchmarks and adjust your pricing and availability strategy accordingly.
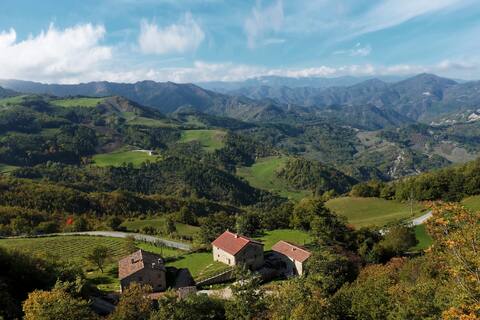
Best Areas for Airbnb Investment in Bagno di Romagna (2025)
Exploring the top neighborhoods for short-term rentals in Bagno di Romagna? This section highlights key areas, outlining why they are attractive for hosts and guests, along with notable local attractions. Consider these locations based on your target guest profile and investment strategy.
| Neighborhood / Area | Why Host Here? (Target Guests & Appeal) | Key Attractions & Landmarks |
|---|---|---|
| Castagno di Pieve | A quaint village that offers a serene atmosphere, making it ideal for travelers seeking relaxation in nature. Close proximity to hiking trails and natural parks. | Foreste Casentinesi, Hiking Trails, Local Vineyards, Natural Springs |
| Bagno di Romagna | The main town, famous for its thermal baths and wellness tourism. A perfect spot for guests looking to rejuvenate and enjoy local cuisine. | Thermal Baths, Parks and Gardens, Romanesque Church of San Giovanni Battista, Museo della Natura, Local Spas |
| Verniano | A peaceful hamlet ideal for families and those looking to escape the city hustle. Offers beautiful scenery and local charm. | Scenic Views, Walking Trails, Local Farms, Community Events |
| Santa Sofia | A charming village with rich history, known for its medieval architecture. Attracts history buffs and those interested in cultural experiences. | Historic Churches, Medieval Architecture, Local Festivals, Artisan Workshops |
| Corniolo | A picturesque area in the Casentino Forests, great for outdoor activities like trekking and connecting with nature. | Casentino Forests, Wildlife Watching, Outdoor Sports, Natural Parks |
| Tredozio | Known for its stunning landscapes and tranquility, perfect for visitors looking for eco-tours and outdoor adventures. | Beautiful Landscapes, Local Cooking Classes, Nature Reserves, Art and Culture Events |
| Campigna | A remote area popular among nature lovers and hikers, with many paths and natural features to explore. | Nature Trails, Picnic Spots, Birdwatching, Nature Photography |
| Soccorso | Great for winter sports enthusiasts and a starting point for exploring the surrounding mountains. Offers ski resorts and cozy accommodations. | Ski Resorts, Mountain Climbing, Winter Sports, Scenic Views |
Understanding Airbnb License Requirements & STR Laws in Bagno di Romagna (2025)
While Bagno di Romagna, Emilia-Romagna, Italy currently shows low STR regulations, specific Airbnb license requirements might still exist or change. Always verify the latest short term rental regulations and Airbnb license requirements directly with local government authorities for Bagno di Romagna to ensure full compliance before hosting.
(Source: AirROI data, 2025, finding no licensed listings among those analyzed)
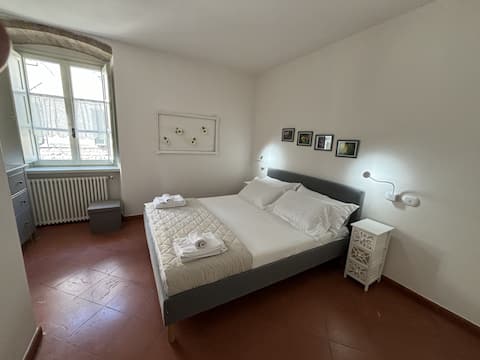
Top Performing Airbnb Properties in Bagno di Romagna (2025)
Benchmark your potential! Explore examples of top-performing Airbnb properties in Bagno di Romagnabased on Trailing Twelve Month (TTM) revenue. Analyze their characteristics, revenue, occupancy rate, and ADR to understand what drives success in this market.
Casa Ridapio: Trail & Relax
Entire Place • 4 bedrooms
Lo Struzzo
Entire Place • 2 bedrooms

AGRITURISMO AL MONTE (DENISE)
Entire Place • N/A
Terrace overlooking the park (La Stalla)
Entire Place • 1 bedroom

Podere Casina 9 - holiday home
Entire Place • 3 bedrooms
villa gesualda
Entire Place • 2 bedrooms
Note: Performance varies based on location, size, amenities, seasonality, and management quality. Data reflects the past 12 months.
Top Performing Airbnb Hosts in Bagno di Romagna (2025)
Learn from the best! This table showcases top-performing Airbnb hosts in Bagno di Romagna based on the number of properties managed and estimated total revenue over the past year. Analyze their scale and performance metrics.
| Host Name | Properties | Grossing Revenue | Stay Reviews | Avg Rating |
|---|---|---|---|---|
| Andrea | 2 | $33,769 | 5 | 4.00/5.0 |
| Mauro | 4 | $28,832 | 39 | 4.94/5.0 |
| Germana | 3 | $22,145 | 62 | 4.86/5.0 |
| Sergio | 1 | $13,148 | 8 | 5.00/5.0 |
| Andrea | 1 | $11,557 | 4 | 5.00/5.0 |
| Claudio | 1 | $9,888 | 1 | Not Rated |
| Paolo | 1 | $8,577 | 10 | 4.80/5.0 |
| Natascia | 1 | $5,542 | 1 | Not Rated |
| Ca Di Veroli | 1 | $4,534 | 2 | Not Rated |
| Lorenzo | 1 | $4,377 | 38 | 4.68/5.0 |
Analyzing the strategies of top hosts, such as their property selection, pricing, and guest communication, can offer valuable lessons for optimizing your own Airbnb operations in Bagno di Romagna.
Dive Deeper: Advanced Bagno di Romagna STR Market Data (2025)
Ready to unlock more insights? AirROI provides access to advanced metrics and comprehensive Airbnb data for Bagno di Romagna. Explore detailed analytics beyond this report to refine your investment strategy, optimize pricing, and maximize your vacation rental profits.
Explore Advanced MetricsBagno di Romagna Short-Term Rental Market Composition (2025): Property & Room Types
Room Type Distribution
Property Type Distribution
Market Composition Insights for Bagno di Romagna
- The Bagno di Romagna Airbnb market composition is heavily skewed towards Entire Home/Apt listings, which make up 88.9% of the 18 active rentals. This indicates strong guest preference for privacy and space.
- Looking at the property type distribution in Bagno di Romagna, House properties are the most common (44.4%), reflecting the local real estate landscape.
- Houses represent a significant 44.4% portion, catering likely to families or larger groups.
- The presence of 11.1% Hotel/Boutique listings indicates integration with traditional hospitality.
Bagno di Romagna Airbnb Room Capacity Analysis (2025): Bedroom Distribution
Distribution of Listings by Number of Bedrooms
Room Capacity Insights for Bagno di Romagna
- The dominant room capacity in Bagno di Romagna is 1 bedroom listings, making up 38.9% of the market. This suggests a strong demand for properties suitable for couples or solo travelers.
- Together, 1 bedroom and 2 bedrooms properties represent 61.1% of the active Airbnb listings in Bagno di Romagna, indicating a high concentration in these sizes.
Bagno di Romagna Vacation Rental Guest Capacity Trends (2025)
Distribution of Listings by Guest Capacity
Guest Capacity Insights for Bagno di Romagna
- The most common guest capacity trend in Bagno di Romagna vacation rentals is listings accommodating 4 guests (33.3%). This suggests the primary traveler segment is likely small families or groups.
- Properties designed for 4 guests and 2 guests dominate the Bagno di Romagna STR market, accounting for 61.1% of listings.
- 22.2% of properties accommodate 6+ guests, serving the market segment for larger families or group travel in Bagno di Romagna.
- On average, properties in Bagno di Romagna are equipped to host 3.7 guests.
Bagno di Romagna Airbnb Booking Patterns (2025): Available vs. Booked Days
Available Days Distribution
Booked Days Distribution
Booking Pattern Insights for Bagno di Romagna
- The most common availability pattern in Bagno di Romagna falls within the 271-366 days range, representing 83.3% of listings. This suggests many properties have significant open periods on their calendars.
- Approximately 100.0% of listings show high availability (181+ days open annually), indicating potential for increased bookings or specific owner usage patterns.
- For booked days, the 31-90 days range is most frequent in Bagno di Romagna (55.6%), reflecting common guest stay durations or potential owner blocking patterns.
Bagno di Romagna Airbnb Minimum Stay Requirements Analysis
Distribution of Listings by Minimum Night Requirement
1 Night
5 listings
27.8% of total
2 Nights
5 listings
27.8% of total
3 Nights
1 listings
5.6% of total
4-6 Nights
1 listings
5.6% of total
7-29 Nights
2 listings
11.1% of total
30+ Nights
4 listings
22.2% of total
Key Insights
- The most prevalent minimum stay requirement in Bagno di Romagna is 1 Night, adopted by 27.8% of listings. This highlights the market's preference for shorter, flexible bookings.
- A significant segment (22.2%) caters to monthly stays (30+ nights) in Bagno di Romagna, pointing to opportunities in the extended-stay market.
Recommendations
- Align with the market by considering a 1 Night minimum stay, as 27.8% of Bagno di Romagna hosts use this setting.
- If feasible, allowing 1-night stays, especially midweek or during low season, could capture last-minute bookings, as only 27.8% currently do.
- Explore offering discounts for stays of 30+ nights to attract the 22.2% of the market seeking extended stays.
- Adjust minimum nights based on seasonality – potentially shorter during low season and longer during peak demand periods in Bagno di Romagna.
Bagno di Romagna Airbnb Cancellation Policy Trends Analysis (2025)
Flexible
6 listings
35.3% of total
Moderate
10 listings
58.8% of total
Strict
1 listings
5.9% of total
Cancellation Policy Insights for Bagno di Romagna
- The prevailing Airbnb cancellation policy trend in Bagno di Romagna is Moderate, used by 58.8% of listings.
- The market strongly favors guest-friendly terms, with 94.1% of listings offering Flexible or Moderate policies. This suggests guests in Bagno di Romagna may expect booking flexibility.
- Strict cancellation policies are quite rare (5.9%), potentially making listings with this policy less competitive unless justified by high demand or property type.
Recommendations for Hosts
- Consider adopting a Moderate policy to align with the 58.8% market standard in Bagno di Romagna.
- Using a Strict policy might deter some guests, as only 5.9% of listings use it. Evaluate if potential revenue protection outweighs possible lower booking rates.
- Regularly review your cancellation policy against competitors and market demand shifts in Bagno di Romagna.
Bagno di Romagna STR Booking Lead Time Analysis (2025)
Average Booking Lead Time by Month
Booking Lead Time Insights for Bagno di Romagna
- The overall average booking lead time for vacation rentals in Bagno di Romagna is 28 days.
- Guests book furthest in advance for stays during April (average 45 days), likely coinciding with peak travel demand or local events.
- The shortest booking windows occur for stays in January (average 14 days), indicating more last-minute travel plans during this time.
- Seasonally, Spring (33 days avg.) sees the longest lead times, while Winter (21 days avg.) has the shortest, reflecting typical travel planning cycles.
Recommendations for Hosts
- Use the overall average lead time (28 days) as a baseline for your pricing and availability strategy in Bagno di Romagna.
- For April stays, consider implementing length-of-stay discounts or slightly higher rates for bookings made less than 45 days out to capitalize on advance planning.
- During January, focus on last-minute booking availability and promotions, as guests book with very short notice (14 days avg.).
- Target marketing efforts for the Spring season well in advance (at least 33 days) to capture early planners.
- Monitor your own booking lead times against these Bagno di Romagna averages to identify opportunities for dynamic pricing adjustments.
Popular & Essential Airbnb Amenities in Bagno di Romagna (2025)
Amenity data is currently unavailable for Bagno di Romagna.
Bagno di Romagna Airbnb Guest Demographics & Profile Analysis (2025)
Guest Profile Summary for Bagno di Romagna
- The typical guest profile for Airbnb in Bagno di Romagna consists of primarily domestic travelers (65%), often arriving from nearby Milan, typically belonging to the Post-2000s (Gen Z/Alpha) group (50%), primarily speaking English or French.
- Domestic travelers account for 65.4% of guests.
- Key international markets include Italy (65.4%) and Switzerland (11.5%).
- Top languages spoken are English (33.3%) followed by French (20.5%).
- A significant demographic segment is the Post-2000s (Gen Z/Alpha) group, representing 50% of guests.
Recommendations for Hosts
- Target domestic marketing efforts towards travelers from Milan and Rome.
- Tailor amenities and listing descriptions to appeal to the dominant Post-2000s (Gen Z/Alpha) demographic (e.g., highlight fast WiFi, smart home features, local guides).
- Highlight unique local experiences or amenities relevant to the primary guest profile.
- Consider seasonal promotions aligned with peak travel times for key origin markets.
Nearby Short-Term Rental Market Comparison
How does the Bagno di Romagna Airbnb market stack up against its neighbors? Compare key performance metrics like average monthly revenue, ADR, and occupancy rates in surrounding areas to understand the broader regional STR landscape.
| Market | Active Properties | Monthly Revenue | Daily Rate | Avg. Occupancy |
|---|---|---|---|---|
| Marciano della Chiana | 17 | $3,452 | $494.16 | 35% |
| Castelfranco di Sotto | 52 | $3,041 | $317.47 | 37% |
| Marcialla | 26 | $2,754 | $241.67 | 52% |
| Florence | 10,275 | $2,680 | $218.14 | 51% |
| Celleno | 16 | $2,640 | $506.41 | 26% |
| Radda in Chianti | 99 | $2,602 | $331.13 | 38% |
| Parrano | 18 | $2,597 | $332.82 | 34% |
| Monte San Savino | 104 | $2,565 | $329.66 | 39% |
| Impruneta | 147 | $2,555 | $268.43 | 40% |
| Buonconvento | 59 | $2,546 | $348.74 | 41% |