Corchiano Airbnb Market Analysis 2026: Short Term Rental Data & Vacation Rental Statistics in Lazio, Italy
Is Airbnb profitable in Corchiano in 2026? Explore comprehensive Airbnb analytics for Corchiano, Lazio, Italy to uncover income potential. This 2026 STR market report for Corchiano, based on AirROI data from February 2025 to January 2026, reveals key trends in the niche market of 20 active listings.
Whether you're considering an Airbnb investment in Corchiano, optimizing your existing vacation rental, or exploring rental arbitrage opportunities, understanding the Corchiano Airbnb data is crucial. Navigating the high regulation landscape is key to maximizing your short term rental income potential. Let's dive into the specifics.
Key Corchiano Airbnb Performance Metrics Overview
Monthly Airbnb Revenue Variations & Income Potential in Corchiano (2026)
Understanding the monthly revenue variations for Airbnb listings in Corchiano is key to maximizing your short term rental income potential. Seasonality significantly impacts earnings. Our analysis, based on data from the past 12 months, shows that the peak revenue month for STRs in Corchiano is typically August, while February often presents the lowest earnings, highlighting opportunities for strategic pricing adjustments during shoulder and low seasons. Explore the typical Airbnb income in Corchiano across different performance tiers:
- Best-in-class properties (Top 10%) achieve $5,575+ monthly, often utilizing dynamic pricing and superior guest experiences.
- Strong performing properties (Top 25%) earn $1,700 or more, indicating effective management and desirable locations/amenities.
- Typical properties (Median) generate around $962 per month, representing the average market performance.
- Entry-level properties (Bottom 25%) see earnings around $464, often with potential for optimization.
Average Monthly Airbnb Earnings Trend in Corchiano
Corchiano Airbnb Occupancy Rate Trends (2026)
Maximize your bookings by understanding the Corchiano STR occupancy trends. Seasonal demand shifts significantly influence how often properties are booked. Typically, Marchsees the highest demand (peak season occupancy), while January experiences the lowest (low season). Effective strategies, like adjusting minimum stays or offering promotions, can boost occupancy during slower periods. Here's how different property tiers perform in Corchiano:
- Best-in-class properties (Top 10%) achieve 62%+ occupancy, indicating high desirability and potentially optimized availability.
- Strong performing properties (Top 25%) maintain 43% or higher occupancy, suggesting good market fit and guest satisfaction.
- Typical properties (Median) have an occupancy rate around 23%.
- Entry-level properties (Bottom 25%) average 13% occupancy, potentially facing higher vacancy.
Average Monthly Occupancy Rate Trend in Corchiano
Average Daily Rate (ADR) Airbnb Trends in Corchiano (2026)
Effective short term rental pricing strategy in Corchiano involves understanding monthly ADR fluctuations. The Average Daily Rate (ADR) for Airbnb in Corchiano typically peaks in July and dips lowest during December. Leveraging Airbnb dynamic pricing tools or strategies based on this seasonality can significantly boost revenue. Here's a look at the typical nightly rates achieved:
- Best-in-class properties (Top 10%) command rates of $485+ per night, often due to premium features or locations.
- Strong performing properties (Top 25%) achieve nightly rates of $360 or more.
- Typical properties (Median) charge around $168 per night.
- Entry-level properties (Bottom 25%) earn around $86 per night.
Average Daily Rate (ADR) Trend by Month in Corchiano
Get Live Corchiano Market Intelligence 👇
Explore Real-time Analytics
Airbnb Seasonality Analysis & Trends in Corchiano (2026)
Peak Season (August, September, July)
- Revenue averages $3,286 per month
- Occupancy rates average 36.1%
- Daily rates average $265
Shoulder Season
- Revenue averages $1,505 per month
- Occupancy maintains around 31.3%
- Daily rates hold near $258
Low Season (January, February, October)
- Revenue drops to average $769 per month
- Occupancy decreases to average 19.8%
- Daily rates adjust to average $255
Seasonality Insights for Corchiano
- The Airbnb seasonality in Corchiano shows highly seasonal trends requiring careful strategy. While the sections above show seasonal averages, it's also insightful to look at the extremes:
- During the high season, the absolute peak month showcases Corchiano's highest earning potential, with monthly revenues capable of climbing to $3,864, occupancy reaching a high of 48.4%, and ADRs peaking at $267.
- Conversely, the slowest single month of the year, typically falling within the low season, marks the market's lowest point. In this month, revenue might dip to $437, occupancy could drop to 13.2%, and ADRs may adjust down to $250.
- Understanding both the seasonal averages and these monthly peaks and troughs in revenue, occupancy, and ADR is crucial for maximizing your Airbnb profit potential in Corchiano.
Seasonal Strategies for Maximizing Profit
- Peak Season: Maximize revenue through premium pricing and potentially longer minimum stays. Ensure high availability.
- Low Season: Offer competitive pricing, special promotions (e.g., extended stay discounts), and flexible cancellation policies. Target off-season travelers like remote workers or budget-conscious guests.
- Shoulder Seasons: Implement dynamic pricing that balances peak and low rates. Target weekend travelers or specific events. Offer slightly more flexible terms than peak season.
- Regularly analyze your own performance against these Corchiano seasonality benchmarks and adjust your pricing and availability strategy accordingly.
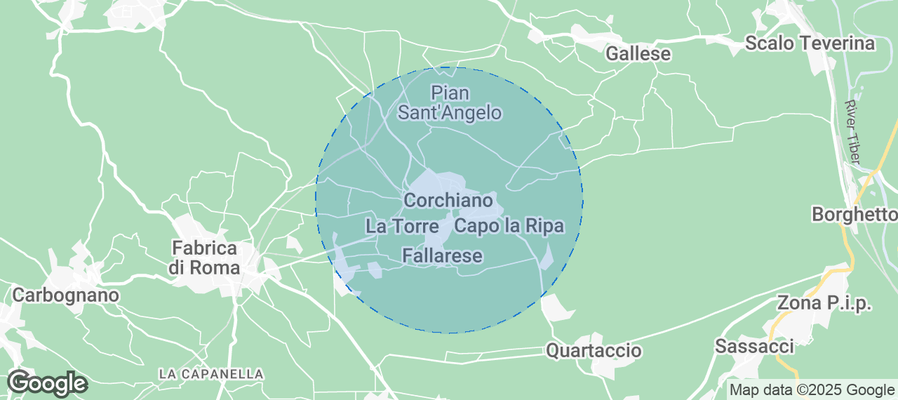
Best Areas for Airbnb Investment in Corchiano (2026)
Exploring the top neighborhoods for short-term rentals in Corchiano? This section highlights key areas, outlining why they are attractive for hosts and guests, along with notable local attractions. Consider these locations based on your target guest profile and investment strategy.
| Neighborhood / Area | Why Host Here? (Target Guests & Appeal) | Key Attractions & Landmarks |
|---|---|---|
| Centro Storico | The historical center of Corchiano, known for its charming medieval architecture and picturesque streets. A prime location for tourists who want to experience the rich history and culture of the area. | Piazza della Repubblica, Chiesa di San Michele Arcangelo, Castello di Corchiano, Parco della Resistenza |
| Parco Fluviale del Tevere | A beautiful natural park area along the Tiber River, perfect for nature-loving tourists. Offers scenic views, walking trails, and outdoor activities. | Tiber River, Nature trails, Picnic areas, Wildlife watching |
| Vigna di Valle | A tranquil neighborhood known for its vineyards and agricultural landscape. Attracts visitors who enjoy wine tasting and rural tourism. | Vineyards, Winery tours, Agritourism experiences |
| Faggeta di Civitella | A UNESCO World Heritage Site offering stunning natural beauty and hiking opportunities. Ideal for eco-tourism enthusiasts. | Faggeta Forest, Hiking trails, Natural scenery |
| Cascata di Civita | A stunning waterfall and natural site nearby, attracting nature lovers and adventure seekers. A great day trip for visitors staying in Corchiano. | Cascata di Civita, Nature hikes, Photography spots |
| Museo Archeologico | An archaeological museum showcasing the history of the region, attracting history buffs and cultural tourists. | Archaeological exhibits, Educational tours, Cultural events |
| Local Markets | Vibrant local markets offering fresh produce and local products. Perfect for travelers wanting to experience the local lifestyle. | Weekly farmers' markets, Local crafts, Gastronomic delights |
| Outdoor Recreational Areas | Several parks and recreational areas offer activities like cycling and jogging, appealing to both tourists and locals. | Ciclo-pedestrian paths, Outdoor sports fields, Playgrounds |
Understanding Airbnb License Requirements & STR Laws in Corchiano (2026)
Yes, Corchiano, Lazio, Italy enforces high STR regulations. Obtaining a license and ensuring compliance is almost certainly required according to current 2026 STR laws. Always verify the latest short term rental regulations and Airbnb license requirements directly with local government authorities for Corchiano to ensure full compliance before hosting.
(Source: AirROI data, 2026, based on 95% licensed listings)
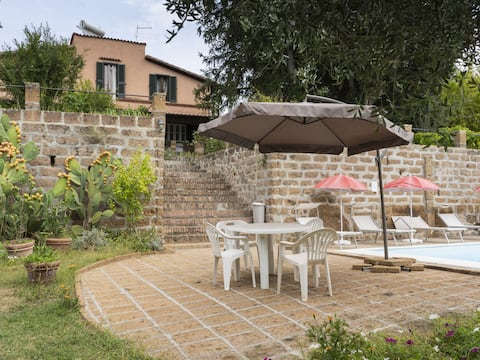
Top Performing Airbnb Properties in Corchiano (2026)
Benchmark your potential! Explore examples of top-performing Airbnb properties in Corchianobased on Trailing Twelve Month (TTM) revenue. Analyze their characteristics, revenue, occupancy rate, and ADR to understand what drives success in this market.

Oasis of peace in the countryside
Entire Place • 8 bedrooms

Casale Dell'Oasi 12, Emma, Villas
Entire Place • 6 bedrooms
Farmhouse Ai Noccioli (LVC165) by Interhome
Entire Place • 8 bedrooms

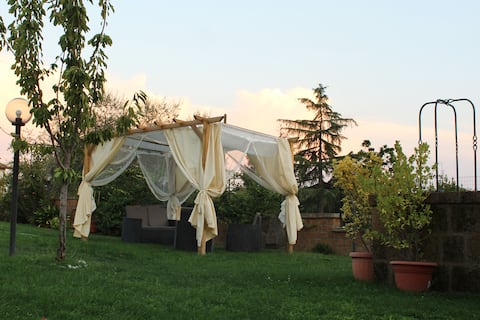
Villa Iris
Entire Place • 6 bedrooms
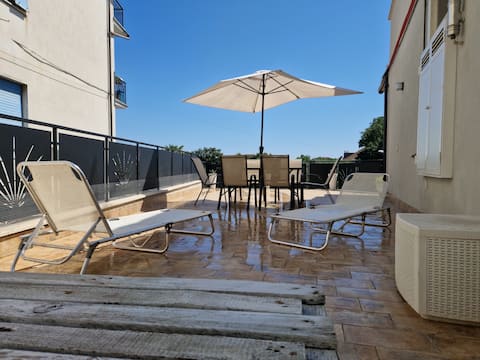
Susy's Home Downtown apartment
Entire Place • 2 bedrooms
Loft with private SPA for a Romantic Weekend.
Entire Place • 1 bedroom
Note: Performance varies based on location, size, amenities, seasonality, and management quality. Data reflects the past 12 months.
Top Performing Airbnb Hosts in Corchiano (2026)
Learn from the best! This table showcases top-performing Airbnb hosts in Corchiano based on the number of properties managed and estimated total revenue over the past year. Analyze their scale and performance metrics.
| Host Name | Properties | Grossing Revenue | Stay Reviews | Avg Rating |
|---|---|---|---|---|
| Sovie | 3 | $63,843 | 4 | Not Rated |
| Emma | 1 | $42,712 | 1 | Not Rated |
| Lisa - Interhome | 3 | $39,594 | 13 | 4.63/5.0 |
| Romina | 2 | $27,901 | 269 | 4.98/5.0 |
| Lucrezia | 1 | $25,322 | 1 | Not Rated |
| Casa Lale | 3 | $24,707 | 170 | 4.81/5.0 |
| Susanna | 1 | $20,423 | 23 | 4.91/5.0 |
| Maurizio E Valter | 2 | $14,071 | 29 | 5.00/5.0 |
| Laura | 1 | $7,136 | 7 | 4.86/5.0 |
| Claudio | 1 | $4,147 | 50 | 4.78/5.0 |
Analyzing the strategies of top hosts, such as their property selection, pricing, and guest communication, can offer valuable lessons for optimizing your own Airbnb operations in Corchiano.
Dive Deeper: Advanced Corchiano STR Market Data (2026)
Ready to unlock more insights? AirROI provides access to advanced metrics and comprehensive Airbnb data for Corchiano. Explore detailed analytics beyond this report to refine your investment strategy, optimize pricing, and maximize your vacation rental profits.
Explore Advanced MetricsCorchiano Short-Term Rental Market Composition (2026): Property & Room Types
Room Type Distribution
Property Type Distribution
Market Composition Insights for Corchiano
- The Corchiano Airbnb market composition is heavily skewed towards Entire Home/Apt listings, which make up 95% of the 20 active rentals. This indicates strong guest preference for privacy and space.
- Looking at the property type distribution in Corchiano, House properties are the most common (70%), reflecting the local real estate landscape.
- Houses represent a significant 70% portion, catering likely to families or larger groups.
Corchiano Airbnb Room Capacity Analysis (2026): Bedroom Distribution
Distribution of Listings by Number of Bedrooms
Room Capacity Insights for Corchiano
- The dominant room capacity in Corchiano is 2 bedrooms listings, making up 30% of the market. This suggests a strong demand for properties suitable for couples or solo travelers.
- Together, 2 bedrooms and 5+ bedrooms properties represent 60.0% of the active Airbnb listings in Corchiano, indicating a high concentration in these sizes.
- A significant 50.0% of listings offer 3+ bedrooms, catering to larger groups and families seeking more space in Corchiano.
Corchiano Vacation Rental Guest Capacity Trends (2026)
Distribution of Listings by Guest Capacity
Guest Capacity Insights for Corchiano
- The most common guest capacity trend in Corchiano vacation rentals is listings accommodating 8+ guests (50%). This suggests the primary traveler segment is likely larger groups.
- Properties designed for 8+ guests and 6 guests dominate the Corchiano STR market, accounting for 65.0% of listings.
- 65.0% of properties accommodate 6+ guests, serving the market segment for larger families or group travel in Corchiano.
- On average, properties in Corchiano are equipped to host 5.9 guests.
Corchiano Airbnb Booking Patterns (2026): Available vs. Booked Days
Available Days Distribution
Booked Days Distribution
Booking Pattern Insights for Corchiano
- The most common availability pattern in Corchiano falls within the 271-366 days range, representing 80% of listings. This suggests many properties have significant open periods on their calendars.
- Approximately 95.0% of listings show high availability (181+ days open annually), indicating potential for increased bookings or specific owner usage patterns.
- For booked days, the 31-90 days range is most frequent in Corchiano (55%), reflecting common guest stay durations or potential owner blocking patterns.
- A notable 5.0% of properties secure long booking periods (181+ days booked per year), highlighting successful long-term rental strategies or significant owner usage.
Corchiano Airbnb Minimum Stay Requirements Analysis
Distribution of Listings by Minimum Night Requirement
1 Night
7 listings
35% of total
2 Nights
3 listings
15% of total
3 Nights
1 listings
5% of total
4-6 Nights
1 listings
5% of total
7-29 Nights
3 listings
15% of total
30+ Nights
5 listings
25% of total
Key Insights
- The most prevalent minimum stay requirement in Corchiano is 1 Night, adopted by 35% of listings. This highlights the market's preference for shorter, flexible bookings.
- A significant segment (25%) caters to monthly stays (30+ nights) in Corchiano, pointing to opportunities in the extended-stay market.
Recommendations
- Align with the market by considering a 1 Night minimum stay, as 35% of Corchiano hosts use this setting.
- Explore offering discounts for stays of 30+ nights to attract the 25% of the market seeking extended stays.
- Adjust minimum nights based on seasonality – potentially shorter during low season and longer during peak demand periods in Corchiano.
Corchiano Airbnb Cancellation Policy Trends Analysis (2026)
Super Strict 30 Days
1 listings
5% of total
Super Strict 60 Days
1 listings
5% of total
Flexible
5 listings
25% of total
Moderate
9 listings
45% of total
Firm
4 listings
20% of total
Cancellation Policy Insights for Corchiano
- The prevailing Airbnb cancellation policy trend in Corchiano is Moderate, used by 45% of listings.
- There's a relatively balanced mix between guest-friendly (70.0%) and stricter (20.0%) policies, offering choices for different guest needs.
Recommendations for Hosts
- Consider adopting a Moderate policy to align with the 45% market standard in Corchiano.
- Regularly review your cancellation policy against competitors and market demand shifts in Corchiano.
Corchiano STR Booking Lead Time Analysis (2026)
Average Booking Lead Time by Month
Booking Lead Time Insights for Corchiano
- The overall average booking lead time for vacation rentals in Corchiano is 33 days.
- Guests book furthest in advance for stays during March (average 61 days), likely coinciding with peak travel demand or local events.
- The shortest booking windows occur for stays in February (average 10 days), indicating more last-minute travel plans during this time.
- Seasonally, Spring (36 days avg.) sees the longest lead times, while Winter (15 days avg.) has the shortest, reflecting typical travel planning cycles.
Recommendations for Hosts
- Use the overall average lead time (33 days) as a baseline for your pricing and availability strategy in Corchiano.
- For March stays, consider implementing length-of-stay discounts or slightly higher rates for bookings made less than 61 days out to capitalize on advance planning.
- During February, focus on last-minute booking availability and promotions, as guests book with very short notice (10 days avg.).
- Target marketing efforts for the Spring season well in advance (at least 36 days) to capture early planners.
- Monitor your own booking lead times against these Corchiano averages to identify opportunities for dynamic pricing adjustments.
Popular & Essential Airbnb Amenities in Corchiano (2026)
Amenity Prevalence
Amenity Insights for Corchiano
- Essential amenities in Corchiano that guests expect include: Wifi, TV, Hangers. Lacking these (any) could significantly impact bookings.
- Popular amenities like Kitchen, Refrigerator, Bed linens are common but not universal. Offering these can provide a competitive edge.
Recommendations for Hosts
- Ensure your listing includes all essential amenities for Corchiano: Wifi, TV, Hangers.
- Prioritize adding missing essentials: Hangers.
- Consider adding popular differentiators like Kitchen or Refrigerator to increase appeal.
- Highlight unique or less common amenities you offer (e.g., hot tub, dedicated workspace, EV charger) in your listing description and photos.
- Regularly check competitor amenities in Corchiano to stay competitive.
Corchiano Airbnb Guest Demographics & Profile Analysis (2026)
Guest Profile Summary for Corchiano
- The typical guest profile for Airbnb in Corchiano consists of a mix of domestic (42%) and international guests, with top international origins including United Kingdom, typically belonging to the Post-2000s (Gen Z/Alpha) group (50%), primarily speaking English or French.
- Domestic travelers account for 41.9% of guests.
- Key international markets include Italy (41.9%) and United Kingdom (9.7%).
- Top languages spoken are English (32.8%) followed by French (17.2%).
- A significant demographic segment is the Post-2000s (Gen Z/Alpha) group, representing 50% of guests.
Recommendations for Hosts
- Balance marketing efforts between domestic and international channels based on the guest mix.
- Tailor amenities and listing descriptions to appeal to the dominant Post-2000s (Gen Z/Alpha) demographic (e.g., highlight fast WiFi, smart home features, local guides).
- Highlight unique local experiences or amenities relevant to the primary guest profile.
- Consider seasonal promotions aligned with peak travel times for key origin markets.
Nearby Short-Term Rental Market Comparison
How does the Corchiano Airbnb market stack up against its neighbors? Compare key performance metrics like average monthly revenue, ADR, and occupancy rates in surrounding areas to understand the broader regional STR landscape.
| Market | Active Properties | Monthly Revenue | Daily Rate | Avg. Occupancy |
|---|---|---|---|---|
| Tignano | 12 | $4,160 | $366.92 | 45% |
| Celleno | 13 | $4,041 | $594.80 | 28% |
| Marciano della Chiana | 17 | $3,823 | $545.25 | 35% |
| Buonconvento | 60 | $3,186 | $440.58 | 43% |
| Collevecchio | 14 | $3,140 | $334.97 | 40% |
| Radda in Chianti | 94 | $3,098 | $361.57 | 39% |
| Palombara Sabina | 15 | $2,914 | $309.11 | 38% |
| Impruneta | 146 | $2,887 | $297.45 | 40% |
| Rome | 26,470 | $2,817 | $217.07 | 50% |
| Lastra a Signa | 96 | $2,760 | $311.91 | 43% |