Genzano di Roma Airbnb Market Analysis 2026: Short Term Rental Data & Vacation Rental Statistics in Lazio, Italy
Is Airbnb profitable in Genzano di Roma in 2026? Explore comprehensive Airbnb analytics for Genzano di Roma, Lazio, Italy to uncover income potential. This 2026 STR market report for Genzano di Roma, based on AirROI data from February 2025 to January 2026, reveals key trends in the niche market of 30 active listings.
Whether you're considering an Airbnb investment in Genzano di Roma, optimizing your existing vacation rental, or exploring rental arbitrage opportunities, understanding the Genzano di Roma Airbnb data is crucial. Navigating the high regulation landscape is key to maximizing your short term rental income potential. Let's dive into the specifics.
Key Genzano di Roma Airbnb Performance Metrics Overview
Monthly Airbnb Revenue Variations & Income Potential in Genzano di Roma (2026)
Understanding the monthly revenue variations for Airbnb listings in Genzano di Roma is key to maximizing your short term rental income potential. Seasonality significantly impacts earnings. Our analysis, based on data from the past 12 months, shows that the peak revenue month for STRs in Genzano di Roma is typically August, while January often presents the lowest earnings, highlighting opportunities for strategic pricing adjustments during shoulder and low seasons. Explore the typical Airbnb income in Genzano di Roma across different performance tiers:
- Best-in-class properties (Top 10%) achieve $3,843+ monthly, often utilizing dynamic pricing and superior guest experiences.
- Strong performing properties (Top 25%) earn $1,758 or more, indicating effective management and desirable locations/amenities.
- Typical properties (Median) generate around $960 per month, representing the average market performance.
- Entry-level properties (Bottom 25%) see earnings around $507, often with potential for optimization.
Average Monthly Airbnb Earnings Trend in Genzano di Roma
Genzano di Roma Airbnb Occupancy Rate Trends (2026)
Maximize your bookings by understanding the Genzano di Roma STR occupancy trends. Seasonal demand shifts significantly influence how often properties are booked. Typically, Augustsees the highest demand (peak season occupancy), while January experiences the lowest (low season). Effective strategies, like adjusting minimum stays or offering promotions, can boost occupancy during slower periods. Here's how different property tiers perform in Genzano di Roma:
- Best-in-class properties (Top 10%) achieve 76%+ occupancy, indicating high desirability and potentially optimized availability.
- Strong performing properties (Top 25%) maintain 58% or higher occupancy, suggesting good market fit and guest satisfaction.
- Typical properties (Median) have an occupancy rate around 38%.
- Entry-level properties (Bottom 25%) average 21% occupancy, potentially facing higher vacancy.
Average Monthly Occupancy Rate Trend in Genzano di Roma
Average Daily Rate (ADR) Airbnb Trends in Genzano di Roma (2026)
Effective short term rental pricing strategy in Genzano di Roma involves understanding monthly ADR fluctuations. The Average Daily Rate (ADR) for Airbnb in Genzano di Roma typically peaks in December and dips lowest during February. Leveraging Airbnb dynamic pricing tools or strategies based on this seasonality can significantly boost revenue. Here's a look at the typical nightly rates achieved:
- Best-in-class properties (Top 10%) command rates of $283+ per night, often due to premium features or locations.
- Strong performing properties (Top 25%) achieve nightly rates of $114 or more.
- Typical properties (Median) charge around $89 per night.
- Entry-level properties (Bottom 25%) earn around $69 per night.
Average Daily Rate (ADR) Trend by Month in Genzano di Roma
Get Live Genzano di Roma Market Intelligence 👇

Explore Real-time Analytics
Airbnb Seasonality Analysis & Trends in Genzano di Roma (2026)
Peak Season (August, July, June)
- Revenue averages $2,318 per month
- Occupancy rates average 48.9%
- Daily rates average $131
Shoulder Season
- Revenue averages $1,566 per month
- Occupancy maintains around 40.0%
- Daily rates hold near $130
Low Season (January, February, November)
- Revenue drops to average $1,053 per month
- Occupancy decreases to average 31.6%
- Daily rates adjust to average $130
Seasonality Insights for Genzano di Roma
- The Airbnb seasonality in Genzano di Roma shows highly seasonal trends requiring careful strategy. While the sections above show seasonal averages, it's also insightful to look at the extremes:
- During the high season, the absolute peak month showcases Genzano di Roma's highest earning potential, with monthly revenues capable of climbing to $2,752, occupancy reaching a high of 52.8%, and ADRs peaking at $142.
- Conversely, the slowest single month of the year, typically falling within the low season, marks the market's lowest point. In this month, revenue might dip to $855, occupancy could drop to 22.9%, and ADRs may adjust down to $119.
- Understanding both the seasonal averages and these monthly peaks and troughs in revenue, occupancy, and ADR is crucial for maximizing your Airbnb profit potential in Genzano di Roma.
Seasonal Strategies for Maximizing Profit
- Peak Season: Maximize revenue through premium pricing and potentially longer minimum stays. Ensure high availability.
- Low Season: Offer competitive pricing, special promotions (e.g., extended stay discounts), and flexible cancellation policies. Target off-season travelers like remote workers or budget-conscious guests.
- Shoulder Seasons: Implement dynamic pricing that balances peak and low rates. Target weekend travelers or specific events. Offer slightly more flexible terms than peak season.
- Regularly analyze your own performance against these Genzano di Roma seasonality benchmarks and adjust your pricing and availability strategy accordingly.
Best Areas for Airbnb Investment in Genzano di Roma (2026)
Exploring the top neighborhoods for short-term rentals in Genzano di Roma? This section highlights key areas, outlining why they are attractive for hosts and guests, along with notable local attractions. Consider these locations based on your target guest profile and investment strategy.
| Neighborhood / Area | Why Host Here? (Target Guests & Appeal) | Key Attractions & Landmarks |
|---|---|---|
| Centro Storico | The historical center of Genzano di Roma, known for its charming cobblestone streets, traditional architecture, and local eateries. A prime area for tourists who want to experience the local culture and history. | Church of Santa Maria della Civitella, Palazzo Comunale, Genzano di Roma Market, Castello Sforza-Cesarini, Villa Sforza-Cesarini |
| Castelli Romani | A group of picturesque hill towns surrounding Lake Albano, popular for their scenic beauty and outdoor activities. Attracts locals and tourists looking for a peaceful retreat from Rome. | Lake Albano, Frascati, Nemi, The Alban Hills, Villa Aldobrandini |
| Parco Regionale dei Castelli Romani | A beautiful regional park offering hiking trails, lake views, and cultural sites. Ideal for nature lovers and outdoor enthusiasts, making it a great place for Airbnb hosting. | Hiking trails, Borgo di Nemi, Natural beauty, Vineyards, Ancient ruins |
| Via Appia Antica | Part of the ancient Appian Way, this area is rich in history and archaeological sites. Attracts tourists interested in history and classical Rome. | Tombs of the Appian Way, Catacombs of St. Callixtus, Villa dei Quintili, Historical monuments |
| Local Eating Experiences | Genzano is renowned for its traditional cuisine, including the famous Genzano bread. Tourists seek authentic culinary experiences, making this a unique hosting opportunity. | Local bakeries, Trattorie and Osterie, Food festivals, Cooking classes |
| Events and Festivals | Genzano hosts various local festivals, including the Flower Festival. These events draw visitors, making it ideal for short-term rentals during peak festival times. | Infiorata di Genzano, Sagra del Vino, Cultural events, Artisan markets |
| Lakeside Views | Areas near Lake Nemi and Lake Albano offer stunning views and relaxation spots, appealing to tourists looking for leisure activities and beautiful scenery. | Scenic lakes, Water sports, Fishing spots, Picnic areas |
| Cultural Heritage | Rich in cultural heritage with numerous churches, historic sites, and artistic events. Attracts visitors interested in cultural tourism and local traditions. | Museo di Genzano, Historic churches, Art galleries, Community events |
Understanding Airbnb License Requirements & STR Laws in Genzano di Roma (2026)
Yes, Genzano di Roma, Lazio, Italy enforces high STR regulations. Obtaining a license and ensuring compliance is almost certainly required according to current 2026 STR laws. Always verify the latest short term rental regulations and Airbnb license requirements directly with local government authorities for Genzano di Roma to ensure full compliance before hosting.
(Source: AirROI data, 2026, based on 90% licensed listings)
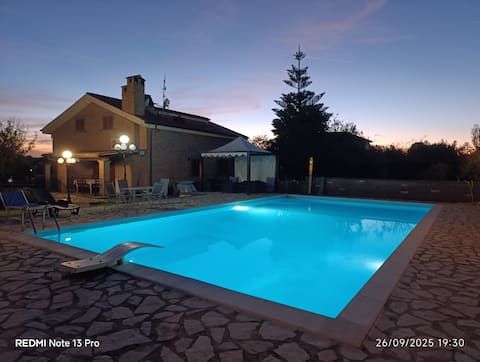
Top Performing Airbnb Properties in Genzano di Roma (2026)
Benchmark your potential! Explore examples of top-performing Airbnb properties in Genzano di Romabased on Trailing Twelve Month (TTM) revenue. Analyze their characteristics, revenue, occupancy rate, and ADR to understand what drives success in this market.

Villa Tiberio 6+2, Emma Villas
Entire Place • 3 bedrooms
Villa Anna
Entire Place • 4 bedrooms

A MAGICAL FARMHOUSE NEAR ROME AND THE SEA!
Entire Place • 4 bedrooms

Tina’s house
Entire Place • 2 bedrooms

Room24 Relax & Wellness
Private Room • 1 bedroom

Enchantment on the lake
Entire Place • 2 bedrooms
Note: Performance varies based on location, size, amenities, seasonality, and management quality. Data reflects the past 12 months.
Top Performing Airbnb Hosts in Genzano di Roma (2026)
Learn from the best! This table showcases top-performing Airbnb hosts in Genzano di Roma based on the number of properties managed and estimated total revenue over the past year. Analyze their scale and performance metrics.
| Host Name | Properties | Grossing Revenue | Stay Reviews | Avg Rating |
|---|---|---|---|---|
| Giammarco Bisogno | 1 | $78,508 | 2 | Not Rated |
| Paolo | 1 | $75,309 | 53 | 4.89/5.0 |
| Patrizia | 1 | $57,188 | 72 | 4.96/5.0 |
| Paolo | 3 | $32,568 | 143 | 4.93/5.0 |
| Martina | 1 | $24,319 | 36 | 4.78/5.0 |
| Roberta | 1 | $23,901 | 50 | 4.98/5.0 |
| Enole | 2 | $22,764 | 127 | 4.79/5.0 |
| Silvia | 1 | $16,104 | 20 | 5.00/5.0 |
| Cristiano | 1 | $15,352 | 89 | 4.71/5.0 |
| Nina | 1 | $13,018 | 11 | 4.64/5.0 |
Analyzing the strategies of top hosts, such as their property selection, pricing, and guest communication, can offer valuable lessons for optimizing your own Airbnb operations in Genzano di Roma.
Dive Deeper: Advanced Genzano di Roma STR Market Data (2026)
Ready to unlock more insights? AirROI provides access to advanced metrics and comprehensive Airbnb data for Genzano di Roma. Explore detailed analytics beyond this report to refine your investment strategy, optimize pricing, and maximize your vacation rental profits.
Explore Advanced MetricsGenzano di Roma Short-Term Rental Market Composition (2026): Property & Room Types
Room Type Distribution
Property Type Distribution
Market Composition Insights for Genzano di Roma
- The Genzano di Roma Airbnb market composition is heavily skewed towards Entire Home/Apt listings, which make up 86.7% of the 30 active rentals. This indicates strong guest preference for privacy and space.
- Looking at the property type distribution in Genzano di Roma, Apartment/Condo properties are the most common (70%), reflecting the local real estate landscape.
- Houses represent a significant 20% portion, catering likely to families or larger groups.
- Smaller segments like hotel/boutique (combined 3.3%) offer potential for unique stay experiences.
Genzano di Roma Airbnb Room Capacity Analysis (2026): Bedroom Distribution
Distribution of Listings by Number of Bedrooms
Room Capacity Insights for Genzano di Roma
- The dominant room capacity in Genzano di Roma is 1 bedroom listings, making up 53.3% of the market. This suggests a strong demand for properties suitable for couples or solo travelers.
- Together, 1 bedroom and 2 bedrooms properties represent 73.3% of the active Airbnb listings in Genzano di Roma, indicating a high concentration in these sizes.
- With over half the market (53.3%) consisting of studios or 1-bedroom units, Genzano di Roma is particularly well-suited for individuals or couples.
Genzano di Roma Vacation Rental Guest Capacity Trends (2026)
Distribution of Listings by Guest Capacity
Guest Capacity Insights for Genzano di Roma
- The most common guest capacity trend in Genzano di Roma vacation rentals is listings accommodating 2 guests (33.3%). This suggests the primary traveler segment is likely couples or solo travelers.
- Properties designed for 2 guests and 4 guests dominate the Genzano di Roma STR market, accounting for 56.6% of listings.
- 23.3% of properties accommodate 6+ guests, serving the market segment for larger families or group travel in Genzano di Roma.
- On average, properties in Genzano di Roma are equipped to host 3.6 guests.
Genzano di Roma Airbnb Booking Patterns (2026): Available vs. Booked Days
Available Days Distribution
Booked Days Distribution
Booking Pattern Insights for Genzano di Roma
- The most common availability pattern in Genzano di Roma falls within the 271-366 days range, representing 43.3% of listings. This suggests many properties have significant open periods on their calendars.
- Approximately 86.6% of listings show high availability (181+ days open annually), indicating potential for increased bookings or specific owner usage patterns.
- For booked days, the 91-180 days range is most frequent in Genzano di Roma (43.3%), reflecting common guest stay durations or potential owner blocking patterns.
- A notable 13.3% of properties secure long booking periods (181+ days booked per year), highlighting successful long-term rental strategies or significant owner usage.
Genzano di Roma Airbnb Minimum Stay Requirements Analysis
Distribution of Listings by Minimum Night Requirement
1 Night
14 listings
46.7% of total
2 Nights
7 listings
23.3% of total
7-29 Nights
3 listings
10% of total
30+ Nights
6 listings
20% of total
Key Insights
- The most prevalent minimum stay requirement in Genzano di Roma is 1 Night, adopted by 46.7% of listings. This highlights the market's preference for shorter, flexible bookings.
- A strong majority (70.0%) of the Genzano di Roma Airbnb data shows acceptance of very short stays (1-2 nights), indicating a dynamic, high-turnover market.
- A significant segment (20%) caters to monthly stays (30+ nights) in Genzano di Roma, pointing to opportunities in the extended-stay market.
Recommendations
- Align with the market by considering a 1 Night minimum stay, as 46.7% of Genzano di Roma hosts use this setting.
- Explore offering discounts for stays of 30+ nights to attract the 20% of the market seeking extended stays.
- Adjust minimum nights based on seasonality – potentially shorter during low season and longer during peak demand periods in Genzano di Roma.
Genzano di Roma Airbnb Cancellation Policy Trends Analysis (2026)
Limited
3 listings
10% of total
Flexible
11 listings
36.7% of total
Moderate
11 listings
36.7% of total
Firm
5 listings
16.7% of total
Cancellation Policy Insights for Genzano di Roma
- The prevailing Airbnb cancellation policy trend in Genzano di Roma is Flexible, used by 36.7% of listings.
- The market strongly favors guest-friendly terms, with 73.4% of listings offering Flexible or Moderate policies. This suggests guests in Genzano di Roma may expect booking flexibility.
Recommendations for Hosts
- Consider adopting a Flexible policy to align with the 36.7% market standard in Genzano di Roma.
- Regularly review your cancellation policy against competitors and market demand shifts in Genzano di Roma.
Genzano di Roma STR Booking Lead Time Analysis (2026)
Average Booking Lead Time by Month
Booking Lead Time Insights for Genzano di Roma
- The overall average booking lead time for vacation rentals in Genzano di Roma is 45 days.
- Guests book furthest in advance for stays during August (average 76 days), likely coinciding with peak travel demand or local events.
- The shortest booking windows occur for stays in November (average 26 days), indicating more last-minute travel plans during this time.
- Seasonally, Summer (56 days avg.) sees the longest lead times, while Winter (35 days avg.) has the shortest, reflecting typical travel planning cycles.
Recommendations for Hosts
- Use the overall average lead time (45 days) as a baseline for your pricing and availability strategy in Genzano di Roma.
- For August stays, consider implementing length-of-stay discounts or slightly higher rates for bookings made less than 76 days out to capitalize on advance planning.
- Target marketing efforts for the Summer season well in advance (at least 56 days) to capture early planners.
- Monitor your own booking lead times against these Genzano di Roma averages to identify opportunities for dynamic pricing adjustments.
Popular & Essential Airbnb Amenities in Genzano di Roma (2026)
Amenity Prevalence
Amenity Insights for Genzano di Roma
- Essential amenities in Genzano di Roma that guests expect include: Wifi, Hair dryer. Lacking these (any) could significantly impact bookings.
- Popular amenities like TV, Hot water, Refrigerator are common but not universal. Offering these can provide a competitive edge.
Recommendations for Hosts
- Ensure your listing includes all essential amenities for Genzano di Roma: Wifi, Hair dryer.
- Prioritize adding missing essentials: Wifi, Hair dryer.
- Consider adding popular differentiators like TV or Hot water to increase appeal.
- Highlight unique or less common amenities you offer (e.g., hot tub, dedicated workspace, EV charger) in your listing description and photos.
- Regularly check competitor amenities in Genzano di Roma to stay competitive.
Genzano di Roma Airbnb Guest Demographics & Profile Analysis (2026)
Guest Profile Summary for Genzano di Roma
- The typical guest profile for Airbnb in Genzano di Roma consists of a mix of domestic (37%) and international guests, with top international origins including France, typically belonging to the Post-2000s (Gen Z/Alpha) group (50%), primarily speaking English or Italian.
- Domestic travelers account for 36.5% of guests.
- Key international markets include Italy (36.5%) and France (11.3%).
- Top languages spoken are English (35.1%) followed by Italian (21.2%).
- A significant demographic segment is the Post-2000s (Gen Z/Alpha) group, representing 50% of guests.
Recommendations for Hosts
- Focus marketing internationally, particularly towards travelers from France.
- Tailor amenities and listing descriptions to appeal to the dominant Post-2000s (Gen Z/Alpha) demographic (e.g., highlight fast WiFi, smart home features, local guides).
- Highlight unique local experiences or amenities relevant to the primary guest profile.
- Consider seasonal promotions aligned with peak travel times for key origin markets.
Nearby Short-Term Rental Market Comparison
How does the Genzano di Roma Airbnb market stack up against its neighbors? Compare key performance metrics like average monthly revenue, ADR, and occupancy rates in surrounding areas to understand the broader regional STR landscape.
| Market | Active Properties | Monthly Revenue | Daily Rate | Avg. Occupancy |
|---|---|---|---|---|
| Celleno | 13 | $4,041 | $594.80 | 28% |
| Collevecchio | 14 | $3,140 | $334.97 | 40% |
| Palombara Sabina | 15 | $2,914 | $309.11 | 38% |
| Rome | 26,470 | $2,817 | $217.07 | 50% |
| Guardea | 14 | $2,703 | $415.58 | 33% |
| Allerona | 11 | $2,681 | $453.63 | 36% |
| Parrano | 18 | $2,610 | $326.63 | 34% |
| Monteleone d'Orvieto | 35 | $2,564 | $331.04 | 31% |
| Massa Martana | 26 | $2,448 | $330.96 | 36% |
| San Casciano dei Bagni | 52 | $2,354 | $399.89 | 35% |