Velletri Airbnb Market Analysis 2026: Short Term Rental Data & Vacation Rental Statistics in Lazio, Italy
Is Airbnb profitable in Velletri in 2026? Explore comprehensive Airbnb analytics for Velletri, Lazio, Italy to uncover income potential. This 2026 STR market report for Velletri, based on AirROI data from February 2025 to January 2026, reveals key trends in the niche market of 38 active listings.
Whether you're considering an Airbnb investment in Velletri, optimizing your existing vacation rental, or exploring rental arbitrage opportunities, understanding the Velletri Airbnb data is crucial. Navigating the high regulation landscape is key to maximizing your short term rental income potential. Let's dive into the specifics.
Key Velletri Airbnb Performance Metrics Overview
Monthly Airbnb Revenue Variations & Income Potential in Velletri (2026)
Understanding the monthly revenue variations for Airbnb listings in Velletri is key to maximizing your short term rental income potential. Seasonality significantly impacts earnings. Our analysis, based on data from the past 12 months, shows that the peak revenue month for STRs in Velletri is typically August, while January often presents the lowest earnings, highlighting opportunities for strategic pricing adjustments during shoulder and low seasons. Explore the typical Airbnb income in Velletri across different performance tiers:
- Best-in-class properties (Top 10%) achieve $5,032+ monthly, often utilizing dynamic pricing and superior guest experiences.
- Strong performing properties (Top 25%) earn $2,454 or more, indicating effective management and desirable locations/amenities.
- Typical properties (Median) generate around $1,036 per month, representing the average market performance.
- Entry-level properties (Bottom 25%) see earnings around $543, often with potential for optimization.
Average Monthly Airbnb Earnings Trend in Velletri
Velletri Airbnb Occupancy Rate Trends (2026)
Maximize your bookings by understanding the Velletri STR occupancy trends. Seasonal demand shifts significantly influence how often properties are booked. Typically, Augustsees the highest demand (peak season occupancy), while January experiences the lowest (low season). Effective strategies, like adjusting minimum stays or offering promotions, can boost occupancy during slower periods. Here's how different property tiers perform in Velletri:
- Best-in-class properties (Top 10%) achieve 61%+ occupancy, indicating high desirability and potentially optimized availability.
- Strong performing properties (Top 25%) maintain 47% or higher occupancy, suggesting good market fit and guest satisfaction.
- Typical properties (Median) have an occupancy rate around 30%.
- Entry-level properties (Bottom 25%) average 12% occupancy, potentially facing higher vacancy.
Average Monthly Occupancy Rate Trend in Velletri
Average Daily Rate (ADR) Airbnb Trends in Velletri (2026)
Effective short term rental pricing strategy in Velletri involves understanding monthly ADR fluctuations. The Average Daily Rate (ADR) for Airbnb in Velletri typically peaks in September and dips lowest during March. Leveraging Airbnb dynamic pricing tools or strategies based on this seasonality can significantly boost revenue. Here's a look at the typical nightly rates achieved:
- Best-in-class properties (Top 10%) command rates of $417+ per night, often due to premium features or locations.
- Strong performing properties (Top 25%) achieve nightly rates of $231 or more.
- Typical properties (Median) charge around $117 per night.
- Entry-level properties (Bottom 25%) earn around $83 per night.
Average Daily Rate (ADR) Trend by Month in Velletri
Get Live Velletri Market Intelligence 👇

Explore Real-time Analytics
Airbnb Seasonality Analysis & Trends in Velletri (2026)
Peak Season (August, July, September)
- Revenue averages $3,447 per month
- Occupancy rates average 44.2%
- Daily rates average $195
Shoulder Season
- Revenue averages $1,858 per month
- Occupancy maintains around 30.9%
- Daily rates hold near $180
Low Season (January, February, December)
- Revenue drops to average $730 per month
- Occupancy decreases to average 19.3%
- Daily rates adjust to average $188
Seasonality Insights for Velletri
- The Airbnb seasonality in Velletri shows highly seasonal trends requiring careful strategy. While the sections above show seasonal averages, it's also insightful to look at the extremes:
- During the high season, the absolute peak month showcases Velletri's highest earning potential, with monthly revenues capable of climbing to $3,885, occupancy reaching a high of 50.5%, and ADRs peaking at $198.
- Conversely, the slowest single month of the year, typically falling within the low season, marks the market's lowest point. In this month, revenue might dip to $529, occupancy could drop to 16.5%, and ADRs may adjust down to $172.
- Understanding both the seasonal averages and these monthly peaks and troughs in revenue, occupancy, and ADR is crucial for maximizing your Airbnb profit potential in Velletri.
Seasonal Strategies for Maximizing Profit
- Peak Season: Maximize revenue through premium pricing and potentially longer minimum stays. Ensure high availability.
- Low Season: Offer competitive pricing, special promotions (e.g., extended stay discounts), and flexible cancellation policies. Target off-season travelers like remote workers or budget-conscious guests.
- Shoulder Seasons: Implement dynamic pricing that balances peak and low rates. Target weekend travelers or specific events. Offer slightly more flexible terms than peak season.
- Regularly analyze your own performance against these Velletri seasonality benchmarks and adjust your pricing and availability strategy accordingly.
Best Areas for Airbnb Investment in Velletri (2026)
Exploring the top neighborhoods for short-term rentals in Velletri? This section highlights key areas, outlining why they are attractive for hosts and guests, along with notable local attractions. Consider these locations based on your target guest profile and investment strategy.
| Neighborhood / Area | Why Host Here? (Target Guests & Appeal) | Key Attractions & Landmarks |
|---|---|---|
| Centro Storico | Velletri's historic center with charming medieval streets, local shops, and traditional restaurants. Ideal for tourists looking to explore the rich history and culture of the town. | Piazza Garibaldi, Chiesa di Santa Maria della Stella, Museo Archeologico, Palazzo Comunale |
| Parco degli Acquedotti | A beautiful park featuring ancient aqueducts, perfect for nature lovers and picnics. Popular for outdoor activities and family outings. | Acquedotto Claudio, Picnic areas, Walking trails, Biking paths |
| Castelli Romani | A scenic area just outside of Rome known for its wine production and stunning landscapes. Great for tourists exploring regional wines and nature. | Frascati wineries, Villa Aldobrandini, Natural parks, Local festivals |
| Velletri Wine Country | Renowned for its vineyards and wineries, this area attracts wine enthusiasts and those looking to enjoy local cuisine and fine wines. | Vineyard tours, Wine tasting events, Local restaurants, Culinary workshops |
| Grotte di Velletri | An intriguing series of caves and historical sites that attract adventure seekers and history buffs alike. | Historical caves, Guided tours, Nature walks |
| Outdoor Markets | Velletri’s outdoor markets are vibrant and offer a taste of local life, perfect for visitors looking to experience the local culture. | Weekly market days, Local food stalls, Handicrafts |
| Sports and Recreation Facilities | With various sports facilities, this area is targeted at families and sports enthusiasts looking for active vacation options. | Soccer fields, Basketball courts, Playgrounds |
| Thermal Springs | Nearby thermal springs provide a relaxing experience for wellness tourists seeking spa and relaxation treatments. | Thermal baths, Spa treatments, Relaxation areas |
Understanding Airbnb License Requirements & STR Laws in Velletri (2026)
Yes, Velletri, Lazio, Italy enforces high STR regulations. Obtaining a license and ensuring compliance is almost certainly required according to current 2026 STR laws. Always verify the latest short term rental regulations and Airbnb license requirements directly with local government authorities for Velletri to ensure full compliance before hosting.
(Source: AirROI data, 2026, based on 84% licensed listings)
Top Performing Airbnb Properties in Velletri (2026)
Benchmark your potential! Explore examples of top-performing Airbnb properties in Velletribased on Trailing Twelve Month (TTM) revenue. Analyze their characteristics, revenue, occupancy rate, and ADR to understand what drives success in this market.
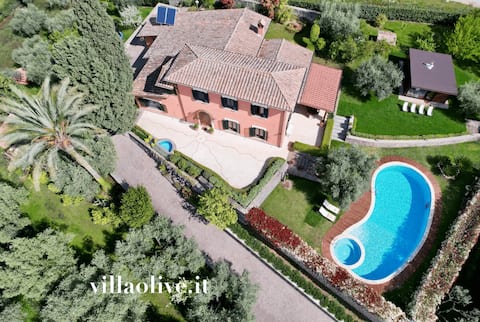
Villa Olive Garden Spa & Tennis - Luxe Estate
Entire Place • 5 bedrooms

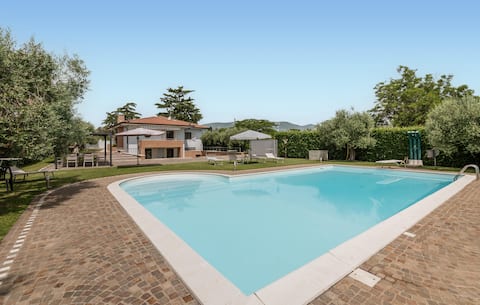
Casale Barbi - Villa with Pool
Entire Place • 7 bedrooms
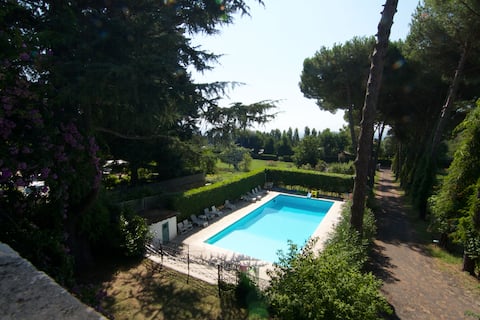
Lovely home in Velletri with WiFi
Entire Place • 4 bedrooms
Villa degli Oblò+ Villa Magnolia
Entire Place • 8 bedrooms

Penthouse + Jacuzzi (panoramic view) near Rome.
Entire Place • 1 bedroom

Villa del Portico+Villa degli Obló
Entire Place • 8 bedrooms
Note: Performance varies based on location, size, amenities, seasonality, and management quality. Data reflects the past 12 months.
Top Performing Airbnb Hosts in Velletri (2026)
Learn from the best! This table showcases top-performing Airbnb hosts in Velletri based on the number of properties managed and estimated total revenue over the past year. Analyze their scale and performance metrics.
| Host Name | Properties | Grossing Revenue | Stay Reviews | Avg Rating |
|---|---|---|---|---|
| Fam.Montanari | 5 | $122,867 | 42 | 4.60/5.0 |
| Radu | 1 | $80,155 | 17 | 5.00/5.0 |
| Giorgia | 1 | $70,836 | 41 | 4.90/5.0 |
| Novasol | 1 | $63,537 | 10 | 4.50/5.0 |
| Simona E Federica | 2 | $43,710 | 147 | 4.91/5.0 |
| Claudio Maferri | 1 | $35,700 | 127 | 4.86/5.0 |
| Posarelli Villas | 1 | $32,750 | 4 | 4.75/5.0 |
| Mauro | 1 | $31,039 | 12 | 5.00/5.0 |
| Riccardo | 2 | $22,377 | 12 | 5.00/5.0 |
| Cathy | 1 | $21,601 | 18 | 5.00/5.0 |
Analyzing the strategies of top hosts, such as their property selection, pricing, and guest communication, can offer valuable lessons for optimizing your own Airbnb operations in Velletri.
Dive Deeper: Advanced Velletri STR Market Data (2026)
Ready to unlock more insights? AirROI provides access to advanced metrics and comprehensive Airbnb data for Velletri. Explore detailed analytics beyond this report to refine your investment strategy, optimize pricing, and maximize your vacation rental profits.
Explore Advanced MetricsVelletri Short-Term Rental Market Composition (2026): Property & Room Types
Room Type Distribution
Property Type Distribution
Market Composition Insights for Velletri
- The Velletri Airbnb market composition is heavily skewed towards Entire Home/Apt listings, which make up 97.4% of the 38 active rentals. This indicates strong guest preference for privacy and space.
- Looking at the property type distribution in Velletri, House properties are the most common (55.3%), reflecting the local real estate landscape.
- Houses represent a significant 55.3% portion, catering likely to families or larger groups.
- The presence of 5.3% Hotel/Boutique listings indicates integration with traditional hospitality.
Velletri Airbnb Room Capacity Analysis (2026): Bedroom Distribution
Distribution of Listings by Number of Bedrooms
Room Capacity Insights for Velletri
- The dominant room capacity in Velletri is 2 bedrooms listings, making up 28.9% of the market. This suggests a strong demand for properties suitable for couples or solo travelers.
- Together, 2 bedrooms and 1 bedroom properties represent 55.2% of the active Airbnb listings in Velletri, indicating a high concentration in these sizes.
- A significant 42.2% of listings offer 3+ bedrooms, catering to larger groups and families seeking more space in Velletri.
Velletri Vacation Rental Guest Capacity Trends (2026)
Distribution of Listings by Guest Capacity
Guest Capacity Insights for Velletri
- The most common guest capacity trend in Velletri vacation rentals is listings accommodating 8+ guests (36.8%). This suggests the primary traveler segment is likely larger groups.
- Properties designed for 8+ guests and 4 guests dominate the Velletri STR market, accounting for 60.5% of listings.
- 47.3% of properties accommodate 6+ guests, serving the market segment for larger families or group travel in Velletri.
- On average, properties in Velletri are equipped to host 5.4 guests.
Velletri Airbnb Booking Patterns (2026): Available vs. Booked Days
Available Days Distribution
Booked Days Distribution
Booking Pattern Insights for Velletri
- The most common availability pattern in Velletri falls within the 271-366 days range, representing 57.9% of listings. This suggests many properties have significant open periods on their calendars.
- Approximately 94.7% of listings show high availability (181+ days open annually), indicating potential for increased bookings or specific owner usage patterns.
- For booked days, the 91-180 days range is most frequent in Velletri (39.5%), reflecting common guest stay durations or potential owner blocking patterns.
- A notable 5.3% of properties secure long booking periods (181+ days booked per year), highlighting successful long-term rental strategies or significant owner usage.
Velletri Airbnb Minimum Stay Requirements Analysis
Distribution of Listings by Minimum Night Requirement
1 Night
9 listings
23.7% of total
2 Nights
3 listings
7.9% of total
3 Nights
2 listings
5.3% of total
4-6 Nights
5 listings
13.2% of total
7-29 Nights
2 listings
5.3% of total
30+ Nights
17 listings
44.7% of total
Key Insights
- The most prevalent minimum stay requirement in Velletri is 30+ Nights, adopted by 44.7% of listings. This highlights the market's preference for longer commitments.
- A significant segment (44.7%) caters to monthly stays (30+ nights) in Velletri, pointing to opportunities in the extended-stay market.
Recommendations
- Align with the market by considering a 30+ Nights minimum stay, as 44.7% of Velletri hosts use this setting.
- If feasible, allowing 1-night stays, especially midweek or during low season, could capture last-minute bookings, as only 23.7% currently do.
- Explore offering discounts for stays of 30+ nights to attract the 44.7% of the market seeking extended stays.
- Adjust minimum nights based on seasonality – potentially shorter during low season and longer during peak demand periods in Velletri.
Velletri Airbnb Cancellation Policy Trends Analysis (2026)
Super Strict 30 Days
1 listings
2.6% of total
Super Strict 60 Days
2 listings
5.3% of total
Flexible
16 listings
42.1% of total
Moderate
11 listings
28.9% of total
Firm
7 listings
18.4% of total
Strict
1 listings
2.6% of total
Cancellation Policy Insights for Velletri
- The prevailing Airbnb cancellation policy trend in Velletri is Flexible, used by 42.1% of listings.
- The market strongly favors guest-friendly terms, with 71.0% of listings offering Flexible or Moderate policies. This suggests guests in Velletri may expect booking flexibility.
- Strict cancellation policies are quite rare (2.6%), potentially making listings with this policy less competitive unless justified by high demand or property type.
Recommendations for Hosts
- Consider adopting a Flexible policy to align with the 42.1% market standard in Velletri.
- Using a Strict policy might deter some guests, as only 2.6% of listings use it. Evaluate if potential revenue protection outweighs possible lower booking rates.
- Regularly review your cancellation policy against competitors and market demand shifts in Velletri.
Velletri STR Booking Lead Time Analysis (2026)
Average Booking Lead Time by Month
Booking Lead Time Insights for Velletri
- The overall average booking lead time for vacation rentals in Velletri is 50 days.
- Guests book furthest in advance for stays during August (average 85 days), likely coinciding with peak travel demand or local events.
- The shortest booking windows occur for stays in February (average 14 days), indicating more last-minute travel plans during this time.
- Seasonally, Summer (60 days avg.) sees the longest lead times, while Winter (23 days avg.) has the shortest, reflecting typical travel planning cycles.
Recommendations for Hosts
- Use the overall average lead time (50 days) as a baseline for your pricing and availability strategy in Velletri.
- For August stays, consider implementing length-of-stay discounts or slightly higher rates for bookings made less than 85 days out to capitalize on advance planning.
- During February, focus on last-minute booking availability and promotions, as guests book with very short notice (14 days avg.).
- Target marketing efforts for the Summer season well in advance (at least 60 days) to capture early planners.
- Monitor your own booking lead times against these Velletri averages to identify opportunities for dynamic pricing adjustments.
Popular & Essential Airbnb Amenities in Velletri (2026)
Amenity Prevalence
Amenity Insights for Velletri
- Essential amenities in Velletri that guests expect include: Kitchen. Lacking these (this) could significantly impact bookings.
- Popular amenities like Wifi, Heating, TV are common but not universal. Offering these can provide a competitive edge.
- Warning: Wifi is not universally provided but is considered essential globally. Ensure reliable Wifi is offered.
Recommendations for Hosts
- Ensure your listing includes all essential amenities for Velletri: Kitchen.
- Consider adding popular differentiators like Wifi or Heating to increase appeal.
- Highlight unique or less common amenities you offer (e.g., hot tub, dedicated workspace, EV charger) in your listing description and photos.
- Regularly check competitor amenities in Velletri to stay competitive.
Velletri Airbnb Guest Demographics & Profile Analysis (2026)
Guest Profile Summary for Velletri
- The typical guest profile for Airbnb in Velletri consists of a mix of domestic (39%) and international guests, with top international origins including United Kingdom, typically belonging to the Post-2000s (Gen Z/Alpha) group (50%), primarily speaking English or Italian.
- Domestic travelers account for 39.0% of guests.
- Key international markets include Italy (39%) and United Kingdom (10.5%).
- Top languages spoken are English (34.8%) followed by Italian (18.3%).
- A significant demographic segment is the Post-2000s (Gen Z/Alpha) group, representing 50% of guests.
Recommendations for Hosts
- Focus marketing internationally, particularly towards travelers from United Kingdom.
- Tailor amenities and listing descriptions to appeal to the dominant Post-2000s (Gen Z/Alpha) demographic (e.g., highlight fast WiFi, smart home features, local guides).
- Highlight unique local experiences or amenities relevant to the primary guest profile.
- Consider seasonal promotions aligned with peak travel times for key origin markets.
Nearby Short-Term Rental Market Comparison
How does the Velletri Airbnb market stack up against its neighbors? Compare key performance metrics like average monthly revenue, ADR, and occupancy rates in surrounding areas to understand the broader regional STR landscape.
| Market | Active Properties | Monthly Revenue | Daily Rate | Avg. Occupancy |
|---|---|---|---|---|
| Celleno | 13 | $4,041 | $594.80 | 28% |
| Collevecchio | 14 | $3,140 | $334.97 | 40% |
| Palombara Sabina | 15 | $2,914 | $309.11 | 38% |
| Rome | 26,470 | $2,817 | $217.07 | 50% |
| Guardea | 14 | $2,703 | $415.58 | 33% |
| Allerona | 11 | $2,681 | $453.63 | 36% |
| Parrano | 18 | $2,610 | $326.63 | 34% |
| Monteleone d'Orvieto | 35 | $2,564 | $331.04 | 31% |
| Massa Martana | 26 | $2,448 | $330.96 | 36% |
| San Casciano dei Bagni | 52 | $2,354 | $399.89 | 35% |