Vetralla Airbnb Market Analysis 2026: Short Term Rental Data & Vacation Rental Statistics in Lazio, Italy
Is Airbnb profitable in Vetralla in 2026? Explore comprehensive Airbnb analytics for Vetralla, Lazio, Italy to uncover income potential. This 2026 STR market report for Vetralla, based on AirROI data from February 2025 to January 2026, reveals key trends in the niche market of 29 active listings.
Whether you're considering an Airbnb investment in Vetralla, optimizing your existing vacation rental, or exploring rental arbitrage opportunities, understanding the Vetralla Airbnb data is crucial. Navigating the high regulation landscape is key to maximizing your short term rental income potential. Let's dive into the specifics.
Key Vetralla Airbnb Performance Metrics Overview
Monthly Airbnb Revenue Variations & Income Potential in Vetralla (2026)
Understanding the monthly revenue variations for Airbnb listings in Vetralla is key to maximizing your short term rental income potential. Seasonality significantly impacts earnings. Our analysis, based on data from the past 12 months, shows that the peak revenue month for STRs in Vetralla is typically August, while January often presents the lowest earnings, highlighting opportunities for strategic pricing adjustments during shoulder and low seasons. Explore the typical Airbnb income in Vetralla across different performance tiers:
- Best-in-class properties (Top 10%) achieve $3,252+ monthly, often utilizing dynamic pricing and superior guest experiences.
- Strong performing properties (Top 25%) earn $1,338 or more, indicating effective management and desirable locations/amenities.
- Typical properties (Median) generate around $728 per month, representing the average market performance.
- Entry-level properties (Bottom 25%) see earnings around $402, often with potential for optimization.
Average Monthly Airbnb Earnings Trend in Vetralla
Vetralla Airbnb Occupancy Rate Trends (2026)
Maximize your bookings by understanding the Vetralla STR occupancy trends. Seasonal demand shifts significantly influence how often properties are booked. Typically, Augustsees the highest demand (peak season occupancy), while February experiences the lowest (low season). Effective strategies, like adjusting minimum stays or offering promotions, can boost occupancy during slower periods. Here's how different property tiers perform in Vetralla:
- Best-in-class properties (Top 10%) achieve 49%+ occupancy, indicating high desirability and potentially optimized availability.
- Strong performing properties (Top 25%) maintain 35% or higher occupancy, suggesting good market fit and guest satisfaction.
- Typical properties (Median) have an occupancy rate around 23%.
- Entry-level properties (Bottom 25%) average 11% occupancy, potentially facing higher vacancy.
Average Monthly Occupancy Rate Trend in Vetralla
Average Daily Rate (ADR) Airbnb Trends in Vetralla (2026)
Effective short term rental pricing strategy in Vetralla involves understanding monthly ADR fluctuations. The Average Daily Rate (ADR) for Airbnb in Vetralla typically peaks in September and dips lowest during March. Leveraging Airbnb dynamic pricing tools or strategies based on this seasonality can significantly boost revenue. Here's a look at the typical nightly rates achieved:
- Best-in-class properties (Top 10%) command rates of $349+ per night, often due to premium features or locations.
- Strong performing properties (Top 25%) achieve nightly rates of $174 or more.
- Typical properties (Median) charge around $117 per night.
- Entry-level properties (Bottom 25%) earn around $74 per night.
Average Daily Rate (ADR) Trend by Month in Vetralla
Get Live Vetralla Market Intelligence 👇

Explore Real-time Analytics
Airbnb Seasonality Analysis & Trends in Vetralla (2026)
Peak Season (August, July, March)
- Revenue averages $1,981 per month
- Occupancy rates average 33.7%
- Daily rates average $151
Shoulder Season
- Revenue averages $1,203 per month
- Occupancy maintains around 23.8%
- Daily rates hold near $156
Low Season (January, November, December)
- Revenue drops to average $874 per month
- Occupancy decreases to average 21.9%
- Daily rates adjust to average $166
Seasonality Insights for Vetralla
- The Airbnb seasonality in Vetralla shows highly seasonal trends requiring careful strategy. While the sections above show seasonal averages, it's also insightful to look at the extremes:
- During the high season, the absolute peak month showcases Vetralla's highest earning potential, with monthly revenues capable of climbing to $2,322, occupancy reaching a high of 41.4%, and ADRs peaking at $183.
- Conversely, the slowest single month of the year, typically falling within the low season, marks the market's lowest point. In this month, revenue might dip to $804, occupancy could drop to 17.8%, and ADRs may adjust down to $141.
- Understanding both the seasonal averages and these monthly peaks and troughs in revenue, occupancy, and ADR is crucial for maximizing your Airbnb profit potential in Vetralla.
Seasonal Strategies for Maximizing Profit
- Peak Season: Maximize revenue through premium pricing and potentially longer minimum stays. Ensure high availability.
- Low Season: Offer competitive pricing, special promotions (e.g., extended stay discounts), and flexible cancellation policies. Target off-season travelers like remote workers or budget-conscious guests.
- Shoulder Seasons: Implement dynamic pricing that balances peak and low rates. Target weekend travelers or specific events. Offer slightly more flexible terms than peak season.
- Regularly analyze your own performance against these Vetralla seasonality benchmarks and adjust your pricing and availability strategy accordingly.
Best Areas for Airbnb Investment in Vetralla (2026)
Exploring the top neighborhoods for short-term rentals in Vetralla? This section highlights key areas, outlining why they are attractive for hosts and guests, along with notable local attractions. Consider these locations based on your target guest profile and investment strategy.
| Neighborhood / Area | Why Host Here? (Target Guests & Appeal) | Key Attractions & Landmarks |
|---|---|---|
| Centro Storico | The historic center of Vetralla, with charming streets, ancient buildings, and a rich cultural heritage. This area attracts tourists interested in history and local culture. | Romanesque Church of Santa Maria della Rose, Vetralla's Archaeological Museum, Castello di Vetralla, Piazza della Repubblica, Local artisan shops |
| Natural Park Area | Surrounded by beautiful nature, this area is great for outdoor enthusiasts and nature lovers. Offers activities like hiking and bird watching while being close to historical towns. | Parco Naturale Regionale dell'Antichissima Città di Vetralla, Nature trails, Viewpoints, Flora and Fauna |
| Vetralla's Vineyards | Famous for its local wines, this area attracts wine lovers and those interested in wine tours and tastings. Perfect for accommodations for food and wine enthusiasts. | Local wineries, Wine tasting tours, Vineyard tours, Agriturismos |
| Cultural District | This area hosts various cultural events and festivals throughout the year, making it vibrant and attractive for visitors looking for local experiences. | Local festivals, Cultural exhibitions, Theater events, Artist workshops |
| Villa Lante | Famous for its beautiful gardens and architecture, Villa Lante attracts visitors looking to experience Renaissance art in an outdoor setting. | Villa Lante gardens, Historic architecture, Cultural tours |
| Nearby Nature Reserves | Close proximity to natural reserves provides excellent opportunities for adventure tourism and attracting eco-tourists looking for relaxation and exploration. | Nature walks, Bird watching, Visitor centers, Outdoor activities |
| Local Markets | A vibrant market area where locals sell fresh produce and artisanal products. Perfect for those who want to experience local life and cuisine. | Weekly farmers' market, Artisan food stalls, Local crafts |
| Religious Sites | Vetralla has several important religious sites, attracting pilgrims and visitors interested in religious tourism and heritage. | San Francesco Church, San Giovanni Battista church, Pilgrimage paths |
Understanding Airbnb License Requirements & STR Laws in Vetralla (2026)
Yes, Vetralla, Lazio, Italy enforces high STR regulations. Obtaining a license and ensuring compliance is almost certainly required according to current 2026 STR laws. Always verify the latest short term rental regulations and Airbnb license requirements directly with local government authorities for Vetralla to ensure full compliance before hosting.
(Source: AirROI data, 2026, based on 100% licensed listings)
Top Performing Airbnb Properties in Vetralla (2026)
Benchmark your potential! Explore examples of top-performing Airbnb properties in Vetrallabased on Trailing Twelve Month (TTM) revenue. Analyze their characteristics, revenue, occupancy rate, and ADR to understand what drives success in this market.
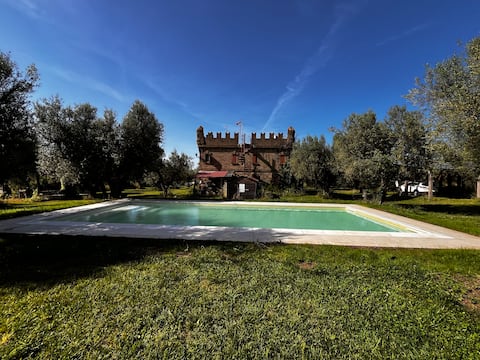
Country house I Merli: gran villa w/swimming pool!
Entire Place • 5 bedrooms

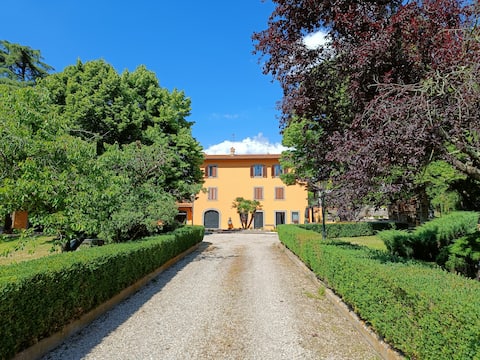
Rent a 250 sqm villa
Entire Place • 5 bedrooms
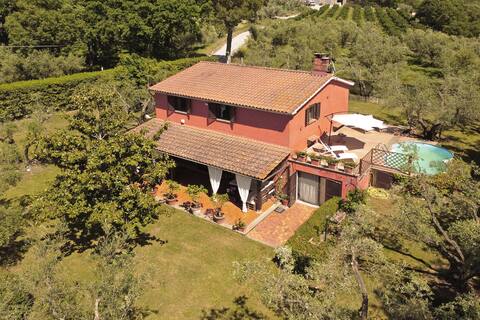
Casale la Quercia - Beautiful farmhouse in nature
Entire Place • 5 bedrooms
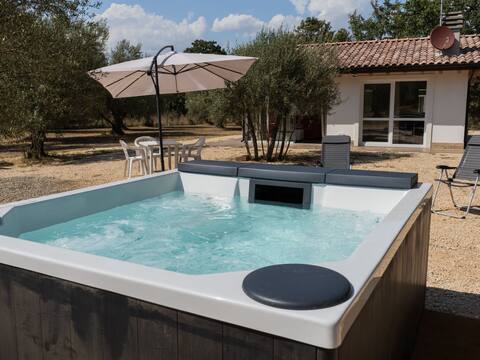
Casale Pontarello - Happy Rentals
Entire Place • 5 bedrooms
Grotta Porcina by Interhome
Entire Place • 1 bedroom

Nonno Bino's House
Entire Place • 2 bedrooms
Note: Performance varies based on location, size, amenities, seasonality, and management quality. Data reflects the past 12 months.
Top Performing Airbnb Hosts in Vetralla (2026)
Learn from the best! This table showcases top-performing Airbnb hosts in Vetralla based on the number of properties managed and estimated total revenue over the past year. Analyze their scale and performance metrics.
| Host Name | Properties | Grossing Revenue | Stay Reviews | Avg Rating |
|---|---|---|---|---|
| Ernesto | 1 | $63,592 | 43 | 4.95/5.0 |
| Renato | 2 | $41,329 | 120 | 4.93/5.0 |
| Mario | 1 | $28,352 | 5 | 5.00/5.0 |
| Matilde | 2 | $27,814 | 104 | 4.96/5.0 |
| Lisa - Interhome | 2 | $20,393 | 5 | 5.00/5.0 |
| Sandro | 3 | $18,916 | 75 | 4.68/5.0 |
| Harold | 1 | $16,918 | 1 | Not Rated |
| Adelmo | 1 | $15,417 | 13 | 5.00/5.0 |
| Patrizia | 1 | $10,627 | 25 | 4.96/5.0 |
| Alessia | 2 | $10,298 | 78 | 4.89/5.0 |
Analyzing the strategies of top hosts, such as their property selection, pricing, and guest communication, can offer valuable lessons for optimizing your own Airbnb operations in Vetralla.
Dive Deeper: Advanced Vetralla STR Market Data (2026)
Ready to unlock more insights? AirROI provides access to advanced metrics and comprehensive Airbnb data for Vetralla. Explore detailed analytics beyond this report to refine your investment strategy, optimize pricing, and maximize your vacation rental profits.
Explore Advanced MetricsVetralla Short-Term Rental Market Composition (2026): Property & Room Types
Room Type Distribution
Property Type Distribution
Market Composition Insights for Vetralla
- The Vetralla Airbnb market composition is heavily skewed towards Entire Home/Apt listings, which make up 96.6% of the 29 active rentals. This indicates strong guest preference for privacy and space.
- Looking at the property type distribution in Vetralla, House properties are the most common (44.8%), reflecting the local real estate landscape.
- Houses represent a significant 44.8% portion, catering likely to families or larger groups.
- Smaller segments like hotel/boutique (combined 3.4%) offer potential for unique stay experiences.
Vetralla Airbnb Room Capacity Analysis (2026): Bedroom Distribution
Distribution of Listings by Number of Bedrooms
Room Capacity Insights for Vetralla
- The dominant room capacity in Vetralla is 1 bedroom listings, making up 37.9% of the market. This suggests a strong demand for properties suitable for couples or solo travelers.
- Together, 1 bedroom and 2 bedrooms properties represent 68.9% of the active Airbnb listings in Vetralla, indicating a high concentration in these sizes.
- A significant 27.5% of listings offer 3+ bedrooms, catering to larger groups and families seeking more space in Vetralla.
Vetralla Vacation Rental Guest Capacity Trends (2026)
Distribution of Listings by Guest Capacity
Guest Capacity Insights for Vetralla
- The most common guest capacity trend in Vetralla vacation rentals is listings accommodating 6 guests (24.1%). This suggests the primary traveler segment is likely larger groups.
- Properties designed for 6 guests and 8+ guests dominate the Vetralla STR market, accounting for 41.3% of listings.
- 44.7% of properties accommodate 6+ guests, serving the market segment for larger families or group travel in Vetralla.
- On average, properties in Vetralla are equipped to host 4.8 guests.
Vetralla Airbnb Booking Patterns (2026): Available vs. Booked Days
Available Days Distribution
Booked Days Distribution
Booking Pattern Insights for Vetralla
- The most common availability pattern in Vetralla falls within the 271-366 days range, representing 69% of listings. This suggests many properties have significant open periods on their calendars.
- Approximately 100.0% of listings show high availability (181+ days open annually), indicating potential for increased bookings or specific owner usage patterns.
- For booked days, the 1-30 days range is most frequent in Vetralla (44.8%), reflecting common guest stay durations or potential owner blocking patterns.
Vetralla Airbnb Minimum Stay Requirements Analysis
Distribution of Listings by Minimum Night Requirement
1 Night
10 listings
34.5% of total
2 Nights
2 listings
6.9% of total
3 Nights
3 listings
10.3% of total
4-6 Nights
1 listings
3.4% of total
30+ Nights
13 listings
44.8% of total
Key Insights
- The most prevalent minimum stay requirement in Vetralla is 30+ Nights, adopted by 44.8% of listings. This highlights the market's preference for longer commitments.
- A significant segment (44.8%) caters to monthly stays (30+ nights) in Vetralla, pointing to opportunities in the extended-stay market.
Recommendations
- Align with the market by considering a 30+ Nights minimum stay, as 44.8% of Vetralla hosts use this setting.
- Explore offering discounts for stays of 30+ nights to attract the 44.8% of the market seeking extended stays.
- Adjust minimum nights based on seasonality – potentially shorter during low season and longer during peak demand periods in Vetralla.
Vetralla Airbnb Cancellation Policy Trends Analysis (2026)
Super Strict 30 Days
2 listings
6.9% of total
Flexible
9 listings
31% of total
Moderate
13 listings
44.8% of total
Firm
3 listings
10.3% of total
Strict
2 listings
6.9% of total
Cancellation Policy Insights for Vetralla
- The prevailing Airbnb cancellation policy trend in Vetralla is Moderate, used by 44.8% of listings.
- The market strongly favors guest-friendly terms, with 75.8% of listings offering Flexible or Moderate policies. This suggests guests in Vetralla may expect booking flexibility.
- Strict cancellation policies are quite rare (6.9%), potentially making listings with this policy less competitive unless justified by high demand or property type.
Recommendations for Hosts
- Consider adopting a Moderate policy to align with the 44.8% market standard in Vetralla.
- Using a Strict policy might deter some guests, as only 6.9% of listings use it. Evaluate if potential revenue protection outweighs possible lower booking rates.
- Regularly review your cancellation policy against competitors and market demand shifts in Vetralla.
Vetralla STR Booking Lead Time Analysis (2026)
Average Booking Lead Time by Month
Booking Lead Time Insights for Vetralla
- The overall average booking lead time for vacation rentals in Vetralla is 39 days.
- Guests book furthest in advance for stays during September (average 57 days), likely coinciding with peak travel demand or local events.
- The shortest booking windows occur for stays in February (average 11 days), indicating more last-minute travel plans during this time.
- Seasonally, Fall (43 days avg.) sees the longest lead times, while Winter (20 days avg.) has the shortest, reflecting typical travel planning cycles.
Recommendations for Hosts
- Use the overall average lead time (39 days) as a baseline for your pricing and availability strategy in Vetralla.
- For September stays, consider implementing length-of-stay discounts or slightly higher rates for bookings made less than 57 days out to capitalize on advance planning.
- During February, focus on last-minute booking availability and promotions, as guests book with very short notice (11 days avg.).
- Target marketing efforts for the Fall season well in advance (at least 43 days) to capture early planners.
- Monitor your own booking lead times against these Vetralla averages to identify opportunities for dynamic pricing adjustments.
Popular & Essential Airbnb Amenities in Vetralla (2026)
Amenity Prevalence
Amenity Insights for Vetralla
- Essential amenities in Vetralla that guests expect include: TV. Lacking these (this) could significantly impact bookings.
- Popular amenities like Wifi, Heating, Kitchen are common but not universal. Offering these can provide a competitive edge.
- Warning: Wifi is not universally provided but is considered essential globally. Ensure reliable Wifi is offered.
Recommendations for Hosts
- Ensure your listing includes all essential amenities for Vetralla: TV.
- Consider adding popular differentiators like Wifi or Heating to increase appeal.
- Highlight unique or less common amenities you offer (e.g., hot tub, dedicated workspace, EV charger) in your listing description and photos.
- Regularly check competitor amenities in Vetralla to stay competitive.
Vetralla Airbnb Guest Demographics & Profile Analysis (2026)
Guest Profile Summary for Vetralla
- The typical guest profile for Airbnb in Vetralla consists of a mix of domestic (52%) and international guests, often arriving from nearby Rome, typically belonging to the Post-2000s (Gen Z/Alpha) group (50%), primarily speaking English or Italian.
- Domestic travelers account for 52.2% of guests.
- Key international markets include Italy (52.2%) and France (13%).
- Top languages spoken are English (28.3%) followed by Italian (26.1%).
- A significant demographic segment is the Post-2000s (Gen Z/Alpha) group, representing 50% of guests.
Recommendations for Hosts
- Balance marketing efforts between domestic and international channels based on the guest mix.
- Tailor amenities and listing descriptions to appeal to the dominant Post-2000s (Gen Z/Alpha) demographic (e.g., highlight fast WiFi, smart home features, local guides).
- Highlight unique local experiences or amenities relevant to the primary guest profile.
- Consider seasonal promotions aligned with peak travel times for key origin markets.
Nearby Short-Term Rental Market Comparison
How does the Vetralla Airbnb market stack up against its neighbors? Compare key performance metrics like average monthly revenue, ADR, and occupancy rates in surrounding areas to understand the broader regional STR landscape.
| Market | Active Properties | Monthly Revenue | Daily Rate | Avg. Occupancy |
|---|---|---|---|---|
| Tignano | 12 | $4,160 | $366.92 | 45% |
| Celleno | 13 | $4,041 | $594.80 | 28% |
| Marciano della Chiana | 17 | $3,823 | $545.25 | 35% |
| Buonconvento | 60 | $3,186 | $440.58 | 43% |
| Collevecchio | 14 | $3,140 | $334.97 | 40% |
| Radda in Chianti | 94 | $3,098 | $361.57 | 39% |
| Palombara Sabina | 15 | $2,914 | $309.11 | 38% |
| Impruneta | 146 | $2,887 | $297.45 | 40% |
| Rome | 26,470 | $2,817 | $217.07 | 50% |
| Lastra a Signa | 96 | $2,760 | $311.91 | 43% |