Cesano Boscone Airbnb Market Analysis 2026: Short Term Rental Data & Vacation Rental Statistics in Lombardy, Italy
Is Airbnb profitable in Cesano Boscone in 2026? Explore comprehensive Airbnb analytics for Cesano Boscone, Lombardy, Italy to uncover income potential. This 2026 STR market report for Cesano Boscone, based on AirROI data from February 2025 to January 2026, reveals key trends in the niche market of 19 active listings.
Whether you're considering an Airbnb investment in Cesano Boscone, optimizing your existing vacation rental, or exploring rental arbitrage opportunities, understanding the Cesano Boscone Airbnb data is crucial. Navigating the high regulation landscape is key to maximizing your short term rental income potential. Let's dive into the specifics.
Key Cesano Boscone Airbnb Performance Metrics Overview
Monthly Airbnb Revenue Variations & Income Potential in Cesano Boscone (2026)
Understanding the monthly revenue variations for Airbnb listings in Cesano Boscone is key to maximizing your short term rental income potential. Seasonality significantly impacts earnings. Our analysis, based on data from the past 12 months, shows that the peak revenue month for STRs in Cesano Boscone is typically April, while January often presents the lowest earnings, highlighting opportunities for strategic pricing adjustments during shoulder and low seasons. Explore the typical Airbnb income in Cesano Boscone across different performance tiers:
- Best-in-class properties (Top 10%) achieve $2,461+ monthly, often utilizing dynamic pricing and superior guest experiences.
- Strong performing properties (Top 25%) earn $1,853 or more, indicating effective management and desirable locations/amenities.
- Typical properties (Median) generate around $1,108 per month, representing the average market performance.
- Entry-level properties (Bottom 25%) see earnings around $681, often with potential for optimization.
Average Monthly Airbnb Earnings Trend in Cesano Boscone
Cesano Boscone Airbnb Occupancy Rate Trends (2026)
Maximize your bookings by understanding the Cesano Boscone STR occupancy trends. Seasonal demand shifts significantly influence how often properties are booked. Typically, Aprilsees the highest demand (peak season occupancy), while January experiences the lowest (low season). Effective strategies, like adjusting minimum stays or offering promotions, can boost occupancy during slower periods. Here's how different property tiers perform in Cesano Boscone:
- Best-in-class properties (Top 10%) achieve 69%+ occupancy, indicating high desirability and potentially optimized availability.
- Strong performing properties (Top 25%) maintain 52% or higher occupancy, suggesting good market fit and guest satisfaction.
- Typical properties (Median) have an occupancy rate around 36%.
- Entry-level properties (Bottom 25%) average 21% occupancy, potentially facing higher vacancy.
Average Monthly Occupancy Rate Trend in Cesano Boscone
Average Daily Rate (ADR) Airbnb Trends in Cesano Boscone (2026)
Effective short term rental pricing strategy in Cesano Boscone involves understanding monthly ADR fluctuations. The Average Daily Rate (ADR) for Airbnb in Cesano Boscone typically peaks in April and dips lowest during June. Leveraging Airbnb dynamic pricing tools or strategies based on this seasonality can significantly boost revenue. Here's a look at the typical nightly rates achieved:
- Best-in-class properties (Top 10%) command rates of $189+ per night, often due to premium features or locations.
- Strong performing properties (Top 25%) achieve nightly rates of $131 or more.
- Typical properties (Median) charge around $96 per night.
- Entry-level properties (Bottom 25%) earn around $79 per night.
Average Daily Rate (ADR) Trend by Month in Cesano Boscone
Get Live Cesano Boscone Market Intelligence 👇
Explore Real-time Analytics
Airbnb Seasonality Analysis & Trends in Cesano Boscone (2026)
Peak Season (April, November, September)
- Revenue averages $1,757 per month
- Occupancy rates average 48.8%
- Daily rates average $115
Shoulder Season
- Revenue averages $1,447 per month
- Occupancy maintains around 38.5%
- Daily rates hold near $110
Low Season (January, March, May)
- Revenue drops to average $947 per month
- Occupancy decreases to average 29.2%
- Daily rates adjust to average $112
Seasonality Insights for Cesano Boscone
- The Airbnb seasonality in Cesano Boscone shows highly seasonal trends requiring careful strategy. While the sections above show seasonal averages, it's also insightful to look at the extremes:
- During the high season, the absolute peak month showcases Cesano Boscone's highest earning potential, with monthly revenues capable of climbing to $1,895, occupancy reaching a high of 60.3%, and ADRs peaking at $118.
- Conversely, the slowest single month of the year, typically falling within the low season, marks the market's lowest point. In this month, revenue might dip to $524, occupancy could drop to 19.7%, and ADRs may adjust down to $106.
- Understanding both the seasonal averages and these monthly peaks and troughs in revenue, occupancy, and ADR is crucial for maximizing your Airbnb profit potential in Cesano Boscone.
Seasonal Strategies for Maximizing Profit
- Peak Season: Maximize revenue through premium pricing and potentially longer minimum stays. Ensure high availability.
- Low Season: Offer competitive pricing, special promotions (e.g., extended stay discounts), and flexible cancellation policies. Target off-season travelers like remote workers or budget-conscious guests.
- Shoulder Seasons: Implement dynamic pricing that balances peak and low rates. Target weekend travelers or specific events. Offer slightly more flexible terms than peak season.
- Regularly analyze your own performance against these Cesano Boscone seasonality benchmarks and adjust your pricing and availability strategy accordingly.
Best Areas for Airbnb Investment in Cesano Boscone (2026)
Exploring the top neighborhoods for short-term rentals in Cesano Boscone? This section highlights key areas, outlining why they are attractive for hosts and guests, along with notable local attractions. Consider these locations based on your target guest profile and investment strategy.
| Neighborhood / Area | Why Host Here? (Target Guests & Appeal) | Key Attractions & Landmarks |
|---|---|---|
| Centro Storico | The historical center of Cesano Boscone, filled with charming streets, local shops, and cafes. Ideal for tourists looking to experience the authentic Italian lifestyle. | Chiesa di San Francesco, Villa Marazzi, Piazza della Libertà, local restaurants and bars |
| Parco della Resistenza | A large park area perfect for families and outdoor activities. Offers green spaces and walking paths, attracting visitors seeking relaxation and nature. | Parco della Resistenza, playgrounds, picnic areas, walking paths |
| Via Cavour | A busy street with shops, services, and eateries. It caters to both locals and visitors, making it an accessible area for short-term rentals. | local shops, restaurants, bars, nearby public transport |
| Scuola Materna di Via Giulio | A family-friendly neighborhood that appeals to those traveling with children. The presence of schools and parks makes it a desirable location for family stays. | nearby parks, schools, family-oriented amenities |
| Cascina Cuccagna | A quaint area that offers a mix of traditional and modern Italian living. It attracts tourists who wish to explore local culture and gastronomy. | Cascina Cuccagna, farmers market, local food experiences |
| Via Roma | An important commercial street that connects Cesano Boscone to larger cities. Ideal for business travelers and those needing quick access to services. | shops, services, transport links |
| Bivio | A suburban area popular for its residential comfort while being close to transportation links, appealing to those looking for a quieter stay near Milan. | quiet residential areas, easy public transport access |
| Zona Fiera | Close to exhibition centers, this area attracts business travelers and those attending events in the Milan area. | Milan exhibition center, business hotels, transport options |
Understanding Airbnb License Requirements & STR Laws in Cesano Boscone (2026)
Yes, Cesano Boscone, Lombardy, Italy enforces high STR regulations. Obtaining a license and ensuring compliance is almost certainly required according to current 2026 STR laws. Always verify the latest short term rental regulations and Airbnb license requirements directly with local government authorities for Cesano Boscone to ensure full compliance before hosting.
(Source: AirROI data, 2026, based on 74% licensed listings)
Top Performing Airbnb Properties in Cesano Boscone (2026)
Benchmark your potential! Explore examples of top-performing Airbnb properties in Cesano Bosconebased on Trailing Twelve Month (TTM) revenue. Analyze their characteristics, revenue, occupancy rate, and ADR to understand what drives success in this market.
Duplex penthouse with 6 bedrooms, 3 bathrooms, kitchen, and terrace
Entire Place • 6 bedrooms
![[Cesano Boscone] Design apartment with Wi-Fi](https://a0.muscache.com/im/pictures/miso/Hosting-1404883801189328686/original/05966f69-bf80-45df-b367-fc66a6ad7397.jpeg?im_w=480&im_format=avif)
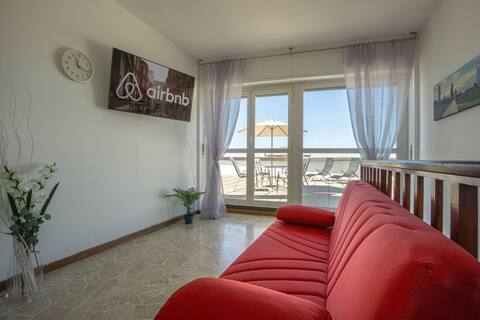
[Cesano Boscone] Design apartment with Wi-Fi
Entire Place • 1 bedroom
![[Cesano Boscone]2 Bedrooms Apartment with Wi-Fi](https://a0.muscache.com/im/pictures/miso/Hosting-1315808664470021568/original/adf3d037-3e07-47a0-8faf-8591e330d9b3.jpeg?im_w=480&im_format=avif)
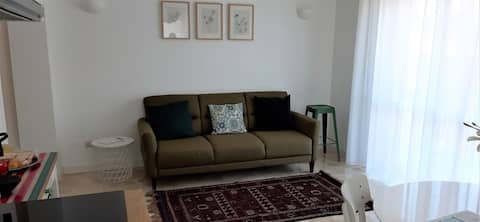
[Cesano Boscone]2 Bedrooms Apartment with Wi-Fi
Entire Place • 2 bedrooms
Lovely two room apartment
Entire Place • 1 bedroom
Casa Manolo Cesano Suite Apartment Milan
Entire Place • 1 bedroom

cozy one room apartment
Entire Place • N/A
Note: Performance varies based on location, size, amenities, seasonality, and management quality. Data reflects the past 12 months.
Top Performing Airbnb Hosts in Cesano Boscone (2026)
Learn from the best! This table showcases top-performing Airbnb hosts in Cesano Boscone based on the number of properties managed and estimated total revenue over the past year. Analyze their scale and performance metrics.
| Host Name | Properties | Grossing Revenue | Stay Reviews | Avg Rating |
|---|---|---|---|---|
| Riccardo | 4 | $53,684 | 44 | 4.37/5.0 |
| Last Apartment Milano | 3 | $35,536 | 36 | 4.33/5.0 |
| Francesca | 2 | $29,601 | 121 | 4.99/5.0 |
| Manuel | 1 | $13,991 | 52 | 4.94/5.0 |
| Sara | 1 | $12,071 | 30 | 4.97/5.0 |
| Dario | 1 | $11,638 | 36 | 4.94/5.0 |
| Laura | 1 | $11,312 | 94 | 4.91/5.0 |
| Emanuela | 1 | $5,032 | 6 | 4.83/5.0 |
| Rosario | 1 | $3,563 | 15 | 4.80/5.0 |
| Ornella | 1 | $2,721 | 2 | Not Rated |
Analyzing the strategies of top hosts, such as their property selection, pricing, and guest communication, can offer valuable lessons for optimizing your own Airbnb operations in Cesano Boscone.
Dive Deeper: Advanced Cesano Boscone STR Market Data (2026)
Ready to unlock more insights? AirROI provides access to advanced metrics and comprehensive Airbnb data for Cesano Boscone. Explore detailed analytics beyond this report to refine your investment strategy, optimize pricing, and maximize your vacation rental profits.
Explore Advanced MetricsCesano Boscone Short-Term Rental Market Composition (2026): Property & Room Types
Room Type Distribution
Property Type Distribution
Market Composition Insights for Cesano Boscone
- The Cesano Boscone Airbnb market composition is heavily skewed towards Entire Home/Apt listings, which make up 84.2% of the 19 active rentals. This indicates strong guest preference for privacy and space.
- Looking at the property type distribution in Cesano Boscone, Apartment/Condo properties are the most common (84.2%), reflecting the local real estate landscape.
- The presence of 15.8% Hotel/Boutique listings indicates integration with traditional hospitality.
Cesano Boscone Airbnb Room Capacity Analysis (2026): Bedroom Distribution
Distribution of Listings by Number of Bedrooms
Room Capacity Insights for Cesano Boscone
- The dominant room capacity in Cesano Boscone is 1 bedroom listings, making up 57.9% of the market. This suggests a strong demand for properties suitable for couples or solo travelers.
- Together, 1 bedroom and 5+ bedrooms properties represent 73.7% of the active Airbnb listings in Cesano Boscone, indicating a high concentration in these sizes.
- With over half the market (57.9%) consisting of studios or 1-bedroom units, Cesano Boscone is particularly well-suited for individuals or couples.
Cesano Boscone Vacation Rental Guest Capacity Trends (2026)
Distribution of Listings by Guest Capacity
Guest Capacity Insights for Cesano Boscone
- The most common guest capacity trend in Cesano Boscone vacation rentals is listings accommodating 2 guests (26.3%). This suggests the primary traveler segment is likely couples or solo travelers.
- Properties designed for 2 guests and 6 guests dominate the Cesano Boscone STR market, accounting for 47.4% of listings.
- 26.4% of properties accommodate 6+ guests, serving the market segment for larger families or group travel in Cesano Boscone.
- On average, properties in Cesano Boscone are equipped to host 3.5 guests.
Cesano Boscone Airbnb Booking Patterns (2026): Available vs. Booked Days
Available Days Distribution
Booked Days Distribution
Booking Pattern Insights for Cesano Boscone
- The most common availability pattern in Cesano Boscone falls within the 271-366 days range, representing 63.2% of listings. This suggests many properties have significant open periods on their calendars.
- Approximately 100.0% of listings show high availability (181+ days open annually), indicating potential for increased bookings or specific owner usage patterns.
- For booked days, the 91-180 days range is most frequent in Cesano Boscone (47.4%), reflecting common guest stay durations or potential owner blocking patterns.
Cesano Boscone Airbnb Minimum Stay Requirements Analysis
Distribution of Listings by Minimum Night Requirement
1 Night
7 listings
36.8% of total
2 Nights
5 listings
26.3% of total
7-29 Nights
2 listings
10.5% of total
30+ Nights
5 listings
26.3% of total
Key Insights
- The most prevalent minimum stay requirement in Cesano Boscone is 1 Night, adopted by 36.8% of listings. This highlights the market's preference for shorter, flexible bookings.
- A strong majority (63.1%) of the Cesano Boscone Airbnb data shows acceptance of very short stays (1-2 nights), indicating a dynamic, high-turnover market.
- A significant segment (26.3%) caters to monthly stays (30+ nights) in Cesano Boscone, pointing to opportunities in the extended-stay market.
Recommendations
- Align with the market by considering a 1 Night minimum stay, as 36.8% of Cesano Boscone hosts use this setting.
- Explore offering discounts for stays of 30+ nights to attract the 26.3% of the market seeking extended stays.
- Adjust minimum nights based on seasonality – potentially shorter during low season and longer during peak demand periods in Cesano Boscone.
Cesano Boscone Airbnb Cancellation Policy Trends Analysis (2026)
Flexible
7 listings
36.8% of total
Moderate
4 listings
21.1% of total
Firm
8 listings
42.1% of total
Cancellation Policy Insights for Cesano Boscone
- The prevailing Airbnb cancellation policy trend in Cesano Boscone is Firm, used by 42.1% of listings.
- There's a relatively balanced mix between guest-friendly (57.9%) and stricter (42.1%) policies, offering choices for different guest needs.
Recommendations for Hosts
- Consider adopting a Firm policy to align with the 42.1% market standard in Cesano Boscone.
- Regularly review your cancellation policy against competitors and market demand shifts in Cesano Boscone.
Cesano Boscone STR Booking Lead Time Analysis (2026)
Average Booking Lead Time by Month
Booking Lead Time Insights for Cesano Boscone
- The overall average booking lead time for vacation rentals in Cesano Boscone is 26 days.
- Guests book furthest in advance for stays during September (average 36 days), likely coinciding with peak travel demand or local events.
- The shortest booking windows occur for stays in October (average 16 days), indicating more last-minute travel plans during this time.
- Seasonally, Spring (28 days avg.) sees the longest lead times, while Fall (23 days avg.) has the shortest, reflecting typical travel planning cycles.
Recommendations for Hosts
- Use the overall average lead time (26 days) as a baseline for your pricing and availability strategy in Cesano Boscone.
- Target marketing efforts for the Spring season well in advance (at least 28 days) to capture early planners.
- Monitor your own booking lead times against these Cesano Boscone averages to identify opportunities for dynamic pricing adjustments.
Popular & Essential Airbnb Amenities in Cesano Boscone (2026)
Amenity Prevalence
Amenity Insights for Cesano Boscone
- Essential amenities in Cesano Boscone that guests expect include: Kitchen, Heating, TV. Lacking these (any) could significantly impact bookings.
- Popular amenities like Dishes and silverware, Wifi, Hot water are common but not universal. Offering these can provide a competitive edge.
- Warning: Wifi is not universally provided but is considered essential globally. Ensure reliable Wifi is offered.
Recommendations for Hosts
- Ensure your listing includes all essential amenities for Cesano Boscone: Kitchen, Heating, TV.
- Consider adding popular differentiators like Dishes and silverware or Wifi to increase appeal.
- Highlight unique or less common amenities you offer (e.g., hot tub, dedicated workspace, EV charger) in your listing description and photos.
- Regularly check competitor amenities in Cesano Boscone to stay competitive.
Cesano Boscone Airbnb Guest Demographics & Profile Analysis (2026)
Guest Profile Summary for Cesano Boscone
- The typical guest profile for Airbnb in Cesano Boscone consists of a mix of domestic (43%) and international guests, with top international origins including France, typically belonging to the Post-2000s (Gen Z/Alpha) group (50%), primarily speaking English or Italian.
- Domestic travelers account for 43.1% of guests.
- Key international markets include Italy (43.1%) and France (13.8%).
- Top languages spoken are English (34.9%) followed by Italian (24.1%).
- A significant demographic segment is the Post-2000s (Gen Z/Alpha) group, representing 50% of guests.
Recommendations for Hosts
- Balance marketing efforts between domestic and international channels based on the guest mix.
- Tailor amenities and listing descriptions to appeal to the dominant Post-2000s (Gen Z/Alpha) demographic (e.g., highlight fast WiFi, smart home features, local guides).
- Highlight unique local experiences or amenities relevant to the primary guest profile.
- Consider seasonal promotions aligned with peak travel times for key origin markets.
Nearby Short-Term Rental Market Comparison
How does the Cesano Boscone Airbnb market stack up against its neighbors? Compare key performance metrics like average monthly revenue, ADR, and occupancy rates in surrounding areas to understand the broader regional STR landscape.
| Market | Active Properties | Monthly Revenue | Daily Rate | Avg. Occupancy |
|---|---|---|---|---|
| Brienzwiler | 11 | $7,335 | $514.27 | 60% |
| Ranco | 12 | $5,691 | $536.46 | 42% |
| Grindelwald | 513 | $5,587 | $396.62 | 56% |
| Laglio | 64 | $4,334 | $518.58 | 43% |
| Ingenbohl | 14 | $4,251 | $219.49 | 63% |
| Brienz (BE) | 157 | $4,232 | $331.88 | 50% |
| Flüelen | 11 | $3,911 | $313.02 | 57% |
| Schwanden bei Brienz | 21 | $3,891 | $254.22 | 63% |
| Cassinasco | 19 | $3,887 | $718.39 | 40% |
| Cossano Belbo | 15 | $3,763 | $326.53 | 36% |