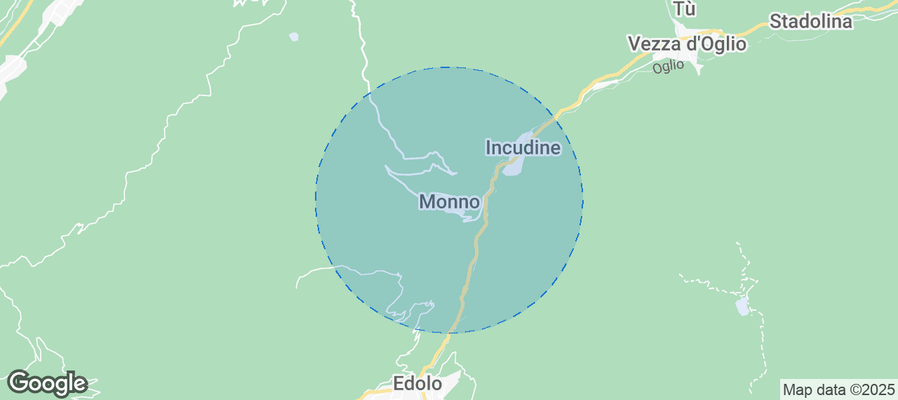
Monno Airbnb Market Analysis 2026: Short Term Rental Data & Vacation Rental Statistics in Lombardy, Italy
Is Airbnb profitable in Monno in 2026? Explore comprehensive Airbnb analytics for Monno, Lombardy, Italy to uncover income potential. This 2026 STR market report for Monno, based on AirROI data from August 2024 to July 2025, reveals key trends in the niche market of 19 active listings.
Whether you're considering an Airbnb investment in Monno, optimizing your existing vacation rental, or exploring rental arbitrage opportunities, understanding the Monno Airbnb data is crucial. Leveraging the low regulation environment is key to maximizing your short term rental income potential. Let's dive into the specifics.
Key Monno Airbnb Performance Metrics Overview
Monthly Airbnb Revenue Variations & Income Potential in Monno (2026)
Understanding the monthly revenue variations for Airbnb listings in Monno is key to maximizing your short term rental income potential. Seasonality significantly impacts earnings. Our analysis, based on data from the past 12 months, shows that the peak revenue month for STRs in Monno is typically August, while June often presents the lowest earnings, highlighting opportunities for strategic pricing adjustments during shoulder and low seasons. Explore the typical Airbnb income in Monno across different performance tiers:
- Best-in-class properties (Top 10%) achieve $3,039+ monthly, often utilizing dynamic pricing and superior guest experiences.
- Strong performing properties (Top 25%) earn $1,552 or more, indicating effective management and desirable locations/amenities.
- Typical properties (Median) generate around $923 per month, representing the average market performance.
- Entry-level properties (Bottom 25%) see earnings around $504, often with potential for optimization.
Average Monthly Airbnb Earnings Trend in Monno
Monno Airbnb Occupancy Rate Trends (2026)
Maximize your bookings by understanding the Monno STR occupancy trends. Seasonal demand shifts significantly influence how often properties are booked. Typically, Augustsees the highest demand (peak season occupancy), while June experiences the lowest (low season). Effective strategies, like adjusting minimum stays or offering promotions, can boost occupancy during slower periods. Here's how different property tiers perform in Monno:
- Best-in-class properties (Top 10%) achieve 50%+ occupancy, indicating high desirability and potentially optimized availability.
- Strong performing properties (Top 25%) maintain 34% or higher occupancy, suggesting good market fit and guest satisfaction.
- Typical properties (Median) have an occupancy rate around 21%.
- Entry-level properties (Bottom 25%) average 9% occupancy, potentially facing higher vacancy.
Average Monthly Occupancy Rate Trend in Monno
Average Daily Rate (ADR) Airbnb Trends in Monno (2026)
Effective short term rental pricing strategy in Monno involves understanding monthly ADR fluctuations. The Average Daily Rate (ADR) for Airbnb in Monno typically peaks in July and dips lowest during November. Leveraging Airbnb dynamic pricing tools or strategies based on this seasonality can significantly boost revenue. Here's a look at the typical nightly rates achieved:
- Best-in-class properties (Top 10%) command rates of $258+ per night, often due to premium features or locations.
- Strong performing properties (Top 25%) achieve nightly rates of $190 or more.
- Typical properties (Median) charge around $146 per night.
- Entry-level properties (Bottom 25%) earn around $103 per night.
Average Daily Rate (ADR) Trend by Month in Monno
Get Live Monno Market Intelligence 👇
Explore Real-time Analytics
Airbnb Seasonality Analysis & Trends in Monno (2025)
Peak Season (August, December, January)
- Revenue averages $2,652 per month
- Occupancy rates average 39.1%
- Daily rates average $161
Shoulder Season
- Revenue averages $969 per month
- Occupancy maintains around 23.3%
- Daily rates hold near $157
Low Season (April, May, June)
- Revenue drops to average $609 per month
- Occupancy decreases to average 14.7%
- Daily rates adjust to average $163
Seasonality Insights for Monno
- The Airbnb seasonality in Monno shows highly seasonal trends requiring careful strategy. While the sections above show seasonal averages, it's also insightful to look at the extremes:
- During the high season, the absolute peak month showcases Monno's highest earning potential, with monthly revenues capable of climbing to $3,085, occupancy reaching a high of 54.5%, and ADRs peaking at $172.
- Conversely, the slowest single month of the year, typically falling within the low season, marks the market's lowest point. In this month, revenue might dip to $550, occupancy could drop to 13.1%, and ADRs may adjust down to $145.
- Understanding both the seasonal averages and these monthly peaks and troughs in revenue, occupancy, and ADR is crucial for maximizing your Airbnb profit potential in Monno.
Seasonal Strategies for Maximizing Profit
- Peak Season: Maximize revenue through premium pricing and potentially longer minimum stays. Ensure high availability.
- Low Season: Offer competitive pricing, special promotions (e.g., extended stay discounts), and flexible cancellation policies. Target off-season travelers like remote workers or budget-conscious guests.
- Shoulder Seasons: Implement dynamic pricing that balances peak and low rates. Target weekend travelers or specific events. Offer slightly more flexible terms than peak season.
- Regularly analyze your own performance against these Monno seasonality benchmarks and adjust your pricing and availability strategy accordingly.
Best Areas for Airbnb Investment in Monno (2026)
Exploring the top neighborhoods for short-term rentals in Monno? This section highlights key areas, outlining why they are attractive for hosts and guests, along with notable local attractions. Consider these locations based on your target guest profile and investment strategy.
| Neighborhood / Area | Why Host Here? (Target Guests & Appeal) | Key Attractions & Landmarks |
|---|---|---|
| Monza City Center | Vibrant area characterized by historical architecture and proximity to cultural attractions. Ideal for tourists visiting Monza and the nearby Autodromo Nazionale Monza. | Monza Cathedral, Villa Reale di Monza, Monza Park, Piazza Trento e Trieste, Royal Villa of Monza |
| Seregno | A charming town close to Monza with a warm atmosphere. This area attracts visitors looking for a quieter stay with easy access to Monza and Milan. | Seregno Cathedral, Villa Park, Parco della Porada, Local restaurants and cafes |
| Lissone | Known for its artisan shops and beautiful parks, this town offers a local feel while being close to Monza, making it a great choice for families. | Parco di Monza, Villa Magatti, Artisan workshops, Local markets |
| Biassono | A small town with a rich history, great for nature enthusiasts. Close to the Monza Park, it offers a serene experience less than 5 km from the city. | Monza Park, San Martino Church, Historical town center, Nature trails |
| Desio | Offers a good mix of urban convenience and suburban charm. A great base for exploring Monza and its surrounding areas, popular with families and groups. | Desio Park, Ex-Church of San Giovanni Battista, Local shops, Cafes and restaurants |
| Vedano al Lambro | Surrounded by natural beauty and parks, this quaint area is perfect for tourists looking to enjoy outdoor activities while being near Monza. | Park of Monza, Monza Cathedral, Scenic walking and cycling paths, Nature reserves |
| Muggiò | A peaceful town with local charm and easy access to Monza. Known for its friendly atmosphere and nearby green spaces, it attracts family visitors. | Muggiò Park, Local artisanal shops, Family-friendly dining options, Cultural sites |
| Lesmo | Known for its beautiful nature and proximity to the racetrack, it’s a great location for visitors seeking a more rural experience near Monza. | Green areas for hiking, Local wineries, Cultural heritage sites, Bike trails |
Understanding Airbnb License Requirements & STR Laws in Monno (2026)
While Monno, Lombardy, Italy currently shows low STR regulations, specific Airbnb license requirements might still exist or change. Always verify the latest short term rental regulations and Airbnb license requirements directly with local government authorities for Monno to ensure full compliance before hosting.
(Source: AirROI data, 2026, finding no licensed listings among those analyzed)
Top Performing Airbnb Properties in Monno (2026)
Benchmark your potential! Explore examples of top-performing Airbnb properties in Monnobased on Trailing Twelve Month (TTM) revenue. Analyze their characteristics, revenue, occupancy rate, and ADR to understand what drives success in this market.

MONNO apartment mosaic design
Entire Place • 3 bedrooms

Spacious apartment in the mountains with fireplace
Entire Place • 3 bedrooms

Eden View
Entire Place • 2 bedrooms

Mon_Blu
Entire Place • 1 bedroom

Panoramic Apartment in MONNO - BS
Entire Place • 1 bedroom
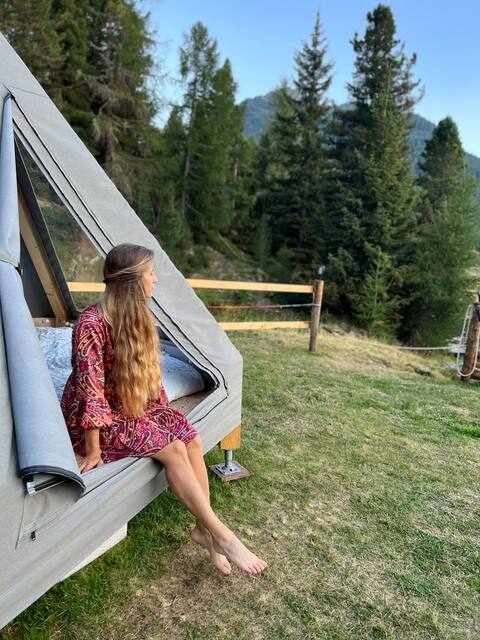
Teepee - Mortirolo Pass
Entire Place • 1 bedroom
Note: Performance varies based on location, size, amenities, seasonality, and management quality. Data reflects the past 12 months.
Top Performing Airbnb Hosts in Monno (2026)
Learn from the best! This table showcases top-performing Airbnb hosts in Monno based on the number of properties managed and estimated total revenue over the past year. Analyze their scale and performance metrics.
| Host Name | Properties | Grossing Revenue | Stay Reviews | Avg Rating |
|---|---|---|---|---|
| Ivan | 1 | $40,481 | 14 | 4.93/5.0 |
| Silvia | 4 | $20,737 | 41 | 4.84/5.0 |
| Denise | 1 | $15,904 | 37 | 4.81/5.0 |
| Ester | 3 | $13,001 | 30 | 4.92/5.0 |
| AC Gestione Alloggi Sas | 1 | $11,495 | 1 | Not Rated |
| Maria Luisa | 1 | $8,801 | 5 | 4.40/5.0 |
| Sebastiano | 1 | $8,547 | 33 | 4.79/5.0 |
| Riccardo | 1 | $8,521 | 2 | Not Rated |
| Gloria | 1 | $8,004 | 24 | 4.83/5.0 |
| Valentina | 1 | $4,719 | 1 | Not Rated |
Analyzing the strategies of top hosts, such as their property selection, pricing, and guest communication, can offer valuable lessons for optimizing your own Airbnb operations in Monno.
Dive Deeper: Advanced Monno STR Market Data (2026)
Ready to unlock more insights? AirROI provides access to advanced metrics and comprehensive Airbnb data for Monno. Explore detailed analytics beyond this report to refine your investment strategy, optimize pricing, and maximize your vacation rental profits.
Explore Advanced MetricsMonno Short-Term Rental Market Composition (2026): Property & Room Types
Room Type Distribution
Property Type Distribution
Market Composition Insights for Monno
- The Monno Airbnb market composition is heavily skewed towards Entire Home/Apt listings, which make up 78.9% of the 19 active rentals. This indicates strong guest preference for privacy and space.
- Looking at the property type distribution in Monno, Apartment/Condo properties are the most common (42.1%), reflecting the local real estate landscape.
- Houses represent a significant 15.8% portion, catering likely to families or larger groups.
- The presence of 5.3% Hotel/Boutique listings indicates integration with traditional hospitality.
Monno Airbnb Room Capacity Analysis (2026): Bedroom Distribution
Distribution of Listings by Number of Bedrooms
Room Capacity Insights for Monno
- The dominant room capacity in Monno is 1 bedroom listings, making up 52.6% of the market. This suggests a strong demand for properties suitable for couples or solo travelers.
- Together, 1 bedroom and 2 bedrooms properties represent 84.2% of the active Airbnb listings in Monno, indicating a high concentration in these sizes.
- With over half the market (52.6%) consisting of studios or 1-bedroom units, Monno is particularly well-suited for individuals or couples.
Monno Vacation Rental Guest Capacity Trends (2026)
Distribution of Listings by Guest Capacity
Guest Capacity Insights for Monno
- The most common guest capacity trend in Monno vacation rentals is listings accommodating 6 guests (36.8%). This suggests the primary traveler segment is likely larger groups.
- Properties designed for 6 guests and 4 guests dominate the Monno STR market, accounting for 63.1% of listings.
- 47.4% of properties accommodate 6+ guests, serving the market segment for larger families or group travel in Monno.
- On average, properties in Monno are equipped to host 4.6 guests.
Monno Airbnb Booking Patterns (2026): Available vs. Booked Days
Available Days Distribution
Booked Days Distribution
Booking Pattern Insights for Monno
- The most common availability pattern in Monno falls within the 271-366 days range, representing 89.5% of listings. This suggests many properties have significant open periods on their calendars.
- Approximately 100.0% of listings show high availability (181+ days open annually), indicating potential for increased bookings or specific owner usage patterns.
- For booked days, the 31-90 days range is most frequent in Monno (52.6%), reflecting common guest stay durations or potential owner blocking patterns.
Monno Airbnb Minimum Stay Requirements Analysis
Distribution of Listings by Minimum Night Requirement
1 Night
2 listings
11.1% of total
2 Nights
6 listings
33.3% of total
4-6 Nights
1 listings
5.6% of total
7-29 Nights
5 listings
27.8% of total
30+ Nights
4 listings
22.2% of total
Key Insights
- The most prevalent minimum stay requirement in Monno is 2 Nights, adopted by 33.3% of listings. This highlights the market's preference for shorter, flexible bookings.
- A significant segment (22.2%) caters to monthly stays (30+ nights) in Monno, pointing to opportunities in the extended-stay market.
Recommendations
- Align with the market by considering a 2 Nights minimum stay, as 33.3% of Monno hosts use this setting.
- If feasible, allowing 1-night stays, especially midweek or during low season, could capture last-minute bookings, as only 11.1% currently do.
- A 2-night minimum appears standard (33.3%). Consider this for weekends or peak periods.
- Explore offering discounts for stays of 30+ nights to attract the 22.2% of the market seeking extended stays.
- Adjust minimum nights based on seasonality – potentially shorter during low season and longer during peak demand periods in Monno.
Monno Airbnb Cancellation Policy Trends Analysis (2026)
Flexible
4 listings
22.2% of total
Moderate
8 listings
44.4% of total
Strict
6 listings
33.3% of total
Cancellation Policy Insights for Monno
- The prevailing Airbnb cancellation policy trend in Monno is Moderate, used by 44.4% of listings.
- There's a relatively balanced mix between guest-friendly (66.6%) and stricter (33.3%) policies, offering choices for different guest needs.
Recommendations for Hosts
- Consider adopting a Moderate policy to align with the 44.4% market standard in Monno.
- With 33.3% using Strict terms, this is a viable option in Monno, particularly for high-value properties or during peak demand periods.
- Regularly review your cancellation policy against competitors and market demand shifts in Monno.
Monno STR Booking Lead Time Analysis (2026)
Average Booking Lead Time by Month
Booking Lead Time Insights for Monno
- The overall average booking lead time for vacation rentals in Monno is 37 days.
- Guests book furthest in advance for stays during December (average 61 days), likely coinciding with peak travel demand or local events.
- The shortest booking windows occur for stays in April (average 4 days), indicating more last-minute travel plans during this time.
- Seasonally, Winter (41 days avg.) sees the longest lead times, while Spring (23 days avg.) has the shortest, reflecting typical travel planning cycles.
Recommendations for Hosts
- Use the overall average lead time (37 days) as a baseline for your pricing and availability strategy in Monno.
- For December stays, consider implementing length-of-stay discounts or slightly higher rates for bookings made less than 61 days out to capitalize on advance planning.
- During April, focus on last-minute booking availability and promotions, as guests book with very short notice (4 days avg.).
- Target marketing efforts for the Winter season well in advance (at least 41 days) to capture early planners.
- Monitor your own booking lead times against these Monno averages to identify opportunities for dynamic pricing adjustments.
Popular & Essential Airbnb Amenities in Monno (2026)
Amenity Prevalence
Amenity Insights for Monno
- Popular amenities like Hot water, Hair dryer, Kitchen are common but not universal. Offering these can provide a competitive edge.
Recommendations for Hosts
- Consider adding popular differentiators like Hot water or Hair dryer to increase appeal.
- Highlight unique or less common amenities you offer (e.g., hot tub, dedicated workspace, EV charger) in your listing description and photos.
- Regularly check competitor amenities in Monno to stay competitive.
Monno Airbnb Guest Demographics & Profile Analysis (2026)
Guest Profile Summary for Monno
- The typical guest profile for Airbnb in Monno consists of a mix of domestic (61%) and international guests, often arriving from nearby Milan, typically belonging to the Post-2000s (Gen Z/Alpha) group (50%), primarily speaking English or Italian.
- Domestic travelers account for 61.3% of guests.
- Key international markets include Italy (61.3%) and United Kingdom (9.7%).
- Top languages spoken are English (37.8%) followed by Italian (31.1%).
- A significant demographic segment is the Post-2000s (Gen Z/Alpha) group, representing 50% of guests.
Recommendations for Hosts
- Target domestic marketing efforts towards travelers from Milan and England.
- Tailor amenities and listing descriptions to appeal to the dominant Post-2000s (Gen Z/Alpha) demographic (e.g., highlight fast WiFi, smart home features, local guides).
- Highlight unique local experiences or amenities relevant to the primary guest profile.
- Consider seasonal promotions aligned with peak travel times for key origin markets.
Nearby Short-Term Rental Market Comparison
How does the Monno Airbnb market stack up against its neighbors? Compare key performance metrics like average monthly revenue, ADR, and occupancy rates in surrounding areas to understand the broader regional STR landscape.
| Market | Active Properties | Monthly Revenue | Daily Rate | Avg. Occupancy |
|---|---|---|---|---|
| Balderschwang | 10 | $4,949 | $295.71 | 57% |
| Moos in Passeier - Moso in Passiria | 17 | $4,931 | $594.63 | 28% |
| Urtijëi - St. Ulrich in Gröden - Ortisei | 165 | $4,558 | $662.76 | 41% |
| Laglio | 62 | $4,308 | $523.82 | 42% |
| Brand | 62 | $4,171 | $530.29 | 33% |
| Bayrischzell | 39 | $4,166 | $386.74 | 36% |
| Sala Comacina | 71 | $3,968 | $436.18 | 46% |
| Bürserberg | 42 | $3,818 | $332.31 | 41% |
| Sankt Pankraz - San Pancrazio | 16 | $3,547 | $647.34 | 21% |
| Brenzone sul Garda | 21 | $3,526 | $327.85 | 43% |