Plesio Airbnb Market Analysis 2026: Short Term Rental Data & Vacation Rental Statistics in Lombardy, Italy
Is Airbnb profitable in Plesio in 2026? Explore comprehensive Airbnb analytics for Plesio, Lombardy, Italy to uncover income potential. This 2026 STR market report for Plesio, based on AirROI data from February 2025 to January 2026, reveals key trends in the niche market of 49 active listings.
Whether you're considering an Airbnb investment in Plesio, optimizing your existing vacation rental, or exploring rental arbitrage opportunities, understanding the Plesio Airbnb data is crucial. Navigating the high regulation landscape is key to maximizing your short term rental income potential. Let's dive into the specifics.
Key Plesio Airbnb Performance Metrics Overview
Monthly Airbnb Revenue Variations & Income Potential in Plesio (2026)
Understanding the monthly revenue variations for Airbnb listings in Plesio is key to maximizing your short term rental income potential. Seasonality significantly impacts earnings. Our analysis, based on data from the past 12 months, shows that the peak revenue month for STRs in Plesio is typically August, while January often presents the lowest earnings, highlighting opportunities for strategic pricing adjustments during shoulder and low seasons. Explore the typical Airbnb income in Plesio across different performance tiers:
- Best-in-class properties (Top 10%) achieve $7,262+ monthly, often utilizing dynamic pricing and superior guest experiences.
- Strong performing properties (Top 25%) earn $3,095 or more, indicating effective management and desirable locations/amenities.
- Typical properties (Median) generate around $1,581 per month, representing the average market performance.
- Entry-level properties (Bottom 25%) see earnings around $936, often with potential for optimization.
Average Monthly Airbnb Earnings Trend in Plesio
Plesio Airbnb Occupancy Rate Trends (2026)
Maximize your bookings by understanding the Plesio STR occupancy trends. Seasonal demand shifts significantly influence how often properties are booked. Typically, Julysees the highest demand (peak season occupancy), while January experiences the lowest (low season). Effective strategies, like adjusting minimum stays or offering promotions, can boost occupancy during slower periods. Here's how different property tiers perform in Plesio:
- Best-in-class properties (Top 10%) achieve 74%+ occupancy, indicating high desirability and potentially optimized availability.
- Strong performing properties (Top 25%) maintain 56% or higher occupancy, suggesting good market fit and guest satisfaction.
- Typical properties (Median) have an occupancy rate around 36%.
- Entry-level properties (Bottom 25%) average 22% occupancy, potentially facing higher vacancy.
Average Monthly Occupancy Rate Trend in Plesio
Average Daily Rate (ADR) Airbnb Trends in Plesio (2026)
Effective short term rental pricing strategy in Plesio involves understanding monthly ADR fluctuations. The Average Daily Rate (ADR) for Airbnb in Plesio typically peaks in January and dips lowest during February. Leveraging Airbnb dynamic pricing tools or strategies based on this seasonality can significantly boost revenue. Here's a look at the typical nightly rates achieved:
- Best-in-class properties (Top 10%) command rates of $494+ per night, often due to premium features or locations.
- Strong performing properties (Top 25%) achieve nightly rates of $223 or more.
- Typical properties (Median) charge around $145 per night.
- Entry-level properties (Bottom 25%) earn around $100 per night.
Average Daily Rate (ADR) Trend by Month in Plesio
Get Live Plesio Market Intelligence 👇

Explore Real-time Analytics
Airbnb Seasonality Analysis & Trends in Plesio (2026)
Peak Season (August, July, February)
- Revenue averages $4,321 per month
- Occupancy rates average 56.3%
- Daily rates average $223
Shoulder Season
- Revenue averages $2,762 per month
- Occupancy maintains around 41.5%
- Daily rates hold near $228
Low Season (January, May, December)
- Revenue drops to average $1,528 per month
- Occupancy decreases to average 20.0%
- Daily rates adjust to average $246
Seasonality Insights for Plesio
- The Airbnb seasonality in Plesio shows highly seasonal trends requiring careful strategy. While the sections above show seasonal averages, it's also insightful to look at the extremes:
- During the high season, the absolute peak month showcases Plesio's highest earning potential, with monthly revenues capable of climbing to $4,811, occupancy reaching a high of 67.7%, and ADRs peaking at $261.
- Conversely, the slowest single month of the year, typically falling within the low season, marks the market's lowest point. In this month, revenue might dip to $791, occupancy could drop to 7.3%, and ADRs may adjust down to $202.
- Understanding both the seasonal averages and these monthly peaks and troughs in revenue, occupancy, and ADR is crucial for maximizing your Airbnb profit potential in Plesio.
Seasonal Strategies for Maximizing Profit
- Peak Season: Maximize revenue through premium pricing and potentially longer minimum stays. Ensure high availability.
- Low Season: Offer competitive pricing, special promotions (e.g., extended stay discounts), and flexible cancellation policies. Target off-season travelers like remote workers or budget-conscious guests.
- Shoulder Seasons: Implement dynamic pricing that balances peak and low rates. Target weekend travelers or specific events. Offer slightly more flexible terms than peak season.
- Regularly analyze your own performance against these Plesio seasonality benchmarks and adjust your pricing and availability strategy accordingly.
Best Areas for Airbnb Investment in Plesio (2026)
Exploring the top neighborhoods for short-term rentals in Plesio? This section highlights key areas, outlining why they are attractive for hosts and guests, along with notable local attractions. Consider these locations based on your target guest profile and investment strategy.
| Neighborhood / Area | Why Host Here? (Target Guests & Appeal) | Key Attractions & Landmarks |
|---|---|---|
| Plesio Town Center | A charming small town center with picturesque views and a beautiful lakeside. Ideal for tourists looking for a peaceful and authentic Italian experience close to Lake Como. | Lake Como, Church of San Giacomo, Plesio Castle, Local cafes and trattorias, Nature walking trails |
| Varenna | A beautiful village on the eastern shore of Lake Como, known for its scenic waterfront and romantic atmosphere. Perfect for visitors seeking stunning views and a quintessential Italian village feel. | Villa Monastero, Varenna's waterfront promenade, Castello di Vezio, Local boutiques, Beautiful gardens |
| Bellagio | Famous for its stunning views and vibrant gardens, Bellagio is one of the most popular destinations on Lake Como. It's great for Airbnb due to the high number of tourists year-round. | Villa Melzi, Piazza della Chiesa, Lakeside gardens, Shopping streets, Ferry services to other towns |
| Menaggio | Known for its lakeside promenade and historical buildings, Menaggio is a great base for exploring Lake Como. Attracts families and groups looking for outdoor activities. | Menaggio Golf Club, Lakeside park, Hiking trails, Charming Italian streets, Nearby hiking in the mountains |
| Lenno | A picturesque village famous for its tranquil atmosphere and stunning villas. Known for the beautiful Villa del Balbianello, it draws many cultural tourists. | Villa del Balbianello, Beaches along the lake, Historical sites, Local markets, Scenic hiking paths |
| Tremezzo | Located near some of the most beautiful villas and gardens on Lake Como. It attracts tourists who enjoy history, nature, and fantastic lake views. | Villa Carlotta, Tremezzo's waterfront promenade, Bellagio views, Local restaurants, Historical landmarks |
| Cadenabbia | Offers excellent ferry connections to many key locations on Lake Como. It's a strategic spot for travelers wanting to explore the region. | Ferry terminal, Beautiful gardens, Villas and museums, Scenic walking routes, Lakeside cafes |
| Rezzonico | A lesser-known gem with a calm atmosphere. Ideal for those seeking a more secluded and rural experience while still near Lake Como's attractions. | Rezzonico Castle, Quiet lake beaches, Nature trails, Small local museums, Scenic viewpoints |
Understanding Airbnb License Requirements & STR Laws in Plesio (2026)
Yes, Plesio, Lombardy, Italy enforces high STR regulations. Obtaining a license and ensuring compliance is almost certainly required according to current 2026 STR laws. Always verify the latest short term rental regulations and Airbnb license requirements directly with local government authorities for Plesio to ensure full compliance before hosting.
(Source: AirROI data, 2026, based on 98% licensed listings)
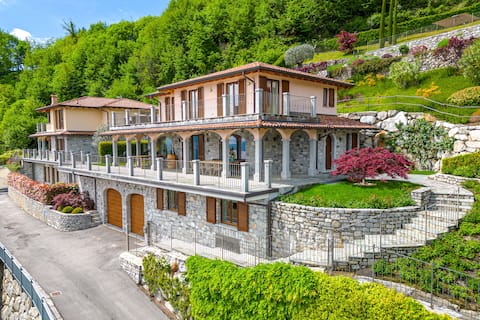
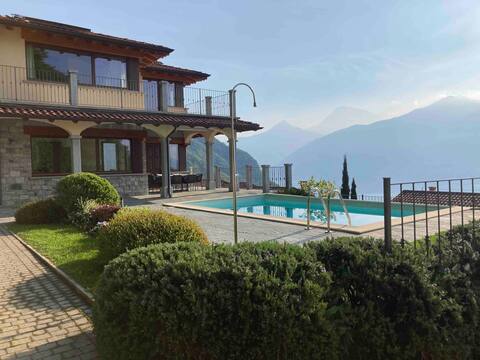
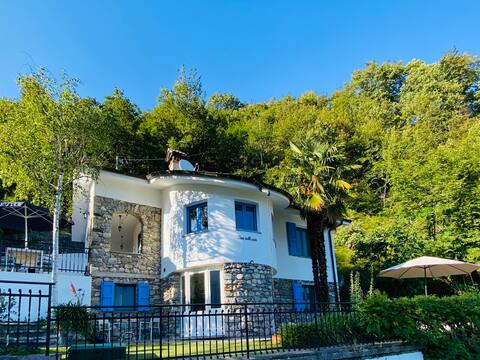
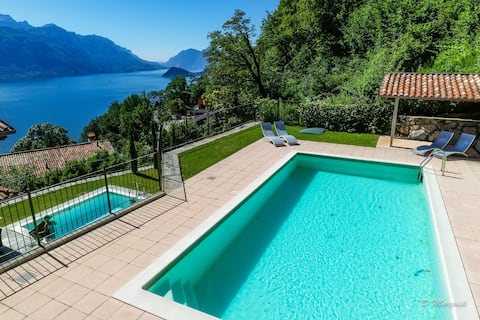
Top Performing Airbnb Properties in Plesio (2026)
Benchmark your potential! Explore examples of top-performing Airbnb properties in Plesiobased on Trailing Twelve Month (TTM) revenue. Analyze their characteristics, revenue, occupancy rate, and ADR to understand what drives success in this market.
Villa Rosa
Entire Place • 4 bedrooms
Villa Bellavista-Lakeview-Private pool & garden
Entire Place • 2 bedrooms
Villa with private pool and lake view in Bellagio
Entire Place • 3 bedrooms
The Petit Palais Villa
Entire Place • 3 bedrooms

Casa Laura with infinity pool and lake view
Entire Place • 2 bedrooms

Villa Aurelia
Entire Place • 3 bedrooms
Note: Performance varies based on location, size, amenities, seasonality, and management quality. Data reflects the past 12 months.
Top Performing Airbnb Hosts in Plesio (2026)
Learn from the best! This table showcases top-performing Airbnb hosts in Plesio based on the number of properties managed and estimated total revenue over the past year. Analyze their scale and performance metrics.
| Host Name | Properties | Grossing Revenue | Stay Reviews | Avg Rating |
|---|---|---|---|---|
| Lake Como | 7 | $201,546 | 128 | 4.09/5.0 |
| Vittoria LoveComo | 2 | $151,439 | 34 | 4.71/5.0 |
| Elena | 1 | $115,813 | 56 | 4.98/5.0 |
| Lucia | 5 | $69,850 | 206 | 4.90/5.0 |
| Christian | 1 | $65,420 | 55 | 4.85/5.0 |
| Alice | 1 | $39,747 | 128 | 4.76/5.0 |
| Fabio | 1 | $36,785 | 232 | 4.81/5.0 |
| Lorenza | 2 | $36,601 | 19 | 5.00/5.0 |
| Lisa - Interhome | 2 | $36,326 | 27 | 4.88/5.0 |
| Emanuele | 1 | $27,510 | 13 | 4.77/5.0 |
Analyzing the strategies of top hosts, such as their property selection, pricing, and guest communication, can offer valuable lessons for optimizing your own Airbnb operations in Plesio.
Dive Deeper: Advanced Plesio STR Market Data (2026)
Ready to unlock more insights? AirROI provides access to advanced metrics and comprehensive Airbnb data for Plesio. Explore detailed analytics beyond this report to refine your investment strategy, optimize pricing, and maximize your vacation rental profits.
Explore Advanced MetricsPlesio Short-Term Rental Market Composition (2026): Property & Room Types
Room Type Distribution
Property Type Distribution
Market Composition Insights for Plesio
- The Plesio Airbnb market composition is heavily skewed towards Entire Home/Apt listings, which make up 93.9% of the 49 active rentals. This indicates strong guest preference for privacy and space.
- Looking at the property type distribution in Plesio, House properties are the most common (53.1%), reflecting the local real estate landscape.
- Houses represent a significant 53.1% portion, catering likely to families or larger groups.
- Smaller segments like others, unique stays (combined 8.2%) offer potential for unique stay experiences.
Plesio Airbnb Room Capacity Analysis (2026): Bedroom Distribution
Distribution of Listings by Number of Bedrooms
Room Capacity Insights for Plesio
- The dominant room capacity in Plesio is 2 bedrooms listings, making up 42.9% of the market. This suggests a strong demand for properties suitable for couples or solo travelers.
- Together, 2 bedrooms and 1 bedroom properties represent 71.5% of the active Airbnb listings in Plesio, indicating a high concentration in these sizes.
Plesio Vacation Rental Guest Capacity Trends (2026)
Distribution of Listings by Guest Capacity
Guest Capacity Insights for Plesio
- The most common guest capacity trend in Plesio vacation rentals is listings accommodating 4 guests (36.7%). This suggests the primary traveler segment is likely small families or groups.
- Properties designed for 4 guests and 6 guests dominate the Plesio STR market, accounting for 53.0% of listings.
- 32.6% of properties accommodate 6+ guests, serving the market segment for larger families or group travel in Plesio.
- On average, properties in Plesio are equipped to host 4.4 guests.
Plesio Airbnb Booking Patterns (2026): Available vs. Booked Days
Available Days Distribution
Booked Days Distribution
Booking Pattern Insights for Plesio
- The most common availability pattern in Plesio falls within the 271-366 days range, representing 55.1% of listings. This suggests many properties have significant open periods on their calendars.
- Approximately 87.8% of listings show high availability (181+ days open annually), indicating potential for increased bookings or specific owner usage patterns.
- For booked days, the 31-90 days range is most frequent in Plesio (40.8%), reflecting common guest stay durations or potential owner blocking patterns.
- A notable 14.3% of properties secure long booking periods (181+ days booked per year), highlighting successful long-term rental strategies or significant owner usage.
Plesio Airbnb Minimum Stay Requirements Analysis
Distribution of Listings by Minimum Night Requirement
1 Night
4 listings
8.2% of total
2 Nights
4 listings
8.2% of total
3 Nights
3 listings
6.1% of total
4-6 Nights
4 listings
8.2% of total
7-29 Nights
1 listings
2% of total
30+ Nights
33 listings
67.3% of total
Key Insights
- The most prevalent minimum stay requirement in Plesio is 30+ Nights, adopted by 67.3% of listings. This highlights the market's preference for longer commitments.
- Very short stays (1-2 nights) are less common (16.4%), suggesting hosts prefer slightly longer bookings to optimize turnover.
- A significant segment (67.3%) caters to monthly stays (30+ nights) in Plesio, pointing to opportunities in the extended-stay market.
Recommendations
- Align with the market by considering a 30+ Nights minimum stay, as 67.3% of Plesio hosts use this setting.
- If feasible, allowing 1-night stays, especially midweek or during low season, could capture last-minute bookings, as only 8.2% currently do.
- Explore offering discounts for stays of 30+ nights to attract the 67.3% of the market seeking extended stays.
- Adjust minimum nights based on seasonality – potentially shorter during low season and longer during peak demand periods in Plesio.
Plesio Airbnb Cancellation Policy Trends Analysis (2026)
Super Strict 30 Days
7 listings
14.3% of total
Limited
1 listings
2% of total
Flexible
7 listings
14.3% of total
Moderate
22 listings
44.9% of total
Firm
12 listings
24.5% of total
Cancellation Policy Insights for Plesio
- The prevailing Airbnb cancellation policy trend in Plesio is Moderate, used by 44.9% of listings.
- There's a relatively balanced mix between guest-friendly (59.2%) and stricter (24.5%) policies, offering choices for different guest needs.
Recommendations for Hosts
- Consider adopting a Moderate policy to align with the 44.9% market standard in Plesio.
- Regularly review your cancellation policy against competitors and market demand shifts in Plesio.
Plesio STR Booking Lead Time Analysis (2026)
Average Booking Lead Time by Month
Booking Lead Time Insights for Plesio
- The overall average booking lead time for vacation rentals in Plesio is 70 days.
- Guests book furthest in advance for stays during August (average 96 days), likely coinciding with peak travel demand or local events.
- The shortest booking windows occur for stays in January (average 1 days), indicating more last-minute travel plans during this time.
- Seasonally, Summer (85 days avg.) sees the longest lead times, while Winter (32 days avg.) has the shortest, reflecting typical travel planning cycles.
Recommendations for Hosts
- Use the overall average lead time (70 days) as a baseline for your pricing and availability strategy in Plesio.
- For August stays, consider implementing length-of-stay discounts or slightly higher rates for bookings made less than 96 days out to capitalize on advance planning.
- During January, focus on last-minute booking availability and promotions, as guests book with very short notice (1 days avg.).
- Target marketing efforts for the Summer season well in advance (at least 85 days) to capture early planners.
- Monitor your own booking lead times against these Plesio averages to identify opportunities for dynamic pricing adjustments.
Popular & Essential Airbnb Amenities in Plesio (2026)
Amenity Prevalence
Amenity Insights for Plesio
- Essential amenities in Plesio that guests expect include: Kitchen, Dishes and silverware, Hangers, Bed linens. Lacking these (any) could significantly impact bookings.
- Popular amenities like Hair dryer, Wifi, Oven are common but not universal. Offering these can provide a competitive edge.
- Warning: Wifi is not universally provided but is considered essential globally. Ensure reliable Wifi is offered.
Recommendations for Hosts
- Ensure your listing includes all essential amenities for Plesio: Kitchen, Dishes and silverware, Hangers, Bed linens.
- Prioritize adding missing essentials: Kitchen, Dishes and silverware, Hangers, Bed linens.
- Consider adding popular differentiators like Hair dryer or Wifi to increase appeal.
- Highlight unique or less common amenities you offer (e.g., hot tub, dedicated workspace, EV charger) in your listing description and photos.
- Regularly check competitor amenities in Plesio to stay competitive.
Plesio Airbnb Guest Demographics & Profile Analysis (2026)
Guest Profile Summary for Plesio
- The typical guest profile for Airbnb in Plesio consists of predominantly international visitors (98%), with top international origins including Germany, typically belonging to the Post-2000s (Gen Z/Alpha) group (50%), primarily speaking English or French.
- Domestic travelers account for 1.7% of guests.
- Key international markets include France (30.5%) and Germany (18.2%).
- Top languages spoken are English (44%) followed by French (17.8%).
- A significant demographic segment is the Post-2000s (Gen Z/Alpha) group, representing 50% of guests.
Recommendations for Hosts
- Focus marketing internationally, particularly towards travelers from Germany.
- Tailor amenities and listing descriptions to appeal to the dominant Post-2000s (Gen Z/Alpha) demographic (e.g., highlight fast WiFi, smart home features, local guides).
- Highlight unique local experiences or amenities relevant to the primary guest profile.
- Consider seasonal promotions aligned with peak travel times for key origin markets.
Nearby Short-Term Rental Market Comparison
How does the Plesio Airbnb market stack up against its neighbors? Compare key performance metrics like average monthly revenue, ADR, and occupancy rates in surrounding areas to understand the broader regional STR landscape.
| Market | Active Properties | Monthly Revenue | Daily Rate | Avg. Occupancy |
|---|---|---|---|---|
| Brienzwiler | 11 | $7,335 | $514.27 | 60% |
| Ranco | 12 | $5,691 | $536.46 | 42% |
| Grindelwald | 513 | $5,587 | $396.62 | 56% |
| Bassersdorf | 16 | $5,337 | $431.59 | 46% |
| Balderschwang | 10 | $5,253 | $304.03 | 58% |
| Vitznau | 31 | $4,688 | $425.43 | 45% |
| Laglio | 64 | $4,334 | $518.58 | 43% |
| Lucerne | 329 | $4,288 | $310.00 | 53% |
| Ingenbohl | 14 | $4,251 | $219.49 | 63% |
| Brienz (BE) | 157 | $4,232 | $331.88 | 50% |