Vercana Airbnb Market Analysis 2026: Short Term Rental Data & Vacation Rental Statistics in Lombardy, Italy
Is Airbnb profitable in Vercana in 2026? Explore comprehensive Airbnb analytics for Vercana, Lombardy, Italy to uncover income potential. This 2026 STR market report for Vercana, based on AirROI data from February 2025 to January 2026, reveals key trends in the niche market of 80 active listings.
Whether you're considering an Airbnb investment in Vercana, optimizing your existing vacation rental, or exploring rental arbitrage opportunities, understanding the Vercana Airbnb data is crucial. Navigating the high regulation landscape is key to maximizing your short term rental income potential. Let's dive into the specifics.
Key Vercana Airbnb Performance Metrics Overview
Monthly Airbnb Revenue Variations & Income Potential in Vercana (2026)
Understanding the monthly revenue variations for Airbnb listings in Vercana is key to maximizing your short term rental income potential. Seasonality significantly impacts earnings. Our analysis, based on data from the past 12 months, shows that the peak revenue month for STRs in Vercana is typically August, while December often presents the lowest earnings, highlighting opportunities for strategic pricing adjustments during shoulder and low seasons. Explore the typical Airbnb income in Vercana across different performance tiers:
- Best-in-class properties (Top 10%) achieve $4,678+ monthly, often utilizing dynamic pricing and superior guest experiences.
- Strong performing properties (Top 25%) earn $3,191 or more, indicating effective management and desirable locations/amenities.
- Typical properties (Median) generate around $2,015 per month, representing the average market performance.
- Entry-level properties (Bottom 25%) see earnings around $1,090, often with potential for optimization.
Average Monthly Airbnb Earnings Trend in Vercana
Vercana Airbnb Occupancy Rate Trends (2026)
Maximize your bookings by understanding the Vercana STR occupancy trends. Seasonal demand shifts significantly influence how often properties are booked. Typically, Augustsees the highest demand (peak season occupancy), while December experiences the lowest (low season). Effective strategies, like adjusting minimum stays or offering promotions, can boost occupancy during slower periods. Here's how different property tiers perform in Vercana:
- Best-in-class properties (Top 10%) achieve 78%+ occupancy, indicating high desirability and potentially optimized availability.
- Strong performing properties (Top 25%) maintain 61% or higher occupancy, suggesting good market fit and guest satisfaction.
- Typical properties (Median) have an occupancy rate around 35%.
- Entry-level properties (Bottom 25%) average 19% occupancy, potentially facing higher vacancy.
Average Monthly Occupancy Rate Trend in Vercana
Average Daily Rate (ADR) Airbnb Trends in Vercana (2026)
Effective short term rental pricing strategy in Vercana involves understanding monthly ADR fluctuations. The Average Daily Rate (ADR) for Airbnb in Vercana typically peaks in August and dips lowest during December. Leveraging Airbnb dynamic pricing tools or strategies based on this seasonality can significantly boost revenue. Here's a look at the typical nightly rates achieved:
- Best-in-class properties (Top 10%) command rates of $343+ per night, often due to premium features or locations.
- Strong performing properties (Top 25%) achieve nightly rates of $270 or more.
- Typical properties (Median) charge around $178 per night.
- Entry-level properties (Bottom 25%) earn around $132 per night.
Average Daily Rate (ADR) Trend by Month in Vercana
Get Live Vercana Market Intelligence 👇

Explore Real-time Analytics
Airbnb Seasonality Analysis & Trends in Vercana (2026)
Peak Season (August, July, June)
- Revenue averages $3,850 per month
- Occupancy rates average 57.7%
- Daily rates average $234
Shoulder Season
- Revenue averages $2,229 per month
- Occupancy maintains around 39.1%
- Daily rates hold near $200
Low Season (January, February, December)
- Revenue drops to average $1,134 per month
- Occupancy decreases to average 22.8%
- Daily rates adjust to average $188
Seasonality Insights for Vercana
- The Airbnb seasonality in Vercana shows highly seasonal trends requiring careful strategy. While the sections above show seasonal averages, it's also insightful to look at the extremes:
- During the high season, the absolute peak month showcases Vercana's highest earning potential, with monthly revenues capable of climbing to $4,434, occupancy reaching a high of 66.5%, and ADRs peaking at $240.
- Conversely, the slowest single month of the year, typically falling within the low season, marks the market's lowest point. In this month, revenue might dip to $739, occupancy could drop to 13.4%, and ADRs may adjust down to $185.
- Understanding both the seasonal averages and these monthly peaks and troughs in revenue, occupancy, and ADR is crucial for maximizing your Airbnb profit potential in Vercana.
Seasonal Strategies for Maximizing Profit
- Peak Season: Maximize revenue through premium pricing and potentially longer minimum stays. Ensure high availability.
- Low Season: Offer competitive pricing, special promotions (e.g., extended stay discounts), and flexible cancellation policies. Target off-season travelers like remote workers or budget-conscious guests.
- Shoulder Seasons: Implement dynamic pricing that balances peak and low rates. Target weekend travelers or specific events. Offer slightly more flexible terms than peak season.
- Regularly analyze your own performance against these Vercana seasonality benchmarks and adjust your pricing and availability strategy accordingly.
Best Areas for Airbnb Investment in Vercana (2026)
Exploring the top neighborhoods for short-term rentals in Vercana? This section highlights key areas, outlining why they are attractive for hosts and guests, along with notable local attractions. Consider these locations based on your target guest profile and investment strategy.
| Neighborhood / Area | Why Host Here? (Target Guests & Appeal) | Key Attractions & Landmarks |
|---|---|---|
| Lake Como | Stunning lake views and picturesque towns make Lake Como a top destination for tourists seeking relaxation and beauty. Ideal for those looking to enjoy water activities, hiking, and gourmet dining. | Bellagio, Varenna, Como town, Villa Carlotta, Castello di Vezio |
| Vercana Village | Charming village atmosphere with close-knit community vibes. Great for families and those seeking a peaceful getaway, with easy access to local amenities and hiking trails. | Vercana Church, Local markets, Nature walks, Scenic viewpoints |
| Dongo | Rich in history and culture, Dongo is a serene location for those looking for a quiet escape, with excellent access to water sports and hiking. | Dongo Castle, San Giovanni Church, Lakeside parks |
| Gravedona | Hospitable town with rich historical heritage and scenic waterfront. A hotspot for tourists wanting to explore Lake Como's Northern region, ideal for both leisure and adventure. | Abbey of Piona, Gravedona Beach, Fort Fuentes |
| Colico | Popular for its beach resorts and outdoor activities. It attracts sports enthusiasts looking for sailing, windsurfing, and hiking in the surrounding mountains. | Colico Beach, Fort Montecchio, Sailing School |
| Menaggio | A beautiful town with excellent panoramic views and a blend of modern amenities and historical charm. Great for tourists wanting to explore the lake or enjoy local restaurants. | Menaggio Lakefront, Menaggio Golf Club, Public gardens |
| Tremezzo | Known for its lovely villas and gardens, Tremezzo offers a romantic ambiance, perfect for couples and visitors seeking scenic beauty and local culture. | Villa Carlotta, Tremezzo's waterfront, Local wine tasting |
| Lenno | Famous for the stunning Villa del Balbianello and beautiful lakeshore, it attracts tourists who appreciate both history and natural beauty. | Villa del Balbianello, Lenno Beach, Local hiking trails |
Understanding Airbnb License Requirements & STR Laws in Vercana (2026)
Yes, Vercana, Lombardy, Italy enforces high STR regulations. Obtaining a license and ensuring compliance is almost certainly required according to current 2026 STR laws. Always verify the latest short term rental regulations and Airbnb license requirements directly with local government authorities for Vercana to ensure full compliance before hosting.
(Source: AirROI data, 2026, based on 94% licensed listings)
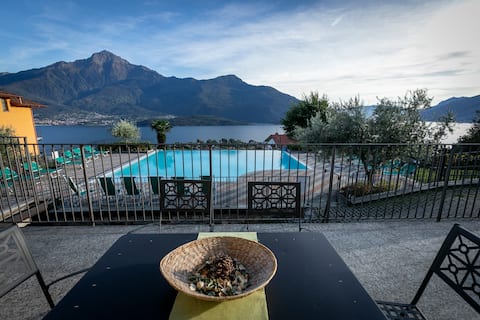
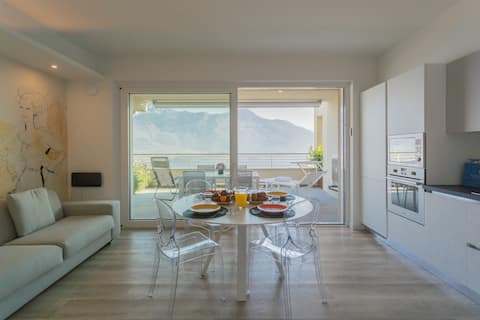
Top Performing Airbnb Properties in Vercana (2026)
Benchmark your potential! Explore examples of top-performing Airbnb properties in Vercanabased on Trailing Twelve Month (TTM) revenue. Analyze their characteristics, revenue, occupancy rate, and ADR to understand what drives success in this market.
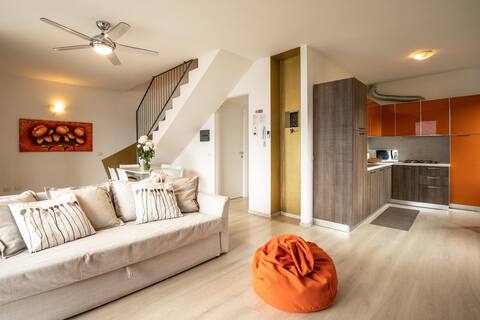
An apartment for all the family.
Entire Place • 4 bedrooms

Lakeside retreat private terrace stunning views
Entire Place • 3 bedrooms

Ca’ belee, spacious 3 br apartment with balcony by
Entire Place • 3 bedrooms
Lake Como - Residence La Collina - Maurino & Leccino
Entire Place • 3 bedrooms

Superiore by Interhome
Entire Place • 2 bedrooms
Valarin Milano, Luxury Apartment SPA & Wellness
Entire Place • 2 bedrooms
Note: Performance varies based on location, size, amenities, seasonality, and management quality. Data reflects the past 12 months.
Top Performing Airbnb Hosts in Vercana (2026)
Learn from the best! This table showcases top-performing Airbnb hosts in Vercana based on the number of properties managed and estimated total revenue over the past year. Analyze their scale and performance metrics.
| Host Name | Properties | Grossing Revenue | Stay Reviews | Avg Rating |
|---|---|---|---|---|
| Mauro E Paola | 18 | $224,365 | 174 | 4.62/5.0 |
| Il Giardino Di Lory | 7 | $224,254 | 220 | 4.92/5.0 |
| Rent All Como | 7 | $115,538 | 159 | 4.89/5.0 |
| Katja - Interhome | 9 | $112,374 | 133 | 4.50/5.0 |
| Alessandra - Interhome | 5 | $94,641 | 42 | 4.60/5.0 |
| Sofia | 2 | $77,228 | 147 | 4.82/5.0 |
| Alessandra | 2 | $59,166 | 136 | 4.92/5.0 |
| Niki | 2 | $56,341 | 251 | 4.96/5.0 |
| Vita SRL | 1 | $45,901 | 34 | 4.76/5.0 |
| Sinead | 3 | $34,939 | 89 | 4.88/5.0 |
Analyzing the strategies of top hosts, such as their property selection, pricing, and guest communication, can offer valuable lessons for optimizing your own Airbnb operations in Vercana.
Dive Deeper: Advanced Vercana STR Market Data (2026)
Ready to unlock more insights? AirROI provides access to advanced metrics and comprehensive Airbnb data for Vercana. Explore detailed analytics beyond this report to refine your investment strategy, optimize pricing, and maximize your vacation rental profits.
Explore Advanced MetricsVercana Short-Term Rental Market Composition (2026): Property & Room Types
Room Type Distribution
Property Type Distribution
Market Composition Insights for Vercana
- The Vercana Airbnb market composition is heavily skewed towards Entire Home/Apt listings, which make up 98.8% of the 80 active rentals. This indicates strong guest preference for privacy and space.
- Looking at the property type distribution in Vercana, Apartment/Condo properties are the most common (77.5%), reflecting the local real estate landscape.
- Houses represent a significant 18.8% portion, catering likely to families or larger groups.
- Smaller segments like outdoor/unique, hotel/boutique (combined 3.8%) offer potential for unique stay experiences.
Vercana Airbnb Room Capacity Analysis (2026): Bedroom Distribution
Distribution of Listings by Number of Bedrooms
Room Capacity Insights for Vercana
- The dominant room capacity in Vercana is 2 bedrooms listings, making up 61.3% of the market. This suggests a strong demand for properties suitable for couples or solo travelers.
- Together, 2 bedrooms and 1 bedroom properties represent 83.8% of the active Airbnb listings in Vercana, indicating a high concentration in these sizes.
Vercana Vacation Rental Guest Capacity Trends (2026)
Distribution of Listings by Guest Capacity
Guest Capacity Insights for Vercana
- The most common guest capacity trend in Vercana vacation rentals is listings accommodating 6 guests (30%). This suggests the primary traveler segment is likely larger groups.
- Properties designed for 6 guests and 4 guests dominate the Vercana STR market, accounting for 58.7% of listings.
- 45.1% of properties accommodate 6+ guests, serving the market segment for larger families or group travel in Vercana.
- On average, properties in Vercana are equipped to host 5.0 guests.
Vercana Airbnb Booking Patterns (2026): Available vs. Booked Days
Available Days Distribution
Booked Days Distribution
Booking Pattern Insights for Vercana
- The most common availability pattern in Vercana falls within the 271-366 days range, representing 62.5% of listings. This suggests many properties have significant open periods on their calendars.
- Approximately 90.0% of listings show high availability (181+ days open annually), indicating potential for increased bookings or specific owner usage patterns.
- For booked days, the 31-90 days range is most frequent in Vercana (37.5%), reflecting common guest stay durations or potential owner blocking patterns.
- A notable 11.3% of properties secure long booking periods (181+ days booked per year), highlighting successful long-term rental strategies or significant owner usage.
Vercana Airbnb Minimum Stay Requirements Analysis
Distribution of Listings by Minimum Night Requirement
1 Night
3 listings
3.8% of total
2 Nights
4 listings
5% of total
3 Nights
2 listings
2.5% of total
4-6 Nights
25 listings
31.3% of total
7-29 Nights
2 listings
2.5% of total
30+ Nights
44 listings
55% of total
Key Insights
- The most prevalent minimum stay requirement in Vercana is 30+ Nights, adopted by 55% of listings. This highlights the market's preference for longer commitments.
- Very short stays (1-2 nights) are less common (8.8%), suggesting hosts prefer slightly longer bookings to optimize turnover.
- A significant segment (55%) caters to monthly stays (30+ nights) in Vercana, pointing to opportunities in the extended-stay market.
Recommendations
- Align with the market by considering a 30+ Nights minimum stay, as 55% of Vercana hosts use this setting.
- If feasible, allowing 1-night stays, especially midweek or during low season, could capture last-minute bookings, as only 3.8% currently do.
- Explore offering discounts for stays of 30+ nights to attract the 55% of the market seeking extended stays.
- Adjust minimum nights based on seasonality – potentially shorter during low season and longer during peak demand periods in Vercana.
Vercana Airbnb Cancellation Policy Trends Analysis (2026)
Super Strict 30 Days
6 listings
7.5% of total
Limited
1 listings
1.3% of total
Flexible
11 listings
13.8% of total
Moderate
23 listings
28.7% of total
Firm
39 listings
48.8% of total
Cancellation Policy Insights for Vercana
- The prevailing Airbnb cancellation policy trend in Vercana is Firm, used by 48.8% of listings.
- There's a relatively balanced mix between guest-friendly (42.5%) and stricter (48.8%) policies, offering choices for different guest needs.
Recommendations for Hosts
- Consider adopting a Firm policy to align with the 48.8% market standard in Vercana.
- Regularly review your cancellation policy against competitors and market demand shifts in Vercana.
Vercana STR Booking Lead Time Analysis (2026)
Average Booking Lead Time by Month
Booking Lead Time Insights for Vercana
- The overall average booking lead time for vacation rentals in Vercana is 83 days.
- Guests book furthest in advance for stays during January (average 167 days), likely coinciding with peak travel demand or local events.
- The shortest booking windows occur for stays in February (average 69 days), indicating more last-minute travel plans during this time.
- Seasonally, Winter (104 days avg.) sees the longest lead times, while Spring (78 days avg.) has the shortest, reflecting typical travel planning cycles.
Recommendations for Hosts
- Use the overall average lead time (83 days) as a baseline for your pricing and availability strategy in Vercana.
- For January stays, consider implementing length-of-stay discounts or slightly higher rates for bookings made less than 167 days out to capitalize on advance planning.
- Target marketing efforts for the Winter season well in advance (at least 104 days) to capture early planners.
- Monitor your own booking lead times against these Vercana averages to identify opportunities for dynamic pricing adjustments.
Popular & Essential Airbnb Amenities in Vercana (2026)
Amenity Prevalence
Amenity Insights for Vercana
- Essential amenities in Vercana that guests expect include: Hot water, Kitchen, Refrigerator, Wifi, TV, Dishes and silverware, Cooking basics. Lacking these (any) could significantly impact bookings.
- Popular amenities like Patio or balcony, Coffee maker, Heating are common but not universal. Offering these can provide a competitive edge.
Recommendations for Hosts
- Ensure your listing includes all essential amenities for Vercana: Hot water, Kitchen, Refrigerator, Wifi, TV, Dishes and silverware, Cooking basics.
- Prioritize adding missing essentials: Kitchen, Refrigerator, Wifi, TV, Dishes and silverware, Cooking basics.
- Consider adding popular differentiators like Patio or balcony or Coffee maker to increase appeal.
- Highlight unique or less common amenities you offer (e.g., hot tub, dedicated workspace, EV charger) in your listing description and photos.
- Regularly check competitor amenities in Vercana to stay competitive.
Vercana Airbnb Guest Demographics & Profile Analysis (2026)
Guest Profile Summary for Vercana
- The typical guest profile for Airbnb in Vercana consists of predominantly international visitors (98%), with top international origins including France, typically belonging to the Post-2000s (Gen Z/Alpha) group (50%), primarily speaking English or German.
- Domestic travelers account for 2.2% of guests.
- Key international markets include Germany (43.9%) and France (13.3%).
- Top languages spoken are English (39.3%) followed by German (23.4%).
- A significant demographic segment is the Post-2000s (Gen Z/Alpha) group, representing 50% of guests.
Recommendations for Hosts
- Focus marketing internationally, particularly towards travelers from France.
- Tailor amenities and listing descriptions to appeal to the dominant Post-2000s (Gen Z/Alpha) demographic (e.g., highlight fast WiFi, smart home features, local guides).
- Highlight unique local experiences or amenities relevant to the primary guest profile.
- Consider seasonal promotions aligned with peak travel times for key origin markets.
Nearby Short-Term Rental Market Comparison
How does the Vercana Airbnb market stack up against its neighbors? Compare key performance metrics like average monthly revenue, ADR, and occupancy rates in surrounding areas to understand the broader regional STR landscape.
| Market | Active Properties | Monthly Revenue | Daily Rate | Avg. Occupancy |
|---|---|---|---|---|
| Brienzwiler | 11 | $7,335 | $514.27 | 60% |
| Ranco | 12 | $5,691 | $536.46 | 42% |
| Grindelwald | 513 | $5,587 | $396.62 | 56% |
| Bassersdorf | 16 | $5,337 | $431.59 | 46% |
| Balderschwang | 10 | $5,253 | $304.03 | 58% |
| Vitznau | 31 | $4,688 | $425.43 | 45% |
| Laglio | 64 | $4,334 | $518.58 | 43% |
| Lucerne | 329 | $4,288 | $310.00 | 53% |
| Ingenbohl | 14 | $4,251 | $219.49 | 63% |
| Brienz (BE) | 157 | $4,232 | $331.88 | 50% |