Acqui Terme Airbnb Market Analysis 2026: Short Term Rental Data & Vacation Rental Statistics in Piedmont, Italy
Is Airbnb profitable in Acqui Terme in 2026? Explore comprehensive Airbnb analytics for Acqui Terme, Piedmont, Italy to uncover income potential. This 2026 STR market report for Acqui Terme, based on AirROI data from February 2025 to January 2026, reveals key trends in the niche market of 52 active listings.
Whether you're considering an Airbnb investment in Acqui Terme, optimizing your existing vacation rental, or exploring rental arbitrage opportunities, understanding the Acqui Terme Airbnb data is crucial. Navigating the high regulation landscape is key to maximizing your short term rental income potential. Let's dive into the specifics.
Key Acqui Terme Airbnb Performance Metrics Overview
Monthly Airbnb Revenue Variations & Income Potential in Acqui Terme (2026)
Understanding the monthly revenue variations for Airbnb listings in Acqui Terme is key to maximizing your short term rental income potential. Seasonality significantly impacts earnings. Our analysis, based on data from the past 12 months, shows that the peak revenue month for STRs in Acqui Terme is typically August, while January often presents the lowest earnings, highlighting opportunities for strategic pricing adjustments during shoulder and low seasons. Explore the typical Airbnb income in Acqui Terme across different performance tiers:
- Best-in-class properties (Top 10%) achieve $3,304+ monthly, often utilizing dynamic pricing and superior guest experiences.
- Strong performing properties (Top 25%) earn $1,868 or more, indicating effective management and desirable locations/amenities.
- Typical properties (Median) generate around $1,113 per month, representing the average market performance.
- Entry-level properties (Bottom 25%) see earnings around $572, often with potential for optimization.
Average Monthly Airbnb Earnings Trend in Acqui Terme
Acqui Terme Airbnb Occupancy Rate Trends (2026)
Maximize your bookings by understanding the Acqui Terme STR occupancy trends. Seasonal demand shifts significantly influence how often properties are booked. Typically, Julysees the highest demand (peak season occupancy), while January experiences the lowest (low season). Effective strategies, like adjusting minimum stays or offering promotions, can boost occupancy during slower periods. Here's how different property tiers perform in Acqui Terme:
- Best-in-class properties (Top 10%) achieve 79%+ occupancy, indicating high desirability and potentially optimized availability.
- Strong performing properties (Top 25%) maintain 58% or higher occupancy, suggesting good market fit and guest satisfaction.
- Typical properties (Median) have an occupancy rate around 32%.
- Entry-level properties (Bottom 25%) average 18% occupancy, potentially facing higher vacancy.
Average Monthly Occupancy Rate Trend in Acqui Terme
Average Daily Rate (ADR) Airbnb Trends in Acqui Terme (2026)
Effective short term rental pricing strategy in Acqui Terme involves understanding monthly ADR fluctuations. The Average Daily Rate (ADR) for Airbnb in Acqui Terme typically peaks in September and dips lowest during March. Leveraging Airbnb dynamic pricing tools or strategies based on this seasonality can significantly boost revenue. Here's a look at the typical nightly rates achieved:
- Best-in-class properties (Top 10%) command rates of $284+ per night, often due to premium features or locations.
- Strong performing properties (Top 25%) achieve nightly rates of $135 or more.
- Typical properties (Median) charge around $102 per night.
- Entry-level properties (Bottom 25%) earn around $82 per night.
Average Daily Rate (ADR) Trend by Month in Acqui Terme
Get Live Acqui Terme Market Intelligence 👇

Explore Real-time Analytics
Airbnb Seasonality Analysis & Trends in Acqui Terme (2026)
Peak Season (August, July, October)
- Revenue averages $2,734 per month
- Occupancy rates average 48.9%
- Daily rates average $151
Shoulder Season
- Revenue averages $1,546 per month
- Occupancy maintains around 37.9%
- Daily rates hold near $142
Low Season (January, February, December)
- Revenue drops to average $839 per month
- Occupancy decreases to average 30.1%
- Daily rates adjust to average $146
Seasonality Insights for Acqui Terme
- The Airbnb seasonality in Acqui Terme shows highly seasonal trends requiring careful strategy. While the sections above show seasonal averages, it's also insightful to look at the extremes:
- During the high season, the absolute peak month showcases Acqui Terme's highest earning potential, with monthly revenues capable of climbing to $3,017, occupancy reaching a high of 55.3%, and ADRs peaking at $158.
- Conversely, the slowest single month of the year, typically falling within the low season, marks the market's lowest point. In this month, revenue might dip to $542, occupancy could drop to 19.5%, and ADRs may adjust down to $125.
- Understanding both the seasonal averages and these monthly peaks and troughs in revenue, occupancy, and ADR is crucial for maximizing your Airbnb profit potential in Acqui Terme.
Seasonal Strategies for Maximizing Profit
- Peak Season: Maximize revenue through premium pricing and potentially longer minimum stays. Ensure high availability.
- Low Season: Offer competitive pricing, special promotions (e.g., extended stay discounts), and flexible cancellation policies. Target off-season travelers like remote workers or budget-conscious guests.
- Shoulder Seasons: Implement dynamic pricing that balances peak and low rates. Target weekend travelers or specific events. Offer slightly more flexible terms than peak season.
- Regularly analyze your own performance against these Acqui Terme seasonality benchmarks and adjust your pricing and availability strategy accordingly.
Best Areas for Airbnb Investment in Acqui Terme (2026)
Exploring the top neighborhoods for short-term rentals in Acqui Terme? This section highlights key areas, outlining why they are attractive for hosts and guests, along with notable local attractions. Consider these locations based on your target guest profile and investment strategy.
| Neighborhood / Area | Why Host Here? (Target Guests & Appeal) | Key Attractions & Landmarks |
|---|---|---|
| Centro Storico | The historical center of Acqui Terme, known for its charming streets, thermal baths, and historical architecture. Attracts tourists looking for culture and relaxation. | Acqui Terme Cathedral, Thermal baths, Piazza Italia, Roman ruins, Castello dei Paleologi |
| Thermal Baths Area | This area is famous for its therapeutic thermal springs and wellness centers. A great spot for health-conscious travelers and spa enthusiasts. | Nuove Terme, Terme di Acqui, Piazza San Guido, Parco delle Terme, Health and wellness facilities |
| Colline Acquesi | The surrounding hills offer stunning views and are perfect for nature lovers and wine enthusiasts. A unique experience for guests wanting a rural getaway. | Local vineyards, Hiking trails, Agriturismos, Breathtaking landscapes, Wine tasting events |
| Local Wineries | Piedmont is renowned for its wine production. Staying near local wineries allows guests to indulge in wine tours and tastings. | Barbera d'Asti, Moscato d'Asti, Wine tours, Cooking classes, Trattorias |
| Viale della Repubblica | A picturesque area with local shops and cafes, providing a more local experience away from the busy tourist spots. | Local markets, Cafes, Boutiques, Quiet streets, Cultural experiences |
| Parco della Rimembranza | A lovely park area perfect for families and outdoor activities. It attracts visitors looking for relaxation and nature. | Walking paths, Playground, Picnic areas, Views over the town, Birdwatching |
| Food and Wine Festivals | Acqui hosts several food and wine festivals, making it a vibrant season for culinary tourists and food lovers. | Gastronomic festivals, Local food markets, Wine tastings, Cooking workshops, Gastronomic tours |
| Accommodation for Business Travelers | With an increase in business travelers visiting for local industries and events, providing accommodations for corporate stays is essential. | Proximity to business centers, Conference facilities, Modern amenities, Networking opportunities, Easy transport links |
Understanding Airbnb License Requirements & STR Laws in Acqui Terme (2026)
Yes, Acqui Terme, Piedmont, Italy enforces high STR regulations. Obtaining a license and ensuring compliance is almost certainly required according to current 2026 STR laws. Always verify the latest short term rental regulations and Airbnb license requirements directly with local government authorities for Acqui Terme to ensure full compliance before hosting.
(Source: AirROI data, 2026, based on 88% licensed listings)
Top Performing Airbnb Properties in Acqui Terme (2026)
Benchmark your potential! Explore examples of top-performing Airbnb properties in Acqui Termebased on Trailing Twelve Month (TTM) revenue. Analyze their characteristics, revenue, occupancy rate, and ADR to understand what drives success in this market.
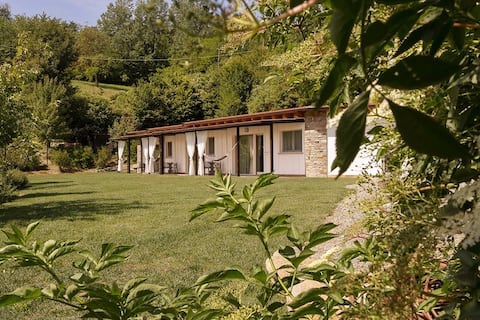
Entire home - Sambuco innamorato
Entire Place • 6 bedrooms

Costa Dei Platani - Casa Dei Platani, with swimming pool.
Entire Place • 6 bedrooms
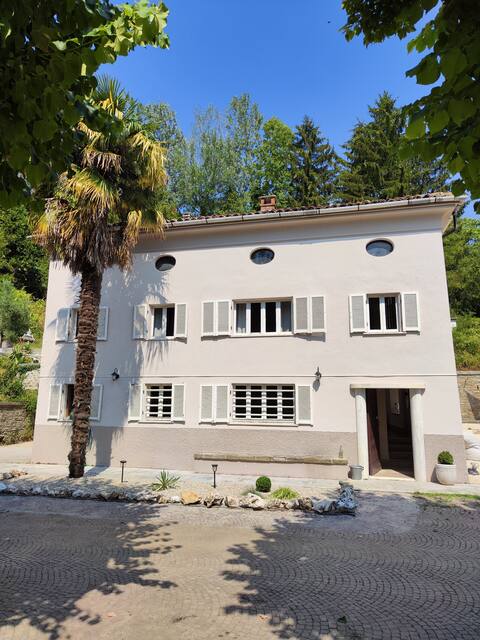
Casa Farfalle, villa in Piedmont
Entire Place • 4 bedrooms

Verdmont unlimited, Unesco
Private Room • 5 bedrooms

House with pool I Tre Tramonti
Entire Place • 2 bedrooms

Costa dei Platani, Casa Dei Tigli. Swimming pool
Entire Place • 3 bedrooms
Note: Performance varies based on location, size, amenities, seasonality, and management quality. Data reflects the past 12 months.
Top Performing Airbnb Hosts in Acqui Terme (2026)
Learn from the best! This table showcases top-performing Airbnb hosts in Acqui Terme based on the number of properties managed and estimated total revenue over the past year. Analyze their scale and performance metrics.
| Host Name | Properties | Grossing Revenue | Stay Reviews | Avg Rating |
|---|---|---|---|---|
| Elena | 1 | $105,742 | 5 | 5.00/5.0 |
| Loredana | 2 | $84,398 | 39 | 4.77/5.0 |
| Ariella | 6 | $83,285 | 352 | 4.73/5.0 |
| Sara | 3 | $39,109 | 73 | 4.82/5.0 |
| Emanuela | 2 | $38,472 | 410 | 4.97/5.0 |
| Solveig | 1 | $37,008 | 20 | 4.55/5.0 |
| Barbara | 1 | $29,235 | 24 | 4.96/5.0 |
| Martina | 2 | $27,920 | 11 | 5.00/5.0 |
| Sergi | 1 | $21,566 | 40 | 4.95/5.0 |
| Cassiopia | 1 | $18,890 | 50 | 4.86/5.0 |
Analyzing the strategies of top hosts, such as their property selection, pricing, and guest communication, can offer valuable lessons for optimizing your own Airbnb operations in Acqui Terme.
Dive Deeper: Advanced Acqui Terme STR Market Data (2026)
Ready to unlock more insights? AirROI provides access to advanced metrics and comprehensive Airbnb data for Acqui Terme. Explore detailed analytics beyond this report to refine your investment strategy, optimize pricing, and maximize your vacation rental profits.
Explore Advanced MetricsAcqui Terme Short-Term Rental Market Composition (2026): Property & Room Types
Room Type Distribution
Property Type Distribution
Market Composition Insights for Acqui Terme
- The Acqui Terme Airbnb market composition is heavily skewed towards Entire Home/Apt listings, which make up 90.4% of the 52 active rentals. This indicates strong guest preference for privacy and space.
- Looking at the property type distribution in Acqui Terme, Apartment/Condo properties are the most common (63.5%), reflecting the local real estate landscape.
- Houses represent a significant 21.2% portion, catering likely to families or larger groups.
- The presence of 9.6% Hotel/Boutique listings indicates integration with traditional hospitality.
- Smaller segments like unique stays, others (combined 5.7%) offer potential for unique stay experiences.
Acqui Terme Airbnb Room Capacity Analysis (2026): Bedroom Distribution
Distribution of Listings by Number of Bedrooms
Room Capacity Insights for Acqui Terme
- The dominant room capacity in Acqui Terme is 1 bedroom listings, making up 50% of the market. This suggests a strong demand for properties suitable for couples or solo travelers.
- Together, 1 bedroom and 2 bedrooms properties represent 75.0% of the active Airbnb listings in Acqui Terme, indicating a high concentration in these sizes.
Acqui Terme Vacation Rental Guest Capacity Trends (2026)
Distribution of Listings by Guest Capacity
Guest Capacity Insights for Acqui Terme
- The most common guest capacity trend in Acqui Terme vacation rentals is listings accommodating 4 guests (26.9%). This suggests the primary traveler segment is likely small families or groups.
- Properties designed for 4 guests and 3 guests dominate the Acqui Terme STR market, accounting for 44.2% of listings.
- 25.0% of properties accommodate 6+ guests, serving the market segment for larger families or group travel in Acqui Terme.
- On average, properties in Acqui Terme are equipped to host 4.4 guests.
Acqui Terme Airbnb Booking Patterns (2026): Available vs. Booked Days
Available Days Distribution
Booked Days Distribution
Booking Pattern Insights for Acqui Terme
- The most common availability pattern in Acqui Terme falls within the 271-366 days range, representing 51.9% of listings. This suggests many properties have significant open periods on their calendars.
- Approximately 90.4% of listings show high availability (181+ days open annually), indicating potential for increased bookings or specific owner usage patterns.
- For booked days, the 91-180 days range is most frequent in Acqui Terme (38.5%), reflecting common guest stay durations or potential owner blocking patterns.
- A notable 13.4% of properties secure long booking periods (181+ days booked per year), highlighting successful long-term rental strategies or significant owner usage.
Acqui Terme Airbnb Minimum Stay Requirements Analysis
Distribution of Listings by Minimum Night Requirement
1 Night
14 listings
26.9% of total
2 Nights
10 listings
19.2% of total
3 Nights
4 listings
7.7% of total
4-6 Nights
3 listings
5.8% of total
7-29 Nights
3 listings
5.8% of total
30+ Nights
18 listings
34.6% of total
Key Insights
- The most prevalent minimum stay requirement in Acqui Terme is 30+ Nights, adopted by 34.6% of listings. This highlights the market's preference for longer commitments.
- A significant segment (34.6%) caters to monthly stays (30+ nights) in Acqui Terme, pointing to opportunities in the extended-stay market.
Recommendations
- Align with the market by considering a 30+ Nights minimum stay, as 34.6% of Acqui Terme hosts use this setting.
- If feasible, allowing 1-night stays, especially midweek or during low season, could capture last-minute bookings, as only 26.9% currently do.
- Explore offering discounts for stays of 30+ nights to attract the 34.6% of the market seeking extended stays.
- Adjust minimum nights based on seasonality – potentially shorter during low season and longer during peak demand periods in Acqui Terme.
Acqui Terme Airbnb Cancellation Policy Trends Analysis (2026)
Super Strict 30 Days
1 listings
1.9% of total
Flexible
19 listings
36.5% of total
Moderate
18 listings
34.6% of total
Firm
9 listings
17.3% of total
Strict
5 listings
9.6% of total
Cancellation Policy Insights for Acqui Terme
- The prevailing Airbnb cancellation policy trend in Acqui Terme is Flexible, used by 36.5% of listings.
- The market strongly favors guest-friendly terms, with 71.1% of listings offering Flexible or Moderate policies. This suggests guests in Acqui Terme may expect booking flexibility.
- Strict cancellation policies are quite rare (9.6%), potentially making listings with this policy less competitive unless justified by high demand or property type.
Recommendations for Hosts
- Consider adopting a Flexible policy to align with the 36.5% market standard in Acqui Terme.
- Using a Strict policy might deter some guests, as only 9.6% of listings use it. Evaluate if potential revenue protection outweighs possible lower booking rates.
- Regularly review your cancellation policy against competitors and market demand shifts in Acqui Terme.
Acqui Terme STR Booking Lead Time Analysis (2026)
Average Booking Lead Time by Month
Booking Lead Time Insights for Acqui Terme
- The overall average booking lead time for vacation rentals in Acqui Terme is 47 days.
- Guests book furthest in advance for stays during July (average 69 days), likely coinciding with peak travel demand or local events.
- The shortest booking windows occur for stays in January (average 17 days), indicating more last-minute travel plans during this time.
- Seasonally, Summer (63 days avg.) sees the longest lead times, while Winter (26 days avg.) has the shortest, reflecting typical travel planning cycles.
Recommendations for Hosts
- Use the overall average lead time (47 days) as a baseline for your pricing and availability strategy in Acqui Terme.
- For July stays, consider implementing length-of-stay discounts or slightly higher rates for bookings made less than 69 days out to capitalize on advance planning.
- Target marketing efforts for the Summer season well in advance (at least 63 days) to capture early planners.
- Monitor your own booking lead times against these Acqui Terme averages to identify opportunities for dynamic pricing adjustments.
Popular & Essential Airbnb Amenities in Acqui Terme (2026)
Amenity Prevalence
Amenity Insights for Acqui Terme
- Popular amenities like Hot water, Bed linens, Wifi are common but not universal. Offering these can provide a competitive edge.
- Warning: Wifi is not universally provided but is considered essential globally. Ensure reliable Wifi is offered.
Recommendations for Hosts
- Consider adding popular differentiators like Hot water or Bed linens to increase appeal.
- Highlight unique or less common amenities you offer (e.g., hot tub, dedicated workspace, EV charger) in your listing description and photos.
- Regularly check competitor amenities in Acqui Terme to stay competitive.
Acqui Terme Airbnb Guest Demographics & Profile Analysis (2026)
Guest Profile Summary for Acqui Terme
- The typical guest profile for Airbnb in Acqui Terme consists of predominantly international visitors (73%), with top international origins including France, typically belonging to the Post-2000s (Gen Z/Alpha) group (50%), primarily speaking English or French.
- Domestic travelers account for 26.6% of guests.
- Key international markets include Italy (26.6%) and France (11.8%).
- Top languages spoken are English (33.3%) followed by French (16.3%).
- A significant demographic segment is the Post-2000s (Gen Z/Alpha) group, representing 50% of guests.
Recommendations for Hosts
- Focus marketing internationally, particularly towards travelers from France.
- Tailor amenities and listing descriptions to appeal to the dominant Post-2000s (Gen Z/Alpha) demographic (e.g., highlight fast WiFi, smart home features, local guides).
- Highlight unique local experiences or amenities relevant to the primary guest profile.
- Consider seasonal promotions aligned with peak travel times for key origin markets.
Nearby Short-Term Rental Market Comparison
How does the Acqui Terme Airbnb market stack up against its neighbors? Compare key performance metrics like average monthly revenue, ADR, and occupancy rates in surrounding areas to understand the broader regional STR landscape.
| Market | Active Properties | Monthly Revenue | Daily Rate | Avg. Occupancy |
|---|---|---|---|---|
| Ranco | 12 | $5,691 | $536.46 | 42% |
| Monteu Roero | 12 | $5,184 | $403.07 | 41% |
| Laglio | 64 | $4,334 | $518.58 | 43% |
| Saint-Jean-Cap-Ferrat | 114 | $3,894 | $465.00 | 44% |
| Cassinasco | 19 | $3,887 | $718.39 | 40% |
| Cossano Belbo | 15 | $3,763 | $326.53 | 36% |
| Portofino | 77 | $3,585 | $509.42 | 38% |
| Bellagio | 461 | $3,466 | $325.87 | 49% |
| Vico Morcote | 12 | $3,347 | $317.07 | 46% |
| Sala Comacina | 73 | $3,332 | $451.20 | 46% |