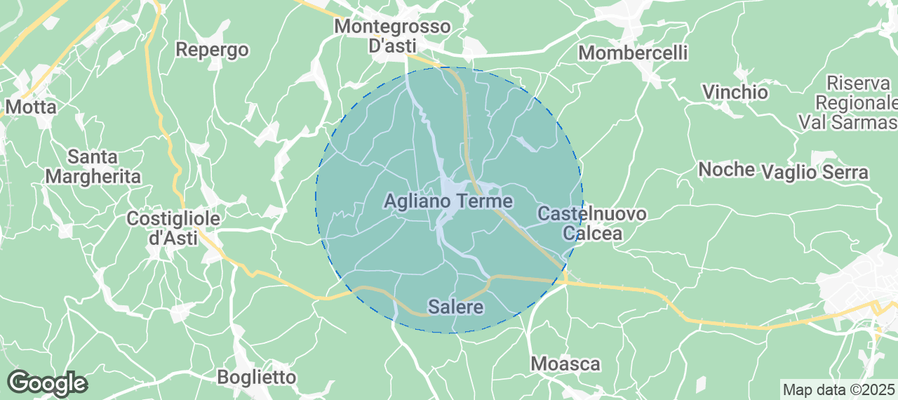
Agliano Terme Airbnb Market Analysis 2026: Short Term Rental Data & Vacation Rental Statistics in Piedmont, Italy
Is Airbnb profitable in Agliano Terme in 2026? Explore comprehensive Airbnb analytics for Agliano Terme, Piedmont, Italy to uncover income potential. This 2026 STR market report for Agliano Terme, based on AirROI data from February 2025 to January 2026, reveals key trends in the niche market of 23 active listings.
Whether you're considering an Airbnb investment in Agliano Terme, optimizing your existing vacation rental, or exploring rental arbitrage opportunities, understanding the Agliano Terme Airbnb data is crucial. Navigating the high regulation landscape is key to maximizing your short term rental income potential. Let's dive into the specifics.
Key Agliano Terme Airbnb Performance Metrics Overview
Monthly Airbnb Revenue Variations & Income Potential in Agliano Terme (2026)
Understanding the monthly revenue variations for Airbnb listings in Agliano Terme is key to maximizing your short term rental income potential. Seasonality significantly impacts earnings. Our analysis, based on data from the past 12 months, shows that the peak revenue month for STRs in Agliano Terme is typically August, while March often presents the lowest earnings, highlighting opportunities for strategic pricing adjustments during shoulder and low seasons. Explore the typical Airbnb income in Agliano Terme across different performance tiers:
- Best-in-class properties (Top 10%) achieve $5,321+ monthly, often utilizing dynamic pricing and superior guest experiences.
- Strong performing properties (Top 25%) earn $1,991 or more, indicating effective management and desirable locations/amenities.
- Typical properties (Median) generate around $1,151 per month, representing the average market performance.
- Entry-level properties (Bottom 25%) see earnings around $671, often with potential for optimization.
Average Monthly Airbnb Earnings Trend in Agliano Terme
Agliano Terme Airbnb Occupancy Rate Trends (2026)
Maximize your bookings by understanding the Agliano Terme STR occupancy trends. Seasonal demand shifts significantly influence how often properties are booked. Typically, Augustsees the highest demand (peak season occupancy), while March experiences the lowest (low season). Effective strategies, like adjusting minimum stays or offering promotions, can boost occupancy during slower periods. Here's how different property tiers perform in Agliano Terme:
- Best-in-class properties (Top 10%) achieve 54%+ occupancy, indicating high desirability and potentially optimized availability.
- Strong performing properties (Top 25%) maintain 42% or higher occupancy, suggesting good market fit and guest satisfaction.
- Typical properties (Median) have an occupancy rate around 30%.
- Entry-level properties (Bottom 25%) average 20% occupancy, potentially facing higher vacancy.
Average Monthly Occupancy Rate Trend in Agliano Terme
Average Daily Rate (ADR) Airbnb Trends in Agliano Terme (2026)
Effective short term rental pricing strategy in Agliano Terme involves understanding monthly ADR fluctuations. The Average Daily Rate (ADR) for Airbnb in Agliano Terme typically peaks in October and dips lowest during March. Leveraging Airbnb dynamic pricing tools or strategies based on this seasonality can significantly boost revenue. Here's a look at the typical nightly rates achieved:
- Best-in-class properties (Top 10%) command rates of $400+ per night, often due to premium features or locations.
- Strong performing properties (Top 25%) achieve nightly rates of $149 or more.
- Typical properties (Median) charge around $114 per night.
- Entry-level properties (Bottom 25%) earn around $95 per night.
Average Daily Rate (ADR) Trend by Month in Agliano Terme
Get Live Agliano Terme Market Intelligence 👇
Explore Real-time Analytics
Airbnb Seasonality Analysis & Trends in Agliano Terme (2026)
Peak Season (August, July, June)
- Revenue averages $3,410 per month
- Occupancy rates average 51.8%
- Daily rates average $171
Shoulder Season
- Revenue averages $1,398 per month
- Occupancy maintains around 26.8%
- Daily rates hold near $160
Low Season (March, October, December)
- Revenue drops to average $730 per month
- Occupancy decreases to average 20.1%
- Daily rates adjust to average $165
Seasonality Insights for Agliano Terme
- The Airbnb seasonality in Agliano Terme shows highly seasonal trends requiring careful strategy. While the sections above show seasonal averages, it's also insightful to look at the extremes:
- During the high season, the absolute peak month showcases Agliano Terme's highest earning potential, with monthly revenues capable of climbing to $3,905, occupancy reaching a high of 64.1%, and ADRs peaking at $179.
- Conversely, the slowest single month of the year, typically falling within the low season, marks the market's lowest point. In this month, revenue might dip to $441, occupancy could drop to 14.6%, and ADRs may adjust down to $141.
- Understanding both the seasonal averages and these monthly peaks and troughs in revenue, occupancy, and ADR is crucial for maximizing your Airbnb profit potential in Agliano Terme.
Seasonal Strategies for Maximizing Profit
- Peak Season: Maximize revenue through premium pricing and potentially longer minimum stays. Ensure high availability.
- Low Season: Offer competitive pricing, special promotions (e.g., extended stay discounts), and flexible cancellation policies. Target off-season travelers like remote workers or budget-conscious guests.
- Shoulder Seasons: Implement dynamic pricing that balances peak and low rates. Target weekend travelers or specific events. Offer slightly more flexible terms than peak season.
- Regularly analyze your own performance against these Agliano Terme seasonality benchmarks and adjust your pricing and availability strategy accordingly.
Best Areas for Airbnb Investment in Agliano Terme (2026)
Exploring the top neighborhoods for short-term rentals in Agliano Terme? This section highlights key areas, outlining why they are attractive for hosts and guests, along with notable local attractions. Consider these locations based on your target guest profile and investment strategy.
| Neighborhood / Area | Why Host Here? (Target Guests & Appeal) | Key Attractions & Landmarks |
|---|---|---|
| Agliano Terme Center | The heart of Agliano Terme, known for its quaint charm and proximity to wellness spas. Ideal for visitors seeking a peaceful retreat and local Italian culture. | Thermal Baths, Church of San Secondo, Wine Tasting Tours, Local Restaurants, Parks |
| Vineyards of Monferrato | Surrounded by picturesque vineyards and rolling hills, this area appeals to wine lovers and nature enthusiasts. | Monferrato Vineyards, Wine Cellars, Scenic Hiking Trails, Local Festivals |
| Castiglione Tinella | Close to Agliano and known for its stunning views and wine production, offering a rural escape that attracts tourists looking for adventure and relaxation. | Grape Harvesting Tours, Wine Tasting, Beautiful Landscapes |
| Agliano Thermal Baths | A specialized area known for its luxurious thermal baths, attracting visitors for wellness and relaxation. | Spa Services, Thermal Water Treatments, Natural Reserves |
| Valle Belbo | A stunning valley offering beautiful landscapes, perfect for outdoor activities like hiking and biking, and attracting nature lovers. | Nature Trails, Photography Spots, Flora and Fauna |
| Local Agriturismos | Rural farm stays that provide an authentic Italian experience, popular among families and food enthusiasts seeking fresh local produce. | Farm Tours, Cooking Classes, Local Cuisine |
| Nearby Asti | A short drive away, Asti offers a historic city vibe with famous wine festivals and cultural events throughout the year, making it attractive to tourists. | Asti Cathedral, Palio di Asti, Wine Markets, Historic Architecture |
| Piccolo Teatro della Commedia | A local theater that hosts cultural events and performances, appealing to tourists interested in arts and local traditions. | Theater Performances, Cultural Events, Local Artisans |
Understanding Airbnb License Requirements & STR Laws in Agliano Terme (2026)
Yes, Agliano Terme, Piedmont, Italy enforces high STR regulations. Obtaining a license and ensuring compliance is almost certainly required according to current 2026 STR laws. Always verify the latest short term rental regulations and Airbnb license requirements directly with local government authorities for Agliano Terme to ensure full compliance before hosting.
(Source: AirROI data, 2026, based on 70% licensed listings)
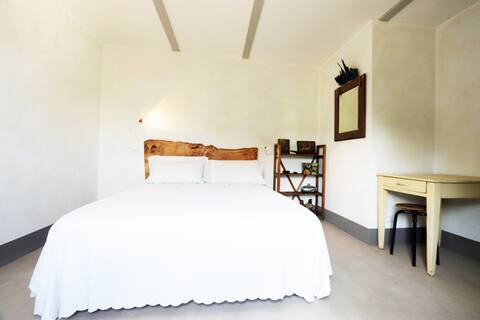
Top Performing Airbnb Properties in Agliano Terme (2026)
Benchmark your potential! Explore examples of top-performing Airbnb properties in Agliano Termebased on Trailing Twelve Month (TTM) revenue. Analyze their characteristics, revenue, occupancy rate, and ADR to understand what drives success in this market.
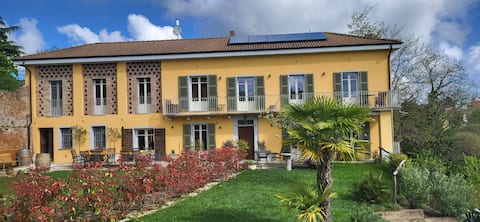
Casa Ginia, big house, 10 people
Entire Place • 5 bedrooms
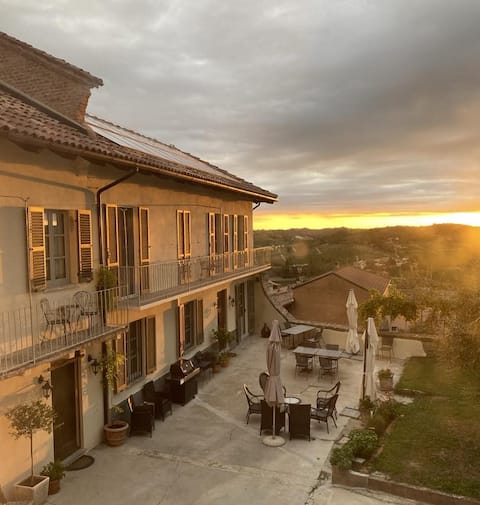
Home in Agliano Terme
Entire Place • 3 bedrooms

Relax in a spacious apartment above a winery
Entire Place • 2 bedrooms
B&B Tricudai
Private Room • 2 bedrooms

"El Girasù" Accommodation
Entire Place • 2 bedrooms

Apartment "Terrazza", 2-4 Persons, 70m²
Entire Place • 2 bedrooms
Note: Performance varies based on location, size, amenities, seasonality, and management quality. Data reflects the past 12 months.
Top Performing Airbnb Hosts in Agliano Terme (2026)
Learn from the best! This table showcases top-performing Airbnb hosts in Agliano Terme based on the number of properties managed and estimated total revenue over the past year. Analyze their scale and performance metrics.
| Host Name | Properties | Grossing Revenue | Stay Reviews | Avg Rating |
|---|---|---|---|---|
| Harry | 3 | $78,761 | 50 | 4.99/5.0 |
| Christina Tefre | 1 | $54,787 | 3 | 5.00/5.0 |
| Eliana | 4 | $44,616 | 143 | 5.00/5.0 |
| Maria | 4 | $34,847 | 80 | 4.82/5.0 |
| Renata | 1 | $24,814 | 154 | 4.97/5.0 |
| Jan | 3 | $11,965 | 29 | 4.87/5.0 |
| Davide | 1 | $11,006 | 13 | 5.00/5.0 |
| Sweet Dreams | 1 | $9,908 | 20 | 4.80/5.0 |
| Novasol | 1 | $8,028 | 3 | 2.67/5.0 |
| Katja | 1 | $853 | 6 | 5.00/5.0 |
Analyzing the strategies of top hosts, such as their property selection, pricing, and guest communication, can offer valuable lessons for optimizing your own Airbnb operations in Agliano Terme.
Dive Deeper: Advanced Agliano Terme STR Market Data (2026)
Ready to unlock more insights? AirROI provides access to advanced metrics and comprehensive Airbnb data for Agliano Terme. Explore detailed analytics beyond this report to refine your investment strategy, optimize pricing, and maximize your vacation rental profits.
Explore Advanced MetricsAgliano Terme Short-Term Rental Market Composition (2026): Property & Room Types
Room Type Distribution
Property Type Distribution
Market Composition Insights for Agliano Terme
- The Agliano Terme Airbnb market composition is heavily skewed towards Entire Home/Apt listings, which make up 78.3% of the 23 active rentals. This indicates strong guest preference for privacy and space.
- Looking at the property type distribution in Agliano Terme, Apartment/Condo properties are the most common (39.1%), reflecting the local real estate landscape.
- Houses represent a significant 30.4% portion, catering likely to families or larger groups.
- The presence of 21.7% Hotel/Boutique listings indicates integration with traditional hospitality.
Agliano Terme Airbnb Room Capacity Analysis (2026): Bedroom Distribution
Distribution of Listings by Number of Bedrooms
Room Capacity Insights for Agliano Terme
- The dominant room capacity in Agliano Terme is 2 bedrooms listings, making up 43.5% of the market. This suggests a strong demand for properties suitable for couples or solo travelers.
- Together, 2 bedrooms and 1 bedroom properties represent 73.9% of the active Airbnb listings in Agliano Terme, indicating a high concentration in these sizes.
Agliano Terme Vacation Rental Guest Capacity Trends (2026)
Distribution of Listings by Guest Capacity
Guest Capacity Insights for Agliano Terme
- The most common guest capacity trend in Agliano Terme vacation rentals is listings accommodating 6 guests (26.1%). This suggests the primary traveler segment is likely larger groups.
- Properties designed for 6 guests and 4 guests dominate the Agliano Terme STR market, accounting for 52.2% of listings.
- 34.8% of properties accommodate 6+ guests, serving the market segment for larger families or group travel in Agliano Terme.
- On average, properties in Agliano Terme are equipped to host 3.8 guests.
Agliano Terme Airbnb Booking Patterns (2026): Available vs. Booked Days
Available Days Distribution
Booked Days Distribution
Booking Pattern Insights for Agliano Terme
- The most common availability pattern in Agliano Terme falls within the 271-366 days range, representing 82.6% of listings. This suggests many properties have significant open periods on their calendars.
- Approximately 100.0% of listings show high availability (181+ days open annually), indicating potential for increased bookings or specific owner usage patterns.
- For booked days, the 31-90 days range is most frequent in Agliano Terme (52.2%), reflecting common guest stay durations or potential owner blocking patterns.
- A notable 4.3% of properties secure long booking periods (181+ days booked per year), highlighting successful long-term rental strategies or significant owner usage.
Agliano Terme Airbnb Minimum Stay Requirements Analysis
Distribution of Listings by Minimum Night Requirement
1 Night
7 listings
30.4% of total
2 Nights
3 listings
13% of total
3 Nights
8 listings
34.8% of total
4-6 Nights
3 listings
13% of total
30+ Nights
2 listings
8.7% of total
Key Insights
- The most prevalent minimum stay requirement in Agliano Terme is 3 Nights, adopted by 34.8% of listings. This highlights the market's preference for longer commitments.
Recommendations
- Align with the market by considering a 3 Nights minimum stay, as 34.8% of Agliano Terme hosts use this setting.
- Explore offering discounts for stays of 30+ nights to attract the 8.7% of the market seeking extended stays.
- Adjust minimum nights based on seasonality – potentially shorter during low season and longer during peak demand periods in Agliano Terme.
Agliano Terme Airbnb Cancellation Policy Trends Analysis (2026)
Super Strict 60 Days
1 listings
4.3% of total
Flexible
11 listings
47.8% of total
Moderate
9 listings
39.1% of total
Firm
2 listings
8.7% of total
Cancellation Policy Insights for Agliano Terme
- The prevailing Airbnb cancellation policy trend in Agliano Terme is Flexible, used by 47.8% of listings.
- The market strongly favors guest-friendly terms, with 86.9% of listings offering Flexible or Moderate policies. This suggests guests in Agliano Terme may expect booking flexibility.
Recommendations for Hosts
- Consider adopting a Flexible policy to align with the 47.8% market standard in Agliano Terme.
- Regularly review your cancellation policy against competitors and market demand shifts in Agliano Terme.
Agliano Terme STR Booking Lead Time Analysis (2026)
Average Booking Lead Time by Month
Booking Lead Time Insights for Agliano Terme
- The overall average booking lead time for vacation rentals in Agliano Terme is 98 days.
- Guests book furthest in advance for stays during December (average 171 days), likely coinciding with peak travel demand or local events.
- The shortest booking windows occur for stays in February (average 11 days), indicating more last-minute travel plans during this time.
- Seasonally, Summer (92 days avg.) sees the longest lead times, while Winter (72 days avg.) has the shortest, reflecting typical travel planning cycles.
Recommendations for Hosts
- Use the overall average lead time (98 days) as a baseline for your pricing and availability strategy in Agliano Terme.
- For December stays, consider implementing length-of-stay discounts or slightly higher rates for bookings made less than 171 days out to capitalize on advance planning.
- During February, focus on last-minute booking availability and promotions, as guests book with very short notice (11 days avg.).
- Target marketing efforts for the Summer season well in advance (at least 92 days) to capture early planners.
- Monitor your own booking lead times against these Agliano Terme averages to identify opportunities for dynamic pricing adjustments.
Popular & Essential Airbnb Amenities in Agliano Terme (2026)
Amenity Prevalence
Amenity Insights for Agliano Terme
- Essential amenities in Agliano Terme that guests expect include: Dishes and silverware, Refrigerator, Hangers, Hair dryer, Wifi, Heating. Lacking these (any) could significantly impact bookings.
- Popular amenities like Essentials, Free parking on premises, Hot water are common but not universal. Offering these can provide a competitive edge.
Recommendations for Hosts
- Ensure your listing includes all essential amenities for Agliano Terme: Dishes and silverware, Refrigerator, Hangers, Hair dryer, Wifi, Heating.
- Prioritize adding missing essentials: Hangers, Hair dryer, Wifi, Heating.
- Consider adding popular differentiators like Essentials or Free parking on premises to increase appeal.
- Highlight unique or less common amenities you offer (e.g., hot tub, dedicated workspace, EV charger) in your listing description and photos.
- Regularly check competitor amenities in Agliano Terme to stay competitive.
Agliano Terme Airbnb Guest Demographics & Profile Analysis (2026)
Guest Profile Summary for Agliano Terme
- The typical guest profile for Airbnb in Agliano Terme consists of predominantly international visitors (87%), with top international origins including Netherlands, typically belonging to the Post-2000s (Gen Z/Alpha) group (50%), primarily speaking English or German.
- Domestic travelers account for 12.9% of guests.
- Key international markets include United States (19.4%) and Netherlands (16.1%).
- Top languages spoken are English (42.9%) followed by German (14.3%).
- A significant demographic segment is the Post-2000s (Gen Z/Alpha) group, representing 50% of guests.
Recommendations for Hosts
- Focus marketing internationally, particularly towards travelers from Netherlands.
- Tailor amenities and listing descriptions to appeal to the dominant Post-2000s (Gen Z/Alpha) demographic (e.g., highlight fast WiFi, smart home features, local guides).
- Highlight unique local experiences or amenities relevant to the primary guest profile.
- Consider seasonal promotions aligned with peak travel times for key origin markets.
Nearby Short-Term Rental Market Comparison
How does the Agliano Terme Airbnb market stack up against its neighbors? Compare key performance metrics like average monthly revenue, ADR, and occupancy rates in surrounding areas to understand the broader regional STR landscape.
| Market | Active Properties | Monthly Revenue | Daily Rate | Avg. Occupancy |
|---|---|---|---|---|
| Ranco | 12 | $5,691 | $536.46 | 42% |
| Monteu Roero | 12 | $5,184 | $403.07 | 41% |
| Laglio | 64 | $4,334 | $518.58 | 43% |
| Saint-Jean-Cap-Ferrat | 114 | $3,894 | $465.00 | 44% |
| Cassinasco | 19 | $3,887 | $718.39 | 40% |
| Cossano Belbo | 15 | $3,763 | $326.53 | 36% |
| Portofino | 77 | $3,585 | $509.42 | 38% |
| Bellagio | 461 | $3,466 | $325.87 | 49% |
| Vico Morcote | 12 | $3,347 | $317.07 | 46% |
| Sala Comacina | 73 | $3,332 | $451.20 | 46% |