Entracque Airbnb Market Analysis 2025: Short Term Rental Data & Vacation Rental Statistics in Piedmont, Italy
Is Airbnb profitable in Entracque in 2025? Explore comprehensive Airbnb analytics for Entracque, Piedmont, Italy to uncover income potential. This 2025 STR market report for Entracque, based on AirROI data from October 2024 to September 2025, reveals key trends in the niche market of 18 active listings.
Whether you're considering an Airbnb investment in Entracque, optimizing your existing vacation rental, or exploring rental arbitrage opportunities, understanding the Entracque Airbnb data is crucial. Navigating the high regulation landscape is key to maximizing your short term rental income potential. Let's dive into the specifics.
Key Entracque Airbnb Performance Metrics Overview
Monthly Airbnb Revenue Variations & Income Potential in Entracque (2025)
Understanding the monthly revenue variations for Airbnb listings in Entracque is key to maximizing your short term rental income potential. Seasonality significantly impacts earnings. Our analysis, based on data from the past 12 months, shows that the peak revenue month for STRs in Entracque is typically August, while May often presents the lowest earnings, highlighting opportunities for strategic pricing adjustments during shoulder and low seasons. Explore the typical Airbnb income in Entracque across different performance tiers:
- Best-in-class properties (Top 10%) achieve $1,368+ monthly, often utilizing dynamic pricing and superior guest experiences.
- Strong performing properties (Top 25%) earn $1,007 or more, indicating effective management and desirable locations/amenities.
- Typical properties (Median) generate around $631 per month, representing the average market performance.
- Entry-level properties (Bottom 25%) see earnings around $342, often with potential for optimization.
Average Monthly Airbnb Earnings Trend in Entracque
Entracque Airbnb Occupancy Rate Trends (2025)
Maximize your bookings by understanding the Entracque STR occupancy trends. Seasonal demand shifts significantly influence how often properties are booked. Typically, Augustsees the highest demand (peak season occupancy), while May experiences the lowest (low season). Effective strategies, like adjusting minimum stays or offering promotions, can boost occupancy during slower periods. Here's how different property tiers perform in Entracque:
- Best-in-class properties (Top 10%) achieve 59%+ occupancy, indicating high desirability and potentially optimized availability.
- Strong performing properties (Top 25%) maintain 44% or higher occupancy, suggesting good market fit and guest satisfaction.
- Typical properties (Median) have an occupancy rate around 28%.
- Entry-level properties (Bottom 25%) average 16% occupancy, potentially facing higher vacancy.
Average Monthly Occupancy Rate Trend in Entracque
Average Daily Rate (ADR) Airbnb Trends in Entracque (2025)
Effective short term rental pricing strategy in Entracque involves understanding monthly ADR fluctuations. The Average Daily Rate (ADR) for Airbnb in Entracque typically peaks in August and dips lowest during April. Leveraging Airbnb dynamic pricing tools or strategies based on this seasonality can significantly boost revenue. Here's a look at the typical nightly rates achieved:
- Best-in-class properties (Top 10%) command rates of $131+ per night, often due to premium features or locations.
- Strong performing properties (Top 25%) achieve nightly rates of $102 or more.
- Typical properties (Median) charge around $77 per night.
- Entry-level properties (Bottom 25%) earn around $62 per night.
Average Daily Rate (ADR) Trend by Month in Entracque
Get Live Entracque Market Intelligence 👇
Explore Real-time Analytics
Airbnb Seasonality Analysis & Trends in Entracque (2025)
Peak Season (August, July, June)
- Revenue averages $1,516 per month
- Occupancy rates average 53.9%
- Daily rates average $89
Shoulder Season
- Revenue averages $557 per month
- Occupancy maintains around 25.7%
- Daily rates hold near $84
Low Season (February, May, November)
- Revenue drops to average $357 per month
- Occupancy decreases to average 17.8%
- Daily rates adjust to average $83
Seasonality Insights for Entracque
- The Airbnb seasonality in Entracque shows highly seasonal trends requiring careful strategy. While the sections above show seasonal averages, it's also insightful to look at the extremes:
- During the high season, the absolute peak month showcases Entracque's highest earning potential, with monthly revenues capable of climbing to $1,843, occupancy reaching a high of 69.8%, and ADRs peaking at $90.
- Conversely, the slowest single month of the year, typically falling within the low season, marks the market's lowest point. In this month, revenue might dip to $240, occupancy could drop to 10.3%, and ADRs may adjust down to $81.
- Understanding both the seasonal averages and these monthly peaks and troughs in revenue, occupancy, and ADR is crucial for maximizing your Airbnb profit potential in Entracque.
Seasonal Strategies for Maximizing Profit
- Peak Season: Maximize revenue through premium pricing and potentially longer minimum stays. Ensure high availability.
- Low Season: Offer competitive pricing, special promotions (e.g., extended stay discounts), and flexible cancellation policies. Target off-season travelers like remote workers or budget-conscious guests.
- Shoulder Seasons: Implement dynamic pricing that balances peak and low rates. Target weekend travelers or specific events. Offer slightly more flexible terms than peak season.
- Regularly analyze your own performance against these Entracque seasonality benchmarks and adjust your pricing and availability strategy accordingly.
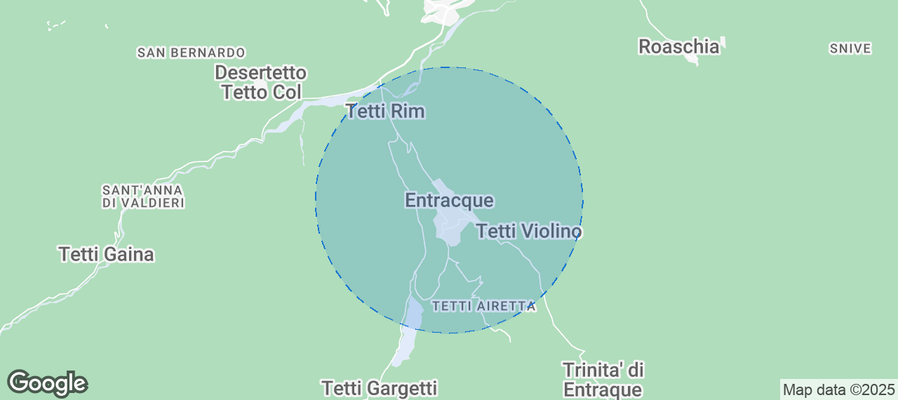
Best Areas for Airbnb Investment in Entracque (2025)
Exploring the top neighborhoods for short-term rentals in Entracque? This section highlights key areas, outlining why they are attractive for hosts and guests, along with notable local attractions. Consider these locations based on your target guest profile and investment strategy.
| Neighborhood / Area | Why Host Here? (Target Guests & Appeal) | Key Attractions & Landmarks |
|---|---|---|
| Entracque Center | Charming village center surrounded by stunning mountain views, ideal for visitors seeking a quiet getaway amidst nature. Proximity to local shops and restaurants makes it a favorite for tourists. | Church of San Giovanni Battista, Local cafes and restaurants, Entracque Visitor Center, Beautiful hiking trails |
| Pian della Mussa | Scenic high-altitude plateau perfect for outdoor activities year-round, popular for summer hiking and winter skiing. Great for guests looking for adventure and breathtaking landscapes. | Ski resorts, Hiking trails, Alpine lakes, Mountain biking routes |
| Parco Naturale delle Alpi Marittime | A protected natural park, famous for its rich biodiversity and beautiful landscapes. Attracts nature lovers and hikers, perfect for eco-tourism. | Nature trails, Wildlife watching, Stunning vistas, Picnic areas |
| Borgo di Entracque | Quaint and picturesque neighborhood within Entracque, known for its historical architecture and local charm. Offers a tranquil stay away from crowded tourist spots. | Historical buildings, Local artisans, Community events |
| Colle della Maddalena | Mountain pass known for breathtaking views and hiking trails. Appeals to adventure seekers and those wanting to enjoy stunning alpine scenery. | Scenic driving routes, Hiking trails, Panoramic views |
| Terme di Entracque | A unique thermal spa area, attracting guests looking to relax and rejuvenate. Popular year-round for wellness tourism. | Thermal baths, Spa services, Beautiful gardens |
| Castel del Rio | A nearby historical site offering rich cultural insights and beautiful landscapes. Great for guests interested in history and architecture. | Historical castle ruins, Guided tours, Photography opportunities |
| Laghetti di Entracque | Serene lakes known for their reflective views and fishing opportunities. Perfect for families and outdoor enthusiasts seeking a peaceful retreat. | Fishing spots, Picnic areas, Walking paths, Stunning sunrises |
Understanding Airbnb License Requirements & STR Laws in Entracque (2025)
Yes, Entracque, Piedmont, Italy enforces high STR regulations. Obtaining a license and ensuring compliance is almost certainly required according to current 2025 STR laws. Always verify the latest short term rental regulations and Airbnb license requirements directly with local government authorities for Entracque to ensure full compliance before hosting.
(Source: AirROI data, 2025, based on 56% licensed listings)
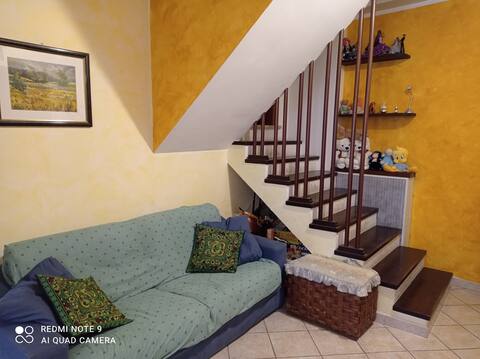
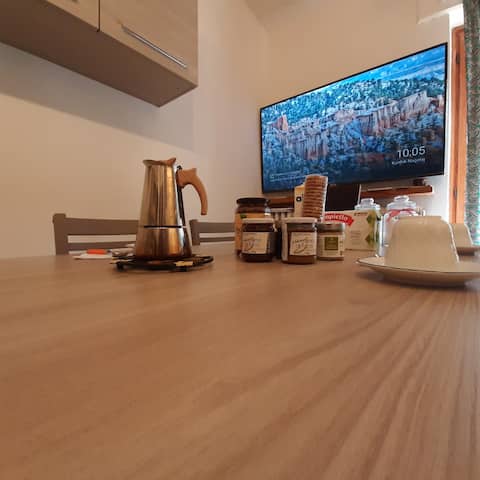
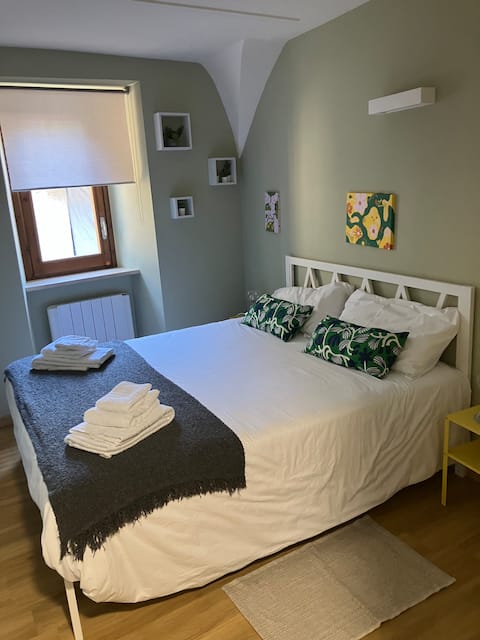
Top Performing Airbnb Properties in Entracque (2025)
Benchmark your potential! Explore examples of top-performing Airbnb properties in Entracquebased on Trailing Twelve Month (TTM) revenue. Analyze their characteristics, revenue, occupancy rate, and ADR to understand what drives success in this market.
Monica's Little House
Entire Place • 2 bedrooms
Granny Blonde Entracque
Entire Place • 1 bedroom
Lupetto's house
Entire Place • 1 bedroom
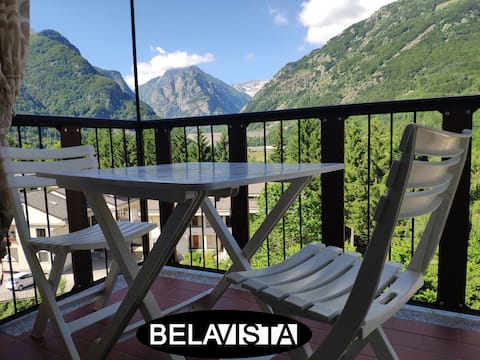
Bela Vista
Entire Place • 1 bedroom
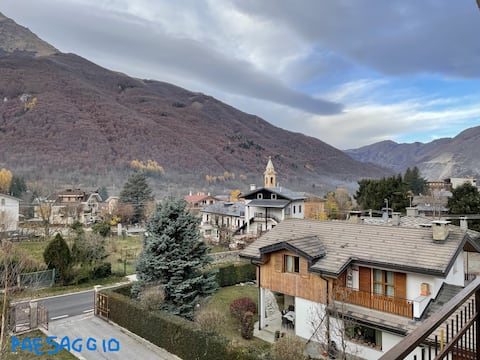
Two-room apartment, panoramic view
Entire Place • 1 bedroom
New apartment in the heart of the Maritime Alps
Entire Place • 1 bedroom
Note: Performance varies based on location, size, amenities, seasonality, and management quality. Data reflects the past 12 months.
Top Performing Airbnb Hosts in Entracque (2025)
Learn from the best! This table showcases top-performing Airbnb hosts in Entracque based on the number of properties managed and estimated total revenue over the past year. Analyze their scale and performance metrics.
| Host Name | Properties | Grossing Revenue | Stay Reviews | Avg Rating |
|---|---|---|---|---|
| Monica | 1 | $14,358 | 4 | 5.00/5.0 |
| Davide | 1 | $11,641 | 75 | 4.91/5.0 |
| Valeria | 1 | $8,820 | 10 | 4.90/5.0 |
| Maria Grazia | 1 | $8,228 | 7 | 5.00/5.0 |
| Valeria | 1 | $7,718 | 34 | 4.88/5.0 |
| Piermario E Renata | 1 | $7,108 | 21 | 4.90/5.0 |
| Franco | 1 | $6,903 | 27 | 4.96/5.0 |
| Andrea | 1 | $4,703 | 27 | 4.74/5.0 |
| Daniele | 1 | $4,642 | 55 | 4.78/5.0 |
| Paolo | 1 | $4,505 | 28 | 4.68/5.0 |
Analyzing the strategies of top hosts, such as their property selection, pricing, and guest communication, can offer valuable lessons for optimizing your own Airbnb operations in Entracque.
Dive Deeper: Advanced Entracque STR Market Data (2025)
Ready to unlock more insights? AirROI provides access to advanced metrics and comprehensive Airbnb data for Entracque. Explore detailed analytics beyond this report to refine your investment strategy, optimize pricing, and maximize your vacation rental profits.
Explore Advanced MetricsEntracque Short-Term Rental Market Composition (2025): Property & Room Types
Room Type Distribution
Property Type Distribution
Market Composition Insights for Entracque
- The Entracque Airbnb market composition is heavily skewed towards Entire Home/Apt listings, which make up 100% of the 18 active rentals. This indicates strong guest preference for privacy and space.
- Looking at the property type distribution in Entracque, Apartment/Condo properties are the most common (77.8%), reflecting the local real estate landscape.
Entracque Airbnb Room Capacity Analysis (2025): Bedroom Distribution
Distribution of Listings by Number of Bedrooms
Room Capacity Insights for Entracque
- The dominant room capacity in Entracque is 1 bedroom listings, making up 88.9% of the market. This suggests a strong demand for properties suitable for couples or solo travelers.
- Together, 1 bedroom and 2 bedrooms properties represent 100.0% of the active Airbnb listings in Entracque, indicating a high concentration in these sizes.
- With over half the market (88.9%) consisting of studios or 1-bedroom units, Entracque is particularly well-suited for individuals or couples.
Entracque Vacation Rental Guest Capacity Trends (2025)
Distribution of Listings by Guest Capacity
Guest Capacity Insights for Entracque
- The most common guest capacity trend in Entracque vacation rentals is listings accommodating 4 guests (33.3%). This suggests the primary traveler segment is likely small families or groups.
- Properties designed for 4 guests and 2 guests dominate the Entracque STR market, accounting for 66.6% of listings.
- 11.1% of properties accommodate 6+ guests, serving the market segment for larger families or group travel in Entracque.
- On average, properties in Entracque are equipped to host 3.4 guests.
Entracque Airbnb Booking Patterns (2025): Available vs. Booked Days
Available Days Distribution
Booked Days Distribution
Booking Pattern Insights for Entracque
- The most common availability pattern in Entracque falls within the 271-366 days range, representing 66.7% of listings. This suggests many properties have significant open periods on their calendars.
- Approximately 100.0% of listings show high availability (181+ days open annually), indicating potential for increased bookings or specific owner usage patterns.
- For booked days, the 1-30 days range is most frequent in Entracque (38.9%), reflecting common guest stay durations or potential owner blocking patterns.
Entracque Airbnb Minimum Stay Requirements Analysis
Distribution of Listings by Minimum Night Requirement
1 Night
2 listings
11.1% of total
2 Nights
4 listings
22.2% of total
3 Nights
2 listings
11.1% of total
4-6 Nights
2 listings
11.1% of total
7-29 Nights
4 listings
22.2% of total
30+ Nights
4 listings
22.2% of total
Key Insights
- The most prevalent minimum stay requirement in Entracque is 2 Nights, adopted by 22.2% of listings. This highlights the market's preference for shorter, flexible bookings.
- A significant segment (22.2%) caters to monthly stays (30+ nights) in Entracque, pointing to opportunities in the extended-stay market.
Recommendations
- Align with the market by considering a 2 Nights minimum stay, as 22.2% of Entracque hosts use this setting.
- If feasible, allowing 1-night stays, especially midweek or during low season, could capture last-minute bookings, as only 11.1% currently do.
- Explore offering discounts for stays of 30+ nights to attract the 22.2% of the market seeking extended stays.
- Adjust minimum nights based on seasonality – potentially shorter during low season and longer during peak demand periods in Entracque.
Entracque Airbnb Cancellation Policy Trends Analysis (2025)
Super Strict 30 Days
1 listings
5.6% of total
Flexible
9 listings
50% of total
Moderate
7 listings
38.9% of total
Firm
1 listings
5.6% of total
Cancellation Policy Insights for Entracque
- The prevailing Airbnb cancellation policy trend in Entracque is Flexible, used by 50% of listings.
- The market strongly favors guest-friendly terms, with 88.9% of listings offering Flexible or Moderate policies. This suggests guests in Entracque may expect booking flexibility.
Recommendations for Hosts
- Consider adopting a Flexible policy to align with the 50% market standard in Entracque.
- Regularly review your cancellation policy against competitors and market demand shifts in Entracque.
Entracque STR Booking Lead Time Analysis (2025)
Average Booking Lead Time by Month
Booking Lead Time Insights for Entracque
- The overall average booking lead time for vacation rentals in Entracque is 38 days.
- Guests book furthest in advance for stays during July (average 100 days), likely coinciding with peak travel demand or local events.
- The shortest booking windows occur for stays in March (average 2 days), indicating more last-minute travel plans during this time.
- Seasonally, Summer (75 days avg.) sees the longest lead times, while Winter (20 days avg.) has the shortest, reflecting typical travel planning cycles.
Recommendations for Hosts
- Use the overall average lead time (38 days) as a baseline for your pricing and availability strategy in Entracque.
- For July stays, consider implementing length-of-stay discounts or slightly higher rates for bookings made less than 100 days out to capitalize on advance planning.
- During March, focus on last-minute booking availability and promotions, as guests book with very short notice (2 days avg.).
- Target marketing efforts for the Summer season well in advance (at least 75 days) to capture early planners.
- Monitor your own booking lead times against these Entracque averages to identify opportunities for dynamic pricing adjustments.
Popular & Essential Airbnb Amenities in Entracque (2025)
Amenity Prevalence
Amenity Insights for Entracque
- Essential amenities in Entracque that guests expect include: Hair dryer. Lacking these (this) could significantly impact bookings.
- Popular amenities like TV, Hot water, Dishes and silverware are common but not universal. Offering these can provide a competitive edge.
Recommendations for Hosts
- Ensure your listing includes all essential amenities for Entracque: Hair dryer.
- Consider adding popular differentiators like TV or Hot water to increase appeal.
- Highlight unique or less common amenities you offer (e.g., hot tub, dedicated workspace, EV charger) in your listing description and photos.
- Regularly check competitor amenities in Entracque to stay competitive.
Entracque Airbnb Guest Demographics & Profile Analysis (2025)
Guest Profile Summary for Entracque
- The typical guest profile for Airbnb in Entracque consists of primarily domestic travelers (79%), often arriving from nearby Genoa, typically belonging to the Post-2000s (Gen Z/Alpha) group (50%), primarily speaking English or Italian.
- Domestic travelers account for 79.2% of guests.
- Key international markets include Italy (79.2%) and France (16.7%).
- Top languages spoken are English (36.2%) followed by Italian (34%).
- A significant demographic segment is the Post-2000s (Gen Z/Alpha) group, representing 50% of guests.
Recommendations for Hosts
- Target domestic marketing efforts towards travelers from Genoa and Turin.
- Tailor amenities and listing descriptions to appeal to the dominant Post-2000s (Gen Z/Alpha) demographic (e.g., highlight fast WiFi, smart home features, local guides).
- Highlight unique local experiences or amenities relevant to the primary guest profile.
- Consider seasonal promotions aligned with peak travel times for key origin markets.
Nearby Short-Term Rental Market Comparison
How does the Entracque Airbnb market stack up against its neighbors? Compare key performance metrics like average monthly revenue, ADR, and occupancy rates in surrounding areas to understand the broader regional STR landscape.
| Market | Active Properties | Monthly Revenue | Daily Rate | Avg. Occupancy |
|---|---|---|---|---|
| Les Clefs | 34 | $5,790 | $317.67 | 46% |
| Ranco | 12 | $5,486 | $485.38 | 37% |
| Monteu Roero | 12 | $5,346 | $407.57 | 42% |
| Cossano Belbo | 10 | $4,814 | $355.26 | 36% |
| Manigod | 215 | $4,160 | $445.53 | 40% |
| Saint-Jean-Cap-Ferrat | 108 | $4,065 | $455.30 | 44% |
| Saint-Nicolas-la-Chapelle | 26 | $3,988 | $454.38 | 44% |
| Ramatuelle | 224 | $3,560 | $641.51 | 36% |
| Charvonnex | 11 | $3,507 | $258.71 | 47% |
| Val-d'Isère | 443 | $3,480 | $392.77 | 47% |