La Morra Airbnb Market Analysis 2026: Short Term Rental Data & Vacation Rental Statistics in Piedmont, Italy
Is Airbnb profitable in La Morra in 2026? Explore comprehensive Airbnb analytics for La Morra, Piedmont, Italy to uncover income potential. This 2026 STR market report for La Morra, based on AirROI data from February 2025 to January 2026, reveals key trends in the niche market of 91 active listings.
Whether you're considering an Airbnb investment in La Morra, optimizing your existing vacation rental, or exploring rental arbitrage opportunities, understanding the La Morra Airbnb data is crucial. Navigating the high regulation landscape is key to maximizing your short term rental income potential. Let's dive into the specifics.
Key La Morra Airbnb Performance Metrics Overview
Monthly Airbnb Revenue Variations & Income Potential in La Morra (2026)
Understanding the monthly revenue variations for Airbnb listings in La Morra is key to maximizing your short term rental income potential. Seasonality significantly impacts earnings. Our analysis, based on data from the past 12 months, shows that the peak revenue month for STRs in La Morra is typically October, while January often presents the lowest earnings, highlighting opportunities for strategic pricing adjustments during shoulder and low seasons. Explore the typical Airbnb income in La Morra across different performance tiers:
- Best-in-class properties (Top 10%) achieve $4,239+ monthly, often utilizing dynamic pricing and superior guest experiences.
- Strong performing properties (Top 25%) earn $2,684 or more, indicating effective management and desirable locations/amenities.
- Typical properties (Median) generate around $1,516 per month, representing the average market performance.
- Entry-level properties (Bottom 25%) see earnings around $773, often with potential for optimization.
Average Monthly Airbnb Earnings Trend in La Morra
La Morra Airbnb Occupancy Rate Trends (2026)
Maximize your bookings by understanding the La Morra STR occupancy trends. Seasonal demand shifts significantly influence how often properties are booked. Typically, Augustsees the highest demand (peak season occupancy), while January experiences the lowest (low season). Effective strategies, like adjusting minimum stays or offering promotions, can boost occupancy during slower periods. Here's how different property tiers perform in La Morra:
- Best-in-class properties (Top 10%) achieve 72%+ occupancy, indicating high desirability and potentially optimized availability.
- Strong performing properties (Top 25%) maintain 57% or higher occupancy, suggesting good market fit and guest satisfaction.
- Typical properties (Median) have an occupancy rate around 34%.
- Entry-level properties (Bottom 25%) average 17% occupancy, potentially facing higher vacancy.
Average Monthly Occupancy Rate Trend in La Morra
Average Daily Rate (ADR) Airbnb Trends in La Morra (2026)
Effective short term rental pricing strategy in La Morra involves understanding monthly ADR fluctuations. The Average Daily Rate (ADR) for Airbnb in La Morra typically peaks in September and dips lowest during March. Leveraging Airbnb dynamic pricing tools or strategies based on this seasonality can significantly boost revenue. Here's a look at the typical nightly rates achieved:
- Best-in-class properties (Top 10%) command rates of $313+ per night, often due to premium features or locations.
- Strong performing properties (Top 25%) achieve nightly rates of $200 or more.
- Typical properties (Median) charge around $138 per night.
- Entry-level properties (Bottom 25%) earn around $112 per night.
Average Daily Rate (ADR) Trend by Month in La Morra
Get Live La Morra Market Intelligence 👇

Explore Real-time Analytics
Airbnb Seasonality Analysis & Trends in La Morra (2026)
Peak Season (October, August, September)
- Revenue averages $3,192 per month
- Occupancy rates average 51.9%
- Daily rates average $202
Shoulder Season
- Revenue averages $2,162 per month
- Occupancy maintains around 38.7%
- Daily rates hold near $194
Low Season (January, February, December)
- Revenue drops to average $1,213 per month
- Occupancy decreases to average 23.7%
- Daily rates adjust to average $193
Seasonality Insights for La Morra
- The Airbnb seasonality in La Morra shows highly seasonal trends requiring careful strategy. While the sections above show seasonal averages, it's also insightful to look at the extremes:
- During the high season, the absolute peak month showcases La Morra's highest earning potential, with monthly revenues capable of climbing to $3,383, occupancy reaching a high of 53.7%, and ADRs peaking at $203.
- Conversely, the slowest single month of the year, typically falling within the low season, marks the market's lowest point. In this month, revenue might dip to $1,018, occupancy could drop to 20.9%, and ADRs may adjust down to $187.
- Understanding both the seasonal averages and these monthly peaks and troughs in revenue, occupancy, and ADR is crucial for maximizing your Airbnb profit potential in La Morra.
Seasonal Strategies for Maximizing Profit
- Peak Season: Maximize revenue through premium pricing and potentially longer minimum stays. Ensure high availability.
- Low Season: Offer competitive pricing, special promotions (e.g., extended stay discounts), and flexible cancellation policies. Target off-season travelers like remote workers or budget-conscious guests.
- Shoulder Seasons: Implement dynamic pricing that balances peak and low rates. Target weekend travelers or specific events. Offer slightly more flexible terms than peak season.
- Regularly analyze your own performance against these La Morra seasonality benchmarks and adjust your pricing and availability strategy accordingly.
Best Areas for Airbnb Investment in La Morra (2026)
Exploring the top neighborhoods for short-term rentals in La Morra? This section highlights key areas, outlining why they are attractive for hosts and guests, along with notable local attractions. Consider these locations based on your target guest profile and investment strategy.
| Neighborhood / Area | Why Host Here? (Target Guests & Appeal) | Key Attractions & Landmarks |
|---|---|---|
| La Morra Historic Center | Charming medieval town center famous for its picturesque streets and stunning vineyards. Ideal for tourists wanting to experience the local culture and cuisine. | Castello di La Morra, Piazza Castello, Wine tasting tours, Piedmontese cuisine, Vineyard hiking trails |
| Barolo | Nearby Barolo is renowned for its prestigious wines, making it a favorite for wine enthusiasts. This area attracts visitors looking to explore the Langhe wine region. | Barolo Castle, Wine cellars, Trattoria della Storia, Vineyard tours, Barolo wine tastings |
| Roddi | A small village known for its historical significance and beautiful landscapes. It's a quieter spot for those seeking relaxation and wine exploration. | Roddi Castle, Natural parks, Local wineries, Culinary tours, Historical architecture |
| Monforte d'Alba | A quaint village with a rich wine culture, offering stunning views and a tranquil atmosphere. Attracts both tourists and locals for its events and festivals. | Monforte d'Alba Theater, Wine festivals, Scenic viewpoints, Local vineyards, Culinary experiences |
| Castiglione Falletto | Known for its scenic hills and excellent wines, this area is perfect for those looking to enjoy the countryside and the local viticulture. | Castiglione Falletto Castle, Wine tasting, Hiking trails, Trattorie, Beautiful panoramic views |
| Serralunga d'Alba | A picturesque village that attracts visitors for its historical features and access to vineyards. Its castle is a notable landmark. | Serralunga Castle, Noble vineyards, Local gastronomy, Natural reserves, Scenic landscapes |
| Barbaresco | Famous for its wine, Barbaresco draws oenophiles and tourists interested in exploring one of Italy's most renowned wine regions. | Barbaresco Tower, Wine tastings, Wine cellars, Cultural tours, Local festivals |
| Cherasco | A historic town with beautiful architecture and a well-preserved medieval center, popular for food lovers and history enthusiasts. | Cherasco's Old Town, Antiquities market, Culinary specialties, Local museums, Historical landmarks |
Understanding Airbnb License Requirements & STR Laws in La Morra (2026)
Yes, La Morra, Piedmont, Italy enforces high STR regulations. Obtaining a license and ensuring compliance is almost certainly required according to current 2026 STR laws. Always verify the latest short term rental regulations and Airbnb license requirements directly with local government authorities for La Morra to ensure full compliance before hosting.
(Source: AirROI data, 2026, based on 91% licensed listings)
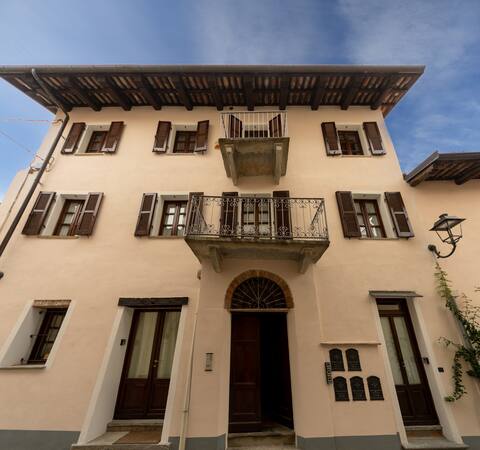
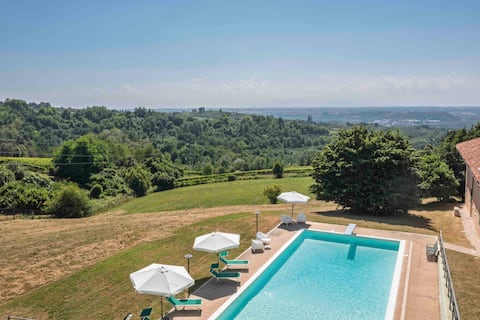
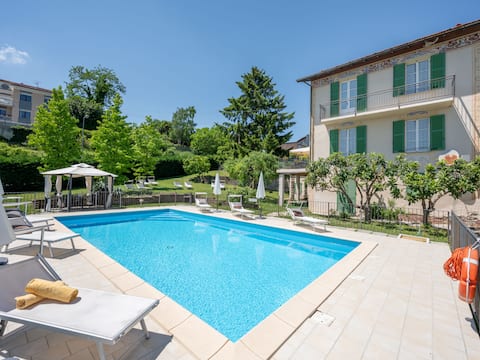
Top Performing Airbnb Properties in La Morra (2026)
Benchmark your potential! Explore examples of top-performing Airbnb properties in La Morrabased on Trailing Twelve Month (TTM) revenue. Analyze their characteristics, revenue, occupancy rate, and ADR to understand what drives success in this market.
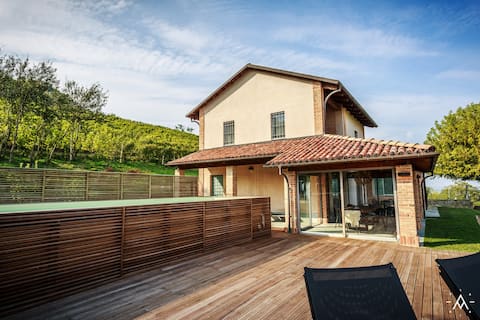
Villa Adina - Panorama of the Barolo hills
Entire Place • 4 bedrooms
La Morra Flat - entire house
Entire Place • 7 bedrooms

Huge penthouse overlooking the Barolo valley
Entire Place • 3 bedrooms
Villa Fogliacchi
Entire Place • 5 bedrooms
Savio by Interhome
Entire Place • 4 bedrooms

PEIRAGAL – new, in the historical centre
Entire Place • 3 bedrooms
Note: Performance varies based on location, size, amenities, seasonality, and management quality. Data reflects the past 12 months.
Top Performing Airbnb Hosts in La Morra (2026)
Learn from the best! This table showcases top-performing Airbnb hosts in La Morra based on the number of properties managed and estimated total revenue over the past year. Analyze their scale and performance metrics.
| Host Name | Properties | Grossing Revenue | Stay Reviews | Avg Rating |
|---|---|---|---|---|
| Adina | 2 | $167,315 | 93 | 4.83/5.0 |
| Paola | 4 | $165,706 | 97 | 5.00/5.0 |
| Sergio | 2 | $147,661 | 172 | 4.97/5.0 |
| Ilaria | 4 | $128,887 | 395 | 4.98/5.0 |
| Bruno | 2 | $95,010 | 42 | 5.00/5.0 |
| Roberto | 3 | $60,462 | 163 | 4.90/5.0 |
| HRPMI SRL X Engel&Völkers | 1 | $56,290 | 4 | 5.00/5.0 |
| MurraeLoft | 7 | $53,848 | 37 | 4.98/5.0 |
| Giacomo | 3 | $53,174 | 46 | 4.96/5.0 |
| Marion - Interhome | 1 | $53,072 | 18 | 4.56/5.0 |
Analyzing the strategies of top hosts, such as their property selection, pricing, and guest communication, can offer valuable lessons for optimizing your own Airbnb operations in La Morra.
Dive Deeper: Advanced La Morra STR Market Data (2026)
Ready to unlock more insights? AirROI provides access to advanced metrics and comprehensive Airbnb data for La Morra. Explore detailed analytics beyond this report to refine your investment strategy, optimize pricing, and maximize your vacation rental profits.
Explore Advanced MetricsLa Morra Short-Term Rental Market Composition (2026): Property & Room Types
Room Type Distribution
Property Type Distribution
Market Composition Insights for La Morra
- The La Morra Airbnb market composition is heavily skewed towards Entire Home/Apt listings, which make up 92.3% of the 91 active rentals. This indicates strong guest preference for privacy and space.
- Looking at the property type distribution in La Morra, Apartment/Condo properties are the most common (70.3%), reflecting the local real estate landscape.
- Houses represent a significant 27.5% portion, catering likely to families or larger groups.
- Smaller segments like hotel/boutique (combined 2.2%) offer potential for unique stay experiences.
La Morra Airbnb Room Capacity Analysis (2026): Bedroom Distribution
Distribution of Listings by Number of Bedrooms
Room Capacity Insights for La Morra
- The dominant room capacity in La Morra is 1 bedroom listings, making up 54.9% of the market. This suggests a strong demand for properties suitable for couples or solo travelers.
- Together, 1 bedroom and 2 bedrooms properties represent 82.4% of the active Airbnb listings in La Morra, indicating a high concentration in these sizes.
- With over half the market (54.9%) consisting of studios or 1-bedroom units, La Morra is particularly well-suited for individuals or couples.
La Morra Vacation Rental Guest Capacity Trends (2026)
Distribution of Listings by Guest Capacity
Guest Capacity Insights for La Morra
- The most common guest capacity trend in La Morra vacation rentals is listings accommodating 4 guests (31.9%). This suggests the primary traveler segment is likely small families or groups.
- Properties designed for 4 guests and 2 guests dominate the La Morra STR market, accounting for 61.6% of listings.
- 16.5% of properties accommodate 6+ guests, serving the market segment for larger families or group travel in La Morra.
- On average, properties in La Morra are equipped to host 3.7 guests.
La Morra Airbnb Booking Patterns (2026): Available vs. Booked Days
Available Days Distribution
Booked Days Distribution
Booking Pattern Insights for La Morra
- The most common availability pattern in La Morra falls within the 271-366 days range, representing 47.3% of listings. This suggests many properties have significant open periods on their calendars.
- Approximately 82.5% of listings show high availability (181+ days open annually), indicating potential for increased bookings or specific owner usage patterns.
- For booked days, the 91-180 days range is most frequent in La Morra (37.4%), reflecting common guest stay durations or potential owner blocking patterns.
- A notable 17.6% of properties secure long booking periods (181+ days booked per year), highlighting successful long-term rental strategies or significant owner usage.
La Morra Airbnb Minimum Stay Requirements Analysis
Distribution of Listings by Minimum Night Requirement
1 Night
16 listings
17.6% of total
2 Nights
32 listings
35.2% of total
3 Nights
4 listings
4.4% of total
4-6 Nights
4 listings
4.4% of total
7-29 Nights
2 listings
2.2% of total
30+ Nights
33 listings
36.3% of total
Key Insights
- The most prevalent minimum stay requirement in La Morra is 30+ Nights, adopted by 36.3% of listings. This highlights the market's preference for longer commitments.
- A significant segment (36.3%) caters to monthly stays (30+ nights) in La Morra, pointing to opportunities in the extended-stay market.
Recommendations
- Align with the market by considering a 30+ Nights minimum stay, as 36.3% of La Morra hosts use this setting.
- If feasible, allowing 1-night stays, especially midweek or during low season, could capture last-minute bookings, as only 17.6% currently do.
- A 2-night minimum appears standard (35.2%). Consider this for weekends or peak periods.
- Explore offering discounts for stays of 30+ nights to attract the 36.3% of the market seeking extended stays.
- Adjust minimum nights based on seasonality – potentially shorter during low season and longer during peak demand periods in La Morra.
La Morra Airbnb Cancellation Policy Trends Analysis (2026)
Super Strict 30 Days
3 listings
3.3% of total
Flexible
36 listings
39.6% of total
Moderate
41 listings
45.1% of total
Firm
10 listings
11% of total
Strict
1 listings
1.1% of total
Cancellation Policy Insights for La Morra
- The prevailing Airbnb cancellation policy trend in La Morra is Moderate, used by 45.1% of listings.
- The market strongly favors guest-friendly terms, with 84.7% of listings offering Flexible or Moderate policies. This suggests guests in La Morra may expect booking flexibility.
- Strict cancellation policies are quite rare (1.1%), potentially making listings with this policy less competitive unless justified by high demand or property type.
Recommendations for Hosts
- Consider adopting a Moderate policy to align with the 45.1% market standard in La Morra.
- Using a Strict policy might deter some guests, as only 1.1% of listings use it. Evaluate if potential revenue protection outweighs possible lower booking rates.
- Regularly review your cancellation policy against competitors and market demand shifts in La Morra.
La Morra STR Booking Lead Time Analysis (2026)
Average Booking Lead Time by Month
Booking Lead Time Insights for La Morra
- The overall average booking lead time for vacation rentals in La Morra is 63 days.
- Guests book furthest in advance for stays during September (average 88 days), likely coinciding with peak travel demand or local events.
- The shortest booking windows occur for stays in February (average 35 days), indicating more last-minute travel plans during this time.
- Seasonally, Summer (74 days avg.) sees the longest lead times, while Winter (45 days avg.) has the shortest, reflecting typical travel planning cycles.
Recommendations for Hosts
- Use the overall average lead time (63 days) as a baseline for your pricing and availability strategy in La Morra.
- For September stays, consider implementing length-of-stay discounts or slightly higher rates for bookings made less than 88 days out to capitalize on advance planning.
- Target marketing efforts for the Summer season well in advance (at least 74 days) to capture early planners.
- Monitor your own booking lead times against these La Morra averages to identify opportunities for dynamic pricing adjustments.
Popular & Essential Airbnb Amenities in La Morra (2026)
Amenity Prevalence
Amenity Insights for La Morra
- Essential amenities in La Morra that guests expect include: Heating, Hot water, Wifi, Hair dryer, Essentials. Lacking these (any) could significantly impact bookings.
- Popular amenities like Dishes and silverware, TV, Hangers are common but not universal. Offering these can provide a competitive edge.
Recommendations for Hosts
- Ensure your listing includes all essential amenities for La Morra: Heating, Hot water, Wifi, Hair dryer, Essentials.
- Prioritize adding missing essentials: Hot water, Wifi, Hair dryer, Essentials.
- Consider adding popular differentiators like Dishes and silverware or TV to increase appeal.
- Highlight unique or less common amenities you offer (e.g., hot tub, dedicated workspace, EV charger) in your listing description and photos.
- Regularly check competitor amenities in La Morra to stay competitive.
La Morra Airbnb Guest Demographics & Profile Analysis (2026)
Guest Profile Summary for La Morra
- The typical guest profile for Airbnb in La Morra consists of predominantly international visitors (81%), with top international origins including United States, typically belonging to the Post-2000s (Gen Z/Alpha) group (50%), primarily speaking English or Italian.
- Domestic travelers account for 19.0% of guests.
- Key international markets include Italy (19%) and United States (17.1%).
- Top languages spoken are English (41.1%) followed by Italian (14.2%).
- A significant demographic segment is the Post-2000s (Gen Z/Alpha) group, representing 50% of guests.
Recommendations for Hosts
- Focus marketing internationally, particularly towards travelers from United States.
- Tailor amenities and listing descriptions to appeal to the dominant Post-2000s (Gen Z/Alpha) demographic (e.g., highlight fast WiFi, smart home features, local guides).
- Highlight unique local experiences or amenities relevant to the primary guest profile.
- Consider seasonal promotions aligned with peak travel times for key origin markets.
Nearby Short-Term Rental Market Comparison
How does the La Morra Airbnb market stack up against its neighbors? Compare key performance metrics like average monthly revenue, ADR, and occupancy rates in surrounding areas to understand the broader regional STR landscape.
| Market | Active Properties | Monthly Revenue | Daily Rate | Avg. Occupancy |
|---|---|---|---|---|
| Ranco | 12 | $5,691 | $536.46 | 42% |
| Les Clefs | 34 | $5,585 | $314.08 | 47% |
| Monteu Roero | 12 | $5,184 | $403.07 | 41% |
| Manigod | 221 | $4,273 | $460.37 | 38% |
| Ramatuelle | 231 | $4,086 | $662.31 | 40% |
| Saint-Jean-Cap-Ferrat | 114 | $3,894 | $465.00 | 44% |
| Cassinasco | 19 | $3,887 | $718.39 | 40% |
| Cossano Belbo | 15 | $3,763 | $326.53 | 36% |
| Saint-Nicolas-la-Chapelle | 27 | $3,658 | $459.86 | 41% |
| Charvonnex | 11 | $3,610 | $266.39 | 45% |