Oleggio Airbnb Market Analysis 2026: Short Term Rental Data & Vacation Rental Statistics in Piedmont, Italy
Is Airbnb profitable in Oleggio in 2026? Explore comprehensive Airbnb analytics for Oleggio, Piedmont, Italy to uncover income potential. This 2026 STR market report for Oleggio, based on AirROI data from December 2024 to November 2025, reveals key trends in the niche market of 18 active listings.
Whether you're considering an Airbnb investment in Oleggio, optimizing your existing vacation rental, or exploring rental arbitrage opportunities, understanding the Oleggio Airbnb data is crucial. Navigating the high regulation landscape is key to maximizing your short term rental income potential. Let's dive into the specifics.
Key Oleggio Airbnb Performance Metrics Overview
Monthly Airbnb Revenue Variations & Income Potential in Oleggio (2026)
Understanding the monthly revenue variations for Airbnb listings in Oleggio is key to maximizing your short term rental income potential. Seasonality significantly impacts earnings. Our analysis, based on data from the past 12 months, shows that the peak revenue month for STRs in Oleggio is typically August, while March often presents the lowest earnings, highlighting opportunities for strategic pricing adjustments during shoulder and low seasons. Explore the typical Airbnb income in Oleggio across different performance tiers:
- Best-in-class properties (Top 10%) achieve $2,412+ monthly, often utilizing dynamic pricing and superior guest experiences.
- Strong performing properties (Top 25%) earn $1,450 or more, indicating effective management and desirable locations/amenities.
- Typical properties (Median) generate around $909 per month, representing the average market performance.
- Entry-level properties (Bottom 25%) see earnings around $569, often with potential for optimization.
Average Monthly Airbnb Earnings Trend in Oleggio
Oleggio Airbnb Occupancy Rate Trends (2026)
Maximize your bookings by understanding the Oleggio STR occupancy trends. Seasonal demand shifts significantly influence how often properties are booked. Typically, Julysees the highest demand (peak season occupancy), while March experiences the lowest (low season). Effective strategies, like adjusting minimum stays or offering promotions, can boost occupancy during slower periods. Here's how different property tiers perform in Oleggio:
- Best-in-class properties (Top 10%) achieve 76%+ occupancy, indicating high desirability and potentially optimized availability.
- Strong performing properties (Top 25%) maintain 65% or higher occupancy, suggesting good market fit and guest satisfaction.
- Typical properties (Median) have an occupancy rate around 48%.
- Entry-level properties (Bottom 25%) average 32% occupancy, potentially facing higher vacancy.
Average Monthly Occupancy Rate Trend in Oleggio
Average Daily Rate (ADR) Airbnb Trends in Oleggio (2026)
Effective short term rental pricing strategy in Oleggio involves understanding monthly ADR fluctuations. The Average Daily Rate (ADR) for Airbnb in Oleggio typically peaks in August and dips lowest during April. Leveraging Airbnb dynamic pricing tools or strategies based on this seasonality can significantly boost revenue. Here's a look at the typical nightly rates achieved:
- Best-in-class properties (Top 10%) command rates of $140+ per night, often due to premium features or locations.
- Strong performing properties (Top 25%) achieve nightly rates of $110 or more.
- Typical properties (Median) charge around $77 per night.
- Entry-level properties (Bottom 25%) earn around $55 per night.
Average Daily Rate (ADR) Trend by Month in Oleggio
Get Live Oleggio Market Intelligence 👇
Explore Real-time Analytics
Airbnb Seasonality Analysis & Trends in Oleggio (2025)
Peak Season (August, July, June)
- Revenue averages $1,469 per month
- Occupancy rates average 57.6%
- Daily rates average $90
Shoulder Season
- Revenue averages $1,161 per month
- Occupancy maintains around 48.8%
- Daily rates hold near $85
Low Season (February, March, November)
- Revenue drops to average $813 per month
- Occupancy decreases to average 37.3%
- Daily rates adjust to average $83
Seasonality Insights for Oleggio
- The Airbnb seasonality in Oleggio shows highly seasonal trends requiring careful strategy. While the sections above show seasonal averages, it's also insightful to look at the extremes:
- During the high season, the absolute peak month showcases Oleggio's highest earning potential, with monthly revenues capable of climbing to $1,665, occupancy reaching a high of 62.1%, and ADRs peaking at $93.
- Conversely, the slowest single month of the year, typically falling within the low season, marks the market's lowest point. In this month, revenue might dip to $662, occupancy could drop to 30.2%, and ADRs may adjust down to $82.
- Understanding both the seasonal averages and these monthly peaks and troughs in revenue, occupancy, and ADR is crucial for maximizing your Airbnb profit potential in Oleggio.
Seasonal Strategies for Maximizing Profit
- Peak Season: Maximize revenue through premium pricing and potentially longer minimum stays. Ensure high availability.
- Low Season: Offer competitive pricing, special promotions (e.g., extended stay discounts), and flexible cancellation policies. Target off-season travelers like remote workers or budget-conscious guests.
- Shoulder Seasons: Implement dynamic pricing that balances peak and low rates. Target weekend travelers or specific events. Offer slightly more flexible terms than peak season.
- Regularly analyze your own performance against these Oleggio seasonality benchmarks and adjust your pricing and availability strategy accordingly.
Best Areas for Airbnb Investment in Oleggio (2026)
Exploring the top neighborhoods for short-term rentals in Oleggio? This section highlights key areas, outlining why they are attractive for hosts and guests, along with notable local attractions. Consider these locations based on your target guest profile and investment strategy.
| Neighborhood / Area | Why Host Here? (Target Guests & Appeal) | Key Attractions & Landmarks |
|---|---|---|
| Piazza della Repubblica | A central square surrounded by shops and cafes, ideal for tourists looking to explore the local culture and enjoy a coffee in a lively atmosphere. | Piazza della Repubblica, San Giovanni Battista Church, Local shops and cafes, Historic architecture |
| Oleggio Castle | A historic site offering stunning views and a glimpse into the region's past, attracting history enthusiasts and couples looking for romantic getaways. | Oleggio Castle, Nearby hiking trails, Scenic views of the surrounding countryside |
| Parco del Ticino | A beautiful natural park perfect for outdoor enthusiasts, offering opportunities for hiking, cycling, and bird watching, making it a draw for nature lovers. | Biking trails, Hiking paths, Wildlife viewing, Scenic picnic areas |
| Local Vineyards | Famous for its wine production, this area attracts wine lovers and tourists interested in vineyard tours and wine tasting experiences. | Vineyard tours, Wine tastings, Gastronomic experiences |
| Golf Club | An excellent option for golf enthusiasts looking to spend their holidays playing golf in a beautiful setting, with potential for hosting longer stays. | 18-hole golf course, Clubhouse dining, Events and tournaments |
| Oleggio Markets | Local markets that showcase the best of regional cuisine and artisan products, perfect for travelers wanting to immerse themselves in the local culture. | Weekly farmer's market, Artisan crafts, Local foods |
| Cascina Vigna | A rural area known for its tranquility and charm, attracting visitors looking for peace and relaxation in a countryside setting. | Beautiful landscapes, Rural tourism, Relaxing atmosphere |
| Cultural Festivals | Various events and festivals throughout the year attract both tourists and locals, providing an authentic cultural experience of the Italian lifestyle. | Food festivals, Music festivals, Art fairs |
Understanding Airbnb License Requirements & STR Laws in Oleggio (2026)
Yes, Oleggio, Piedmont, Italy enforces high STR regulations. Obtaining a license and ensuring compliance is almost certainly required according to current 2026 STR laws. Always verify the latest short term rental regulations and Airbnb license requirements directly with local government authorities for Oleggio to ensure full compliance before hosting.
(Source: AirROI data, 2026, based on 67% licensed listings)
Top Performing Airbnb Properties in Oleggio (2026)
Benchmark your potential! Explore examples of top-performing Airbnb properties in Oleggiobased on Trailing Twelve Month (TTM) revenue. Analyze their characteristics, revenue, occupancy rate, and ADR to understand what drives success in this market.
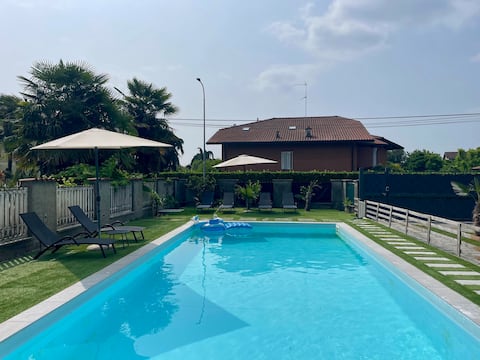
The Grace Place Apartment Malpensa
Entire Place • 2 bedrooms

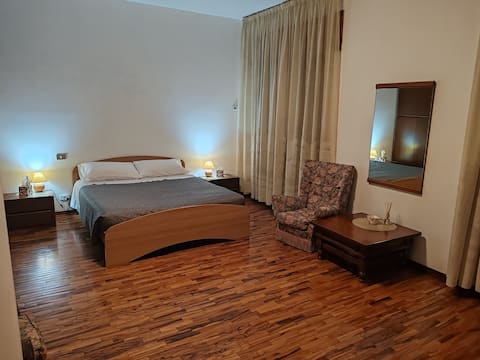
Family room on a farm
Entire Place • 2 bedrooms
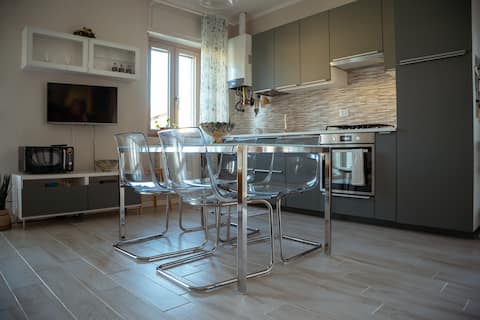
![[Malpensa-Self Check-In] Three-room apartment in Oleggio](https://a0.muscache.com/im/pictures/airflow/Hosting-1242704510396607592/original/902905a3-0e4b-4ac5-bedb-520d3af12cd3.jpg?im_w=480&im_format=avif)
[Malpensa-Self Check-In] Three-room apartment in Oleggio
Entire Place • 2 bedrooms
MXP Airport/Lakes apartment Oleggio center
Entire Place • 2 bedrooms
Le rondini Casa IRMA
Entire Place • 1 bedroom
Casa Nicca
Entire Place • 1 bedroom
Note: Performance varies based on location, size, amenities, seasonality, and management quality. Data reflects the past 12 months.
Top Performing Airbnb Hosts in Oleggio (2026)
Learn from the best! This table showcases top-performing Airbnb hosts in Oleggio based on the number of properties managed and estimated total revenue over the past year. Analyze their scale and performance metrics.
| Host Name | Properties | Grossing Revenue | Stay Reviews | Avg Rating |
|---|---|---|---|---|
| Mateo | 1 | $33,389 | 18 | 4.83/5.0 |
| Riccardo | 1 | $29,606 | 62 | 4.84/5.0 |
| Grazia | 3 | $24,117 | 2307 | 4.94/5.0 |
| Lucia | 2 | $21,096 | 222 | 5.00/5.0 |
| Omar | 1 | $19,863 | 104 | 4.60/5.0 |
| Antra | 1 | $14,435 | 119 | 4.81/5.0 |
| Paola | 2 | $12,780 | 192 | 4.93/5.0 |
| Enrico | 1 | $10,869 | 37 | 5.00/5.0 |
| Isabella | 2 | $8,614 | 45 | 4.94/5.0 |
| Rosanna | 1 | $3,765 | 1 | Not Rated |
Analyzing the strategies of top hosts, such as their property selection, pricing, and guest communication, can offer valuable lessons for optimizing your own Airbnb operations in Oleggio.
Dive Deeper: Advanced Oleggio STR Market Data (2026)
Ready to unlock more insights? AirROI provides access to advanced metrics and comprehensive Airbnb data for Oleggio. Explore detailed analytics beyond this report to refine your investment strategy, optimize pricing, and maximize your vacation rental profits.
Explore Advanced MetricsOleggio Short-Term Rental Market Composition (2026): Property & Room Types
Room Type Distribution
Property Type Distribution
Market Composition Insights for Oleggio
- The Oleggio Airbnb market composition is heavily skewed towards Entire Home/Apt listings, which make up 72.2% of the 18 active rentals. This indicates strong guest preference for privacy and space.
- Looking at the property type distribution in Oleggio, Apartment/Condo properties are the most common (55.6%), reflecting the local real estate landscape.
- Houses represent a significant 22.2% portion, catering likely to families or larger groups.
- The presence of 16.7% Hotel/Boutique listings indicates integration with traditional hospitality.
Oleggio Airbnb Room Capacity Analysis (2026): Bedroom Distribution
Distribution of Listings by Number of Bedrooms
Room Capacity Insights for Oleggio
- The dominant room capacity in Oleggio is 2 bedrooms listings, making up 50% of the market. This suggests a strong demand for properties suitable for couples or solo travelers.
- Together, 2 bedrooms and 1 bedroom properties represent 72.2% of the active Airbnb listings in Oleggio, indicating a high concentration in these sizes.
Oleggio Vacation Rental Guest Capacity Trends (2026)
Distribution of Listings by Guest Capacity
Guest Capacity Insights for Oleggio
- The most common guest capacity trend in Oleggio vacation rentals is listings accommodating 4 guests (38.9%). This suggests the primary traveler segment is likely small families or groups.
- Properties designed for 4 guests and 6 guests dominate the Oleggio STR market, accounting for 50.0% of listings.
- 22.2% of properties accommodate 6+ guests, serving the market segment for larger families or group travel in Oleggio.
- On average, properties in Oleggio are equipped to host 3.4 guests.
Oleggio Airbnb Booking Patterns (2026): Available vs. Booked Days
Available Days Distribution
Booked Days Distribution
Booking Pattern Insights for Oleggio
- The most common availability pattern in Oleggio falls within the 91-180 days range, representing 44.4% of listings. This suggests many properties have significant open periods on their calendars.
- Approximately 55.5% of listings show high availability (181+ days open annually), indicating potential for increased bookings or specific owner usage patterns.
- For booked days, the 181-270 days range is most frequent in Oleggio (44.4%), reflecting common guest stay durations or potential owner blocking patterns.
- A notable 44.4% of properties secure long booking periods (181+ days booked per year), highlighting successful long-term rental strategies or significant owner usage.
Oleggio Airbnb Minimum Stay Requirements Analysis
Distribution of Listings by Minimum Night Requirement
1 Night
13 listings
72.2% of total
7-29 Nights
1 listings
5.6% of total
30+ Nights
4 listings
22.2% of total
Key Insights
- The most prevalent minimum stay requirement in Oleggio is 1 Night, adopted by 72.2% of listings. This highlights the market's preference for shorter, flexible bookings.
- A strong majority (72.2%) of the Oleggio Airbnb data shows acceptance of very short stays (1-2 nights), indicating a dynamic, high-turnover market.
- A significant segment (22.2%) caters to monthly stays (30+ nights) in Oleggio, pointing to opportunities in the extended-stay market.
Recommendations
- Align with the market by considering a 1 Night minimum stay, as 72.2% of Oleggio hosts use this setting.
- Explore offering discounts for stays of 30+ nights to attract the 22.2% of the market seeking extended stays.
- Adjust minimum nights based on seasonality – potentially shorter during low season and longer during peak demand periods in Oleggio.
Oleggio Airbnb Cancellation Policy Trends Analysis (2026)
Flexible
11 listings
61.1% of total
Moderate
7 listings
38.9% of total
Cancellation Policy Insights for Oleggio
- The prevailing Airbnb cancellation policy trend in Oleggio is Flexible, used by 61.1% of listings.
- The market strongly favors guest-friendly terms, with 100.0% of listings offering Flexible or Moderate policies. This suggests guests in Oleggio may expect booking flexibility.
Recommendations for Hosts
- Consider adopting a Flexible policy to align with the 61.1% market standard in Oleggio.
- Given the high prevalence of Flexible policies (61.1%), offering this can enhance booking appeal, especially during shoulder seasons.
- Regularly review your cancellation policy against competitors and market demand shifts in Oleggio.
Oleggio STR Booking Lead Time Analysis (2026)
Average Booking Lead Time by Month
Booking Lead Time Insights for Oleggio
- The overall average booking lead time for vacation rentals in Oleggio is 41 days.
- Guests book furthest in advance for stays during July (average 64 days), likely coinciding with peak travel demand or local events.
- The shortest booking windows occur for stays in December (average 30 days), indicating more last-minute travel plans during this time.
- Seasonally, Summer (59 days avg.) sees the longest lead times, while Winter (30 days avg.) has the shortest, reflecting typical travel planning cycles.
Recommendations for Hosts
- Use the overall average lead time (41 days) as a baseline for your pricing and availability strategy in Oleggio.
- For July stays, consider implementing length-of-stay discounts or slightly higher rates for bookings made less than 64 days out to capitalize on advance planning.
- Target marketing efforts for the Summer season well in advance (at least 59 days) to capture early planners.
- Monitor your own booking lead times against these Oleggio averages to identify opportunities for dynamic pricing adjustments.
Popular & Essential Airbnb Amenities in Oleggio (2026)
Amenity Prevalence
Amenity Insights for Oleggio
- Essential amenities in Oleggio that guests expect include: Wifi. Lacking these (this) could significantly impact bookings.
- Popular amenities like Hair dryer, Bidet, Washer are common but not universal. Offering these can provide a competitive edge.
Recommendations for Hosts
- Ensure your listing includes all essential amenities for Oleggio: Wifi.
- Consider adding popular differentiators like Hair dryer or Bidet to increase appeal.
- Highlight unique or less common amenities you offer (e.g., hot tub, dedicated workspace, EV charger) in your listing description and photos.
- Regularly check competitor amenities in Oleggio to stay competitive.
Oleggio Airbnb Guest Demographics & Profile Analysis (2026)
Guest Profile Summary for Oleggio
- The typical guest profile for Airbnb in Oleggio consists of predominantly international visitors (83%), with top international origins including United States, typically belonging to the Post-2000s (Gen Z/Alpha) group (50%), primarily speaking English or French.
- Domestic travelers account for 17.3% of guests.
- Key international markets include Italy (17.3%) and United States (16.3%).
- Top languages spoken are English (38.9%) followed by French (13%).
- A significant demographic segment is the Post-2000s (Gen Z/Alpha) group, representing 50% of guests.
Recommendations for Hosts
- Focus marketing internationally, particularly towards travelers from United States.
- Tailor amenities and listing descriptions to appeal to the dominant Post-2000s (Gen Z/Alpha) demographic (e.g., highlight fast WiFi, smart home features, local guides).
- Highlight unique local experiences or amenities relevant to the primary guest profile.
- Consider seasonal promotions aligned with peak travel times for key origin markets.
Nearby Short-Term Rental Market Comparison
How does the Oleggio Airbnb market stack up against its neighbors? Compare key performance metrics like average monthly revenue, ADR, and occupancy rates in surrounding areas to understand the broader regional STR landscape.
| Market | Active Properties | Monthly Revenue | Daily Rate | Avg. Occupancy |
|---|---|---|---|---|
| Lauterbrunnen | 553 | $6,218 | $503.89 | 52% |
| Ranco | 12 | $5,783 | $521.03 | 37% |
| Matten bei Interlaken | 63 | $5,772 | $343.53 | 61% |
| Brienzwiler | 11 | $5,715 | $547.95 | 61% |
| Grindelwald | 509 | $5,671 | $398.51 | 56% |
| Monteu Roero | 12 | $5,441 | $416.40 | 42% |
| Niederried bei Interlaken | 18 | $5,377 | $515.47 | 41% |
| Zermatt | 780 | $5,345 | $498.13 | 48% |
| Interlaken | 327 | $5,079 | $396.45 | 54% |
| Oberhofen am Thunersee | 27 | $4,934 | $329.39 | 52% |