Prali Airbnb Market Analysis 2026: Short Term Rental Data & Vacation Rental Statistics in Piedmont, Italy
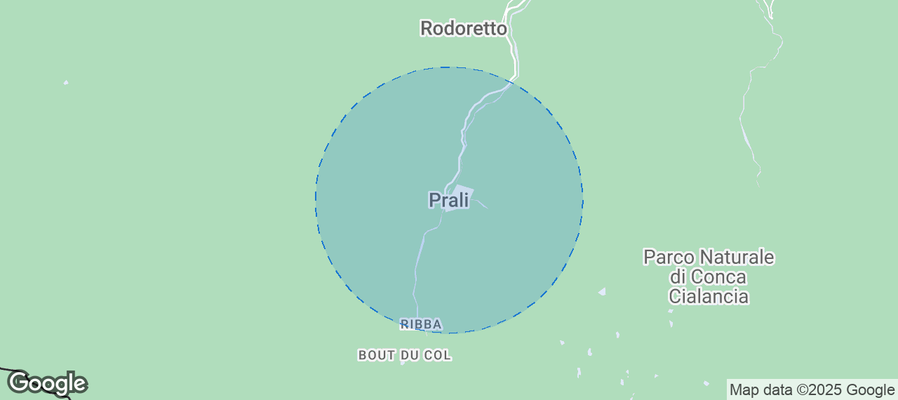
Is Airbnb profitable in Prali in 2026? Explore comprehensive Airbnb analytics for Prali, Piedmont, Italy to uncover income potential. This 2026 STR market report for Prali, based on AirROI data from August 2024 to July 2025, reveals key trends in the niche market of 18 active listings.
Whether you're considering an Airbnb investment in Prali, optimizing your existing vacation rental, or exploring rental arbitrage opportunities, understanding the Prali Airbnb data is crucial. Leveraging the low regulation environment is key to maximizing your short term rental income potential. Let's dive into the specifics.
Key Prali Airbnb Performance Metrics Overview
Monthly Airbnb Revenue Variations & Income Potential in Prali (2026)
Understanding the monthly revenue variations for Airbnb listings in Prali is key to maximizing your short term rental income potential. Seasonality significantly impacts earnings. Our analysis, based on data from the past 12 months, shows that the peak revenue month for STRs in Prali is typically August, while April often presents the lowest earnings, highlighting opportunities for strategic pricing adjustments during shoulder and low seasons. Explore the typical Airbnb income in Prali across different performance tiers:
- Best-in-class properties (Top 10%) achieve $1,888+ monthly, often utilizing dynamic pricing and superior guest experiences.
- Strong performing properties (Top 25%) earn $1,098 or more, indicating effective management and desirable locations/amenities.
- Typical properties (Median) generate around $629 per month, representing the average market performance.
- Entry-level properties (Bottom 25%) see earnings around $366, often with potential for optimization.
Average Monthly Airbnb Earnings Trend in Prali
Prali Airbnb Occupancy Rate Trends (2026)
Maximize your bookings by understanding the Prali STR occupancy trends. Seasonal demand shifts significantly influence how often properties are booked. Typically, Augustsees the highest demand (peak season occupancy), while June experiences the lowest (low season). Effective strategies, like adjusting minimum stays or offering promotions, can boost occupancy during slower periods. Here's how different property tiers perform in Prali:
- Best-in-class properties (Top 10%) achieve 63%+ occupancy, indicating high desirability and potentially optimized availability.
- Strong performing properties (Top 25%) maintain 41% or higher occupancy, suggesting good market fit and guest satisfaction.
- Typical properties (Median) have an occupancy rate around 23%.
- Entry-level properties (Bottom 25%) average 12% occupancy, potentially facing higher vacancy.
Average Monthly Occupancy Rate Trend in Prali
Average Daily Rate (ADR) Airbnb Trends in Prali (2026)
Effective short term rental pricing strategy in Prali involves understanding monthly ADR fluctuations. The Average Daily Rate (ADR) for Airbnb in Prali typically peaks in July and dips lowest during April. Leveraging Airbnb dynamic pricing tools or strategies based on this seasonality can significantly boost revenue. Here's a look at the typical nightly rates achieved:
- Best-in-class properties (Top 10%) command rates of $129+ per night, often due to premium features or locations.
- Strong performing properties (Top 25%) achieve nightly rates of $109 or more.
- Typical properties (Median) charge around $91 per night.
- Entry-level properties (Bottom 25%) earn around $77 per night.
Average Daily Rate (ADR) Trend by Month in Prali
Get Live Prali Market Intelligence 👇
Explore Real-time Analytics
Airbnb Seasonality Analysis & Trends in Prali (2025)
Peak Season (August, January, December)
- Revenue averages $1,327 per month
- Occupancy rates average 44.8%
- Daily rates average $93
Shoulder Season
- Revenue averages $749 per month
- Occupancy maintains around 28.3%
- Daily rates hold near $95
Low Season (March, April, June)
- Revenue drops to average $475 per month
- Occupancy decreases to average 17.7%
- Daily rates adjust to average $95
Seasonality Insights for Prali
- The Airbnb seasonality in Prali shows highly seasonal trends requiring careful strategy. While the sections above show seasonal averages, it's also insightful to look at the extremes:
- During the high season, the absolute peak month showcases Prali's highest earning potential, with monthly revenues capable of climbing to $1,753, occupancy reaching a high of 64.2%, and ADRs peaking at $103.
- Conversely, the slowest single month of the year, typically falling within the low season, marks the market's lowest point. In this month, revenue might dip to $391, occupancy could drop to 15.3%, and ADRs may adjust down to $91.
- Understanding both the seasonal averages and these monthly peaks and troughs in revenue, occupancy, and ADR is crucial for maximizing your Airbnb profit potential in Prali.
Seasonal Strategies for Maximizing Profit
- Peak Season: Maximize revenue through premium pricing and potentially longer minimum stays. Ensure high availability.
- Low Season: Offer competitive pricing, special promotions (e.g., extended stay discounts), and flexible cancellation policies. Target off-season travelers like remote workers or budget-conscious guests.
- Shoulder Seasons: Implement dynamic pricing that balances peak and low rates. Target weekend travelers or specific events. Offer slightly more flexible terms than peak season.
- Regularly analyze your own performance against these Prali seasonality benchmarks and adjust your pricing and availability strategy accordingly.
Best Areas for Airbnb Investment in Prali (2026)
Exploring the top neighborhoods for short-term rentals in Prali? This section highlights key areas, outlining why they are attractive for hosts and guests, along with notable local attractions. Consider these locations based on your target guest profile and investment strategy.
| Neighborhood / Area | Why Host Here? (Target Guests & Appeal) | Key Attractions & Landmarks |
|---|---|---|
| Prali Village | Charming village known for its stunning mountain scenery and access to outdoor activities such as hiking and skiing. Ideal for nature lovers and those seeking tranquility away from the city. | Skiing at San Giovanni, Hiking Trails, Mountain Biking, Local Artisan Shops, Traditional Piedmont Cuisine |
| Sestriere | Famous ski resort nearby, attracting winter sports enthusiasts. Offers year-round activities including hiking and mountain biking, making it a prime location for tourists throughout the year. | Milky Way Ski Area, Sestriere Golf, Via Lattea Ski Resort, Chalet Lanza, Local Nightlife and Dining |
| Cesana Torinese | A picturesque alpine village that is part of the Via Lattea ski area, Cesana offers excellent skiing in winter and beautiful landscapes in summer. | Ski Facilities, Parco Naturale del Gran Bosco di Salbertrand, Local Restaurants, Hiking Trails, Historical Sites |
| Fenestrelle | Home to the impressive Fenestrelle Fortress, this area attracts history buffs and those looking for cultural experiences combined with outdoor adventures. | Fenestrelle Fortress, Local Hiking Paths, Historical Tours, Piedmontese Cuisine |
| Sangone River | An area known for its natural beauty and outdoor activities, including cycling and picnics along the riverbanks. Great for families and nature enthusiasts. | Sangone River Walks, Picnic Areas, Cycling Paths, Scenic Views |
| Monte Cuneo | A less frequented area, perfect for those looking for peace and quiet. Offers stunning mountain views and opportunities for hiking and nature exploration. | Hiking Trails, Mountain Views, Wildlife Observation |
| Abbadia Alpina | A small town with a quaint atmosphere, known for its hospitality and local traditions. Attractive for visitors looking for an authentic Piedmont experience. | Local Markets, Cultural Events, Traditional Food |
| Giaveno | A historical town with rich culture and beautiful architecture. Great for tourists wanting to explore local history and nature. | Historical Buildings, Museums, Mountain Paths, Local Crafts |
Understanding Airbnb License Requirements & STR Laws in Prali (2026)
While Prali, Piedmont, Italy currently shows low STR regulations, specific Airbnb license requirements might still exist or change. Always verify the latest short term rental regulations and Airbnb license requirements directly with local government authorities for Prali to ensure full compliance before hosting.
(Source: AirROI data, 2026, based on 6% licensed listings)
Top Performing Airbnb Properties in Prali (2026)
Benchmark your potential! Explore examples of top-performing Airbnb properties in Pralibased on Trailing Twelve Month (TTM) revenue. Analyze their characteristics, revenue, occupancy rate, and ADR to understand what drives success in this market.

La Pigna - Comfortable two-room apartment in Prali
Entire Place • 1 bedroom
Il Fior di Neve by Interhome
Entire Place • 1 bedroom

Delightful apartment in the Alps
Entire Place • 2 bedrooms

La Casetta
Entire Place • 1 bedroom
Casa Ghigo
Entire Place • 1 bedroom

Prali Sky House/ 4 beds w/free garden/free parking
Entire Place • 2 bedrooms
Note: Performance varies based on location, size, amenities, seasonality, and management quality. Data reflects the past 12 months.
Top Performing Airbnb Hosts in Prali (2026)
Learn from the best! This table showcases top-performing Airbnb hosts in Prali based on the number of properties managed and estimated total revenue over the past year. Analyze their scale and performance metrics.
| Host Name | Properties | Grossing Revenue | Stay Reviews | Avg Rating |
|---|---|---|---|---|
| Elisabetta | 1 | $13,465 | 68 | 4.90/5.0 |
| Alessandra - Interhome Group | 1 | $12,633 | 10 | 5.00/5.0 |
| Luigi | 1 | $10,191 | 11 | 4.45/5.0 |
| Alessandra | 1 | $9,026 | 8 | 4.50/5.0 |
| Alessio Giuseppe | 1 | $7,269 | 1 | Not Rated |
| Elise | 2 | $6,782 | 5 | 4.25/5.0 |
| Giulia | 1 | $5,013 | 2 | Not Rated |
| Davide | 1 | $4,702 | 7 | 4.57/5.0 |
| Gian Luigi | 1 | $3,990 | 17 | 4.41/5.0 |
| Sofia | 1 | $3,935 | 3 | 5.00/5.0 |
Analyzing the strategies of top hosts, such as their property selection, pricing, and guest communication, can offer valuable lessons for optimizing your own Airbnb operations in Prali.
Dive Deeper: Advanced Prali STR Market Data (2026)
Ready to unlock more insights? AirROI provides access to advanced metrics and comprehensive Airbnb data for Prali. Explore detailed analytics beyond this report to refine your investment strategy, optimize pricing, and maximize your vacation rental profits.
Explore Advanced MetricsPrali Short-Term Rental Market Composition (2026): Property & Room Types
Room Type Distribution
Property Type Distribution
Market Composition Insights for Prali
- The Prali Airbnb market composition is heavily skewed towards Entire Home/Apt listings, which make up 100% of the 18 active rentals. This indicates strong guest preference for privacy and space.
- Looking at the property type distribution in Prali, Apartment/Condo properties are the most common (72.2%), reflecting the local real estate landscape.
- Houses represent a significant 16.7% portion, catering likely to families or larger groups.
Prali Airbnb Room Capacity Analysis (2026): Bedroom Distribution
Distribution of Listings by Number of Bedrooms
Room Capacity Insights for Prali
- The dominant room capacity in Prali is 1 bedroom listings, making up 55.6% of the market. This suggests a strong demand for properties suitable for couples or solo travelers.
- Together, 1 bedroom and 2 bedrooms properties represent 94.5% of the active Airbnb listings in Prali, indicating a high concentration in these sizes.
- With over half the market (55.6%) consisting of studios or 1-bedroom units, Prali is particularly well-suited for individuals or couples.
Prali Vacation Rental Guest Capacity Trends (2026)
Distribution of Listings by Guest Capacity
Guest Capacity Insights for Prali
- The most common guest capacity trend in Prali vacation rentals is listings accommodating 4 guests (77.8%). This suggests the primary traveler segment is likely small families or groups.
- Properties designed for 4 guests and 5 guests dominate the Prali STR market, accounting for 88.9% of listings.
- On average, properties in Prali are equipped to host 4.2 guests.
Prali Airbnb Booking Patterns (2026): Available vs. Booked Days
Available Days Distribution
Booked Days Distribution
Booking Pattern Insights for Prali
- The most common availability pattern in Prali falls within the 271-366 days range, representing 83.3% of listings. This suggests many properties have significant open periods on their calendars.
- Approximately 94.4% of listings show high availability (181+ days open annually), indicating potential for increased bookings or specific owner usage patterns.
- For booked days, the 31-90 days range is most frequent in Prali (55.6%), reflecting common guest stay durations or potential owner blocking patterns.
- A notable 5.6% of properties secure long booking periods (181+ days booked per year), highlighting successful long-term rental strategies or significant owner usage.
Prali Airbnb Minimum Stay Requirements Analysis
Distribution of Listings by Minimum Night Requirement
1 Night
4 listings
22.2% of total
2 Nights
7 listings
38.9% of total
3 Nights
1 listings
5.6% of total
4-6 Nights
2 listings
11.1% of total
7-29 Nights
2 listings
11.1% of total
30+ Nights
2 listings
11.1% of total
Key Insights
- The most prevalent minimum stay requirement in Prali is 2 Nights, adopted by 38.9% of listings. This highlights the market's preference for shorter, flexible bookings.
- A strong majority (61.1%) of the Prali Airbnb data shows acceptance of very short stays (1-2 nights), indicating a dynamic, high-turnover market.
- A significant segment (11.1%) caters to monthly stays (30+ nights) in Prali, pointing to opportunities in the extended-stay market.
Recommendations
- Align with the market by considering a 2 Nights minimum stay, as 38.9% of Prali hosts use this setting.
- If feasible, allowing 1-night stays, especially midweek or during low season, could capture last-minute bookings, as only 22.2% currently do.
- Explore offering discounts for stays of 30+ nights to attract the 11.1% of the market seeking extended stays.
- Adjust minimum nights based on seasonality – potentially shorter during low season and longer during peak demand periods in Prali.
Prali Airbnb Cancellation Policy Trends Analysis (2026)
Super Strict 30 Days
1 listings
5.9% of total
Flexible
6 listings
35.3% of total
Moderate
8 listings
47.1% of total
Strict
2 listings
11.8% of total
Cancellation Policy Insights for Prali
- The prevailing Airbnb cancellation policy trend in Prali is Moderate, used by 47.1% of listings.
- The market strongly favors guest-friendly terms, with 82.4% of listings offering Flexible or Moderate policies. This suggests guests in Prali may expect booking flexibility.
Recommendations for Hosts
- Consider adopting a Moderate policy to align with the 47.1% market standard in Prali.
- Using a Strict policy might deter some guests, as only 11.8% of listings use it. Evaluate if potential revenue protection outweighs possible lower booking rates.
- Regularly review your cancellation policy against competitors and market demand shifts in Prali.
Prali STR Booking Lead Time Analysis (2026)
Average Booking Lead Time by Month
Booking Lead Time Insights for Prali
- The overall average booking lead time for vacation rentals in Prali is 33 days.
- Guests book furthest in advance for stays during July (average 100 days), likely coinciding with peak travel demand or local events.
- The shortest booking windows occur for stays in September (average 9 days), indicating more last-minute travel plans during this time.
- Seasonally, Summer (50 days avg.) sees the longest lead times, while Winter (36 days avg.) has the shortest, reflecting typical travel planning cycles.
Recommendations for Hosts
- Use the overall average lead time (33 days) as a baseline for your pricing and availability strategy in Prali.
- For July stays, consider implementing length-of-stay discounts or slightly higher rates for bookings made less than 100 days out to capitalize on advance planning.
- During September, focus on last-minute booking availability and promotions, as guests book with very short notice (9 days avg.).
- Target marketing efforts for the Summer season well in advance (at least 50 days) to capture early planners.
- Monitor your own booking lead times against these Prali averages to identify opportunities for dynamic pricing adjustments.
Popular & Essential Airbnb Amenities in Prali (2026)
Amenity Prevalence
Amenity Insights for Prali
- Popular amenities like Kitchen, Heating, Hair dryer are common but not universal. Offering these can provide a competitive edge.
Recommendations for Hosts
- Consider adding popular differentiators like Kitchen or Heating to increase appeal.
- Highlight unique or less common amenities you offer (e.g., hot tub, dedicated workspace, EV charger) in your listing description and photos.
- Regularly check competitor amenities in Prali to stay competitive.
Prali Airbnb Guest Demographics & Profile Analysis (2026)
Guest Profile Summary for Prali
- The typical guest profile for Airbnb in Prali consists of primarily domestic travelers (88%), often arriving from nearby Turin, typically belonging to the Post-2000s (Gen Z/Alpha) group (50%), primarily speaking English or Italian.
- Domestic travelers account for 87.5% of guests.
- Key international markets include Italy (87.5%) and France (6.3%).
- Top languages spoken are English (36.7%) followed by Italian (32.7%).
- A significant demographic segment is the Post-2000s (Gen Z/Alpha) group, representing 50% of guests.
Recommendations for Hosts
- Target domestic marketing efforts towards travelers from Turin and Milan.
- Tailor amenities and listing descriptions to appeal to the dominant Post-2000s (Gen Z/Alpha) demographic (e.g., highlight fast WiFi, smart home features, local guides).
- Highlight unique local experiences or amenities relevant to the primary guest profile.
- Consider seasonal promotions aligned with peak travel times for key origin markets.
Nearby Short-Term Rental Market Comparison
How does the Prali Airbnb market stack up against its neighbors? Compare key performance metrics like average monthly revenue, ADR, and occupancy rates in surrounding areas to understand the broader regional STR landscape.
| Market | Active Properties | Monthly Revenue | Daily Rate | Avg. Occupancy |
|---|---|---|---|---|
| Les Clefs | 36 | $5,616 | $301.11 | 44% |
| Monteu Roero | 11 | $5,536 | $414.19 | 44% |
| Cossano Belbo | 12 | $4,172 | $324.75 | 40% |
| Manigod | 210 | $4,007 | $452.77 | 40% |
| Saint-Jean-Cap-Ferrat | 110 | $3,687 | $425.62 | 44% |
| Ranco | 13 | $3,656 | $435.67 | 38% |
| Saint-Nicolas-la-Chapelle | 26 | $3,498 | $441.78 | 42% |
| Ramatuelle | 227 | $3,318 | $668.30 | 37% |
| Val-d'Isère | 481 | $3,302 | $387.20 | 47% |
| Saint-Tropez | 766 | $3,028 | $489.06 | 37% |