Premia Airbnb Market Analysis 2026: Short Term Rental Data & Vacation Rental Statistics in Piedmont, Italy
Is Airbnb profitable in Premia in 2026? Explore comprehensive Airbnb analytics for Premia, Piedmont, Italy to uncover income potential. This 2026 STR market report for Premia, based on AirROI data from July 2024 to June 2025, reveals key trends in the niche market of 18 active listings.
Whether you're considering an Airbnb investment in Premia, optimizing your existing vacation rental, or exploring rental arbitrage opportunities, understanding the Premia Airbnb data is crucial. Leveraging the low regulation environment is key to maximizing your short term rental income potential. Let's dive into the specifics.
Key Premia Airbnb Performance Metrics Overview
Monthly Airbnb Revenue Variations & Income Potential in Premia (2026)
Understanding the monthly revenue variations for Airbnb listings in Premia is key to maximizing your short term rental income potential. Seasonality significantly impacts earnings. Our analysis, based on data from the past 12 months, shows that the peak revenue month for STRs in Premia is typically August, while April often presents the lowest earnings, highlighting opportunities for strategic pricing adjustments during shoulder and low seasons. Explore the typical Airbnb income in Premia across different performance tiers:
- Best-in-class properties (Top 10%) achieve $2,281+ monthly, often utilizing dynamic pricing and superior guest experiences.
- Strong performing properties (Top 25%) earn $1,338 or more, indicating effective management and desirable locations/amenities.
- Typical properties (Median) generate around $867 per month, representing the average market performance.
- Entry-level properties (Bottom 25%) see earnings around $591, often with potential for optimization.
Average Monthly Airbnb Earnings Trend in Premia
Premia Airbnb Occupancy Rate Trends (2026)
Maximize your bookings by understanding the Premia STR occupancy trends. Seasonal demand shifts significantly influence how often properties are booked. Typically, Augustsees the highest demand (peak season occupancy), while February experiences the lowest (low season). Effective strategies, like adjusting minimum stays or offering promotions, can boost occupancy during slower periods. Here's how different property tiers perform in Premia:
- Best-in-class properties (Top 10%) achieve 52%+ occupancy, indicating high desirability and potentially optimized availability.
- Strong performing properties (Top 25%) maintain 39% or higher occupancy, suggesting good market fit and guest satisfaction.
- Typical properties (Median) have an occupancy rate around 21%.
- Entry-level properties (Bottom 25%) average 13% occupancy, potentially facing higher vacancy.
Average Monthly Occupancy Rate Trend in Premia
Average Daily Rate (ADR) Airbnb Trends in Premia (2026)
Effective short term rental pricing strategy in Premia involves understanding monthly ADR fluctuations. The Average Daily Rate (ADR) for Airbnb in Premia typically peaks in June and dips lowest during January. Leveraging Airbnb dynamic pricing tools or strategies based on this seasonality can significantly boost revenue. Here's a look at the typical nightly rates achieved:
- Best-in-class properties (Top 10%) command rates of $181+ per night, often due to premium features or locations.
- Strong performing properties (Top 25%) achieve nightly rates of $169 or more.
- Typical properties (Median) charge around $143 per night.
- Entry-level properties (Bottom 25%) earn around $121 per night.
Average Daily Rate (ADR) Trend by Month in Premia
Get Live Premia Market Intelligence 👇
Explore Real-time Analytics
Airbnb Seasonality Analysis & Trends in Premia (2025)
Peak Season (August, July, March)
- Revenue averages $1,980 per month
- Occupancy rates average 47.6%
- Daily rates average $148
Shoulder Season
- Revenue averages $853 per month
- Occupancy maintains around 19.8%
- Daily rates hold near $149
Low Season (January, April, September)
- Revenue drops to average $714 per month
- Occupancy decreases to average 16.8%
- Daily rates adjust to average $147
Seasonality Insights for Premia
- The Airbnb seasonality in Premia shows highly seasonal trends requiring careful strategy. While the sections above show seasonal averages, it's also insightful to look at the extremes:
- During the high season, the absolute peak month showcases Premia's highest earning potential, with monthly revenues capable of climbing to $3,017, occupancy reaching a high of 68.1%, and ADRs peaking at $161.
- Conversely, the slowest single month of the year, typically falling within the low season, marks the market's lowest point. In this month, revenue might dip to $692, occupancy could drop to 7.9%, and ADRs may adjust down to $141.
- Understanding both the seasonal averages and these monthly peaks and troughs in revenue, occupancy, and ADR is crucial for maximizing your Airbnb profit potential in Premia.
Seasonal Strategies for Maximizing Profit
- Peak Season: Maximize revenue through premium pricing and potentially longer minimum stays. Ensure high availability.
- Low Season: Offer competitive pricing, special promotions (e.g., extended stay discounts), and flexible cancellation policies. Target off-season travelers like remote workers or budget-conscious guests.
- Shoulder Seasons: Implement dynamic pricing that balances peak and low rates. Target weekend travelers or specific events. Offer slightly more flexible terms than peak season.
- Regularly analyze your own performance against these Premia seasonality benchmarks and adjust your pricing and availability strategy accordingly.
Best Areas for Airbnb Investment in Premia (2026)
Exploring the top neighborhoods for short-term rentals in Premia? This section highlights key areas, outlining why they are attractive for hosts and guests, along with notable local attractions. Consider these locations based on your target guest profile and investment strategy.
| Neighborhood / Area | Why Host Here? (Target Guests & Appeal) | Key Attractions & Landmarks |
|---|---|---|
| Premia Centro | The heart of Premia, offering a charming atmosphere with local shops and restaurants. Ideal for tourists looking to experience the authentic Italian village life. | Church of San Giovanni Battista, Premia's local market, Scenic walking trails, Vodafone Park in nearby areas |
| Lake Maggiore | A short distance from Premia, Lake Maggiore is a stunning destination for water sports and relaxing by the lake. Popular with tourists seeking nature and outdoor activities. | Isola Bella, Palazzo Borromeo, Boat rentals, Hiking trails, Beach access |
| Val Vigezzo | Known as the 'Valley of the Painters', this area is famous for its beautiful landscapes and artistic heritage. Attracts outdoor enthusiasts and art lovers alike. | Malesco village, Art galleries, Hiking paths, Scenic viewpoints, Local festivals |
| Ski Areas around Premia | Offers skiing and snowboarding opportunities during the winter season. A hit with winter sports lovers and families looking for a snowy getaway. | Premia Ski Resort, Ski schools, Snowshoeing trails, Gastronomic experiences in mountain huts, Winter festivals |
| San Domenico | Another popular ski destination, it features excellent slopes and easy access for tourists. A fantastic spot for both winter sports and summer hiking. | San Domenico Ski Resort, Scenic cable cars, Hiking trails, Gastronomy offerings, Beautiful alpine landscapes |
| Historical Towns Nearby | Exploring the nearby historical towns offers a glimpse into traditional Italian culture and architecture. Great for cultural tourism. | Santa Maria Maggiore, Villadossola, Historic architecture, Local cuisine, Artisan shops |
| Natural Parks | Proximity to several natural parks offers nature lovers plenty of hiking and exploration options. A peaceful retreat for eco-tourists. | Val Grande National Park, Hiking trails, Wildlife watching, Nature photography, Scenic landscapes |
| Food and Wine Region | Piedmont is renowned for its culinary delights and wine production. Attracts gastronomes and wine lovers from around the world. | Local vineyards, Wine tasting tours, Regional cooking classes, Agriturismos, Traditional markets |
Understanding Airbnb License Requirements & STR Laws in Premia (2026)
While Premia, Piedmont, Italy currently shows low STR regulations, specific Airbnb license requirements might still exist or change. Always verify the latest short term rental regulations and Airbnb license requirements directly with local government authorities for Premia to ensure full compliance before hosting.
(Source: AirROI data, 2026, based on 6% licensed listings)
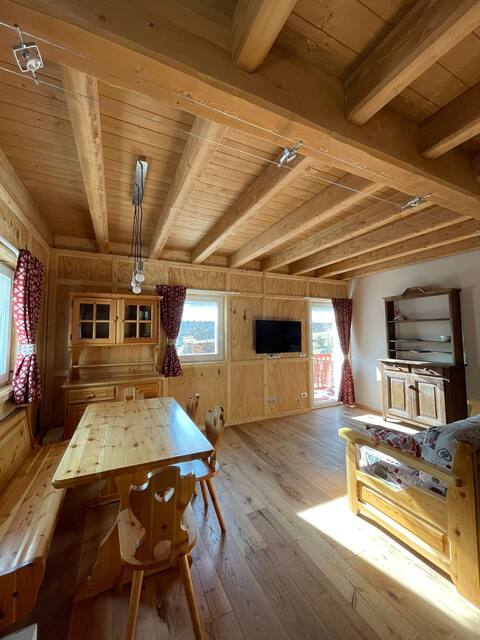
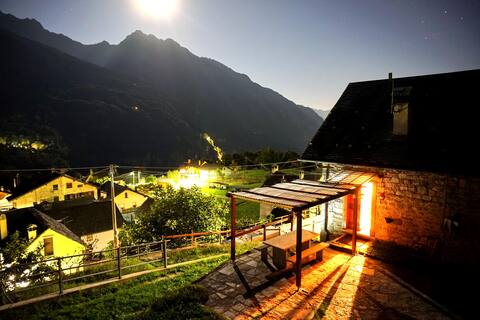
Top Performing Airbnb Properties in Premia (2026)
Benchmark your potential! Explore examples of top-performing Airbnb properties in Premiabased on Trailing Twelve Month (TTM) revenue. Analyze their characteristics, revenue, occupancy rate, and ADR to understand what drives success in this market.

Chalet Marina
Entire Place • 2 bedrooms

Alé Duri - Mountain & Climbing House
Entire Place • 2 bedrooms

Casa Bettina
Entire Place • 2 bedrooms
Apartment in Le Falesie vacation home
Entire Place • 2 bedrooms
Casa di Montagna Cresta
Entire Place • 2 bedrooms

Baggio House
Entire Place • 1 bedroom
Note: Performance varies based on location, size, amenities, seasonality, and management quality. Data reflects the past 12 months.
Top Performing Airbnb Hosts in Premia (2026)
Learn from the best! This table showcases top-performing Airbnb hosts in Premia based on the number of properties managed and estimated total revenue over the past year. Analyze their scale and performance metrics.
| Host Name | Properties | Grossing Revenue | Stay Reviews | Avg Rating |
|---|---|---|---|---|
| Dario | 6 | $25,114 | 22 | 4.47/5.0 |
| Giulia Sala | 1 | $21,267 | 68 | 4.78/5.0 |
| Marta | 2 | $14,633 | 2 | Not Rated |
| Andrea | 1 | $13,379 | 62 | 4.95/5.0 |
| Milena | 1 | $11,979 | 8 | 4.88/5.0 |
| Michal | 1 | $8,011 | 11 | 4.82/5.0 |
| Stefano | 1 | $6,676 | 11 | 4.55/5.0 |
| William | 3 | $6,228 | 57 | 4.84/5.0 |
| Roberto | 1 | $3,776 | 4 | 5.00/5.0 |
| Host #515675241 | 1 | $951 | 2 | Not Rated |
Analyzing the strategies of top hosts, such as their property selection, pricing, and guest communication, can offer valuable lessons for optimizing your own Airbnb operations in Premia.
Dive Deeper: Advanced Premia STR Market Data (2026)
Ready to unlock more insights? AirROI provides access to advanced metrics and comprehensive Airbnb data for Premia. Explore detailed analytics beyond this report to refine your investment strategy, optimize pricing, and maximize your vacation rental profits.
Explore Advanced MetricsPremia Short-Term Rental Market Composition (2026): Property & Room Types
Room Type Distribution
Property Type Distribution
Market Composition Insights for Premia
- The Premia Airbnb market composition is heavily skewed towards Entire Home/Apt listings, which make up 100% of the 18 active rentals. This indicates strong guest preference for privacy and space.
- Looking at the property type distribution in Premia, Apartment/Condo properties are the most common (61.1%), reflecting the local real estate landscape.
- Houses represent a significant 27.8% portion, catering likely to families or larger groups.
Premia Airbnb Room Capacity Analysis (2026): Bedroom Distribution
Distribution of Listings by Number of Bedrooms
Room Capacity Insights for Premia
- The dominant room capacity in Premia is 1 bedroom listings, making up 61.1% of the market. This suggests a strong demand for properties suitable for couples or solo travelers.
- Together, 1 bedroom and 2 bedrooms properties represent 100.0% of the active Airbnb listings in Premia, indicating a high concentration in these sizes.
- With over half the market (61.1%) consisting of studios or 1-bedroom units, Premia is particularly well-suited for individuals or couples.
Premia Vacation Rental Guest Capacity Trends (2026)
Distribution of Listings by Guest Capacity
Guest Capacity Insights for Premia
- The most common guest capacity trend in Premia vacation rentals is listings accommodating 6 guests (38.9%). This suggests the primary traveler segment is likely larger groups.
- Properties designed for 6 guests and 4 guests dominate the Premia STR market, accounting for 72.2% of listings.
- 44.5% of properties accommodate 6+ guests, serving the market segment for larger families or group travel in Premia.
- On average, properties in Premia are equipped to host 4.9 guests.
Premia Airbnb Booking Patterns (2026): Available vs. Booked Days
Available Days Distribution
Booked Days Distribution
Booking Pattern Insights for Premia
- The most common availability pattern in Premia falls within the 271-366 days range, representing 88.9% of listings. This suggests many properties have significant open periods on their calendars.
- Approximately 100.0% of listings show high availability (181+ days open annually), indicating potential for increased bookings or specific owner usage patterns.
- For booked days, the 1-30 days range is most frequent in Premia (61.1%), reflecting common guest stay durations or potential owner blocking patterns.
Premia Airbnb Minimum Stay Requirements Analysis
Distribution of Listings by Minimum Night Requirement
1 Night
4 listings
26.7% of total
2 Nights
3 listings
20% of total
4-6 Nights
5 listings
33.3% of total
7-29 Nights
1 listings
6.7% of total
30+ Nights
2 listings
13.3% of total
Key Insights
- The most prevalent minimum stay requirement in Premia is 4-6 Nights, adopted by 33.3% of listings. This highlights the market's preference for longer commitments.
- A significant segment (13.3%) caters to monthly stays (30+ nights) in Premia, pointing to opportunities in the extended-stay market.
Recommendations
- Align with the market by considering a 4-6 Nights minimum stay, as 33.3% of Premia hosts use this setting.
- If feasible, allowing 1-night stays, especially midweek or during low season, could capture last-minute bookings, as only 26.7% currently do.
- Explore offering discounts for stays of 30+ nights to attract the 13.3% of the market seeking extended stays.
- Adjust minimum nights based on seasonality – potentially shorter during low season and longer during peak demand periods in Premia.
Premia Airbnb Cancellation Policy Trends Analysis (2026)
Flexible
2 listings
11.1% of total
Moderate
5 listings
27.8% of total
Strict
11 listings
61.1% of total
Cancellation Policy Insights for Premia
- The prevailing Airbnb cancellation policy trend in Premia is Strict, used by 61.1% of listings.
- A majority (61.1%) of hosts in Premia utilize Firm or Strict policies, indicating a market where hosts prioritize booking security.
Recommendations for Hosts
- Consider adopting a Strict policy to align with the 61.1% market standard in Premia.
- With 61.1% using Strict terms, this is a viable option in Premia, particularly for high-value properties or during peak demand periods.
- Regularly review your cancellation policy against competitors and market demand shifts in Premia.
Premia STR Booking Lead Time Analysis (2026)
Average Booking Lead Time by Month
Booking Lead Time Insights for Premia
- The overall average booking lead time for vacation rentals in Premia is 29 days.
- Guests book furthest in advance for stays during February (average 54 days), likely coinciding with peak travel demand or local events.
- The shortest booking windows occur for stays in September (average 15 days), indicating more last-minute travel plans during this time.
- Seasonally, Winter (44 days avg.) sees the longest lead times, while Fall (16 days avg.) has the shortest, reflecting typical travel planning cycles.
Recommendations for Hosts
- Use the overall average lead time (29 days) as a baseline for your pricing and availability strategy in Premia.
- For February stays, consider implementing length-of-stay discounts or slightly higher rates for bookings made less than 54 days out to capitalize on advance planning.
- Target marketing efforts for the Winter season well in advance (at least 44 days) to capture early planners.
- Monitor your own booking lead times against these Premia averages to identify opportunities for dynamic pricing adjustments.
Popular & Essential Airbnb Amenities in Premia (2026)
Amenity data is currently unavailable for Premia.
Premia Airbnb Guest Demographics & Profile Analysis (2026)
Guest Profile Summary for Premia
- The typical guest profile for Airbnb in Premia consists of primarily domestic travelers (66%), often arriving from nearby Milan, typically belonging to the Post-2000s (Gen Z/Alpha) group (50%), primarily speaking English or Italian.
- Domestic travelers account for 65.6% of guests.
- Key international markets include Italy (65.6%) and Switzerland (15.6%).
- Top languages spoken are English (35.4%) followed by Italian (29.2%).
- A significant demographic segment is the Post-2000s (Gen Z/Alpha) group, representing 50% of guests.
Recommendations for Hosts
- Target domestic marketing efforts towards travelers from Milan and Turin.
- Tailor amenities and listing descriptions to appeal to the dominant Post-2000s (Gen Z/Alpha) demographic (e.g., highlight fast WiFi, smart home features, local guides).
- Highlight unique local experiences or amenities relevant to the primary guest profile.
- Consider seasonal promotions aligned with peak travel times for key origin markets.
Nearby Short-Term Rental Market Comparison
How does the Premia Airbnb market stack up against its neighbors? Compare key performance metrics like average monthly revenue, ADR, and occupancy rates in surrounding areas to understand the broader regional STR landscape.
| Market | Active Properties | Monthly Revenue | Daily Rate | Avg. Occupancy |
|---|---|---|---|---|
| Lauterbrunnen | 542 | $6,449 | $542.38 | 51% |
| Rothenburg | 10 | $5,701 | $296.11 | 62% |
| Habkern | 13 | $5,289 | $358.22 | 47% |
| Grindelwald | 502 | $5,008 | $365.18 | 56% |
| Zermatt | 798 | $4,969 | $491.58 | 46% |
| Matten bei Interlaken | 59 | $4,947 | $324.40 | 59% |
| Interlaken | 313 | $4,633 | $382.80 | 53% |
| Laglio | 63 | $4,391 | $512.43 | 43% |
| Sala Comacina | 68 | $4,345 | $441.29 | 47% |
| Iseltwald | 23 | $4,178 | $373.83 | 49% |