Santo Stefano Belbo Airbnb Market Analysis 2026: Short Term Rental Data & Vacation Rental Statistics in Piedmont, Italy
Is Airbnb profitable in Santo Stefano Belbo in 2026? Explore comprehensive Airbnb analytics for Santo Stefano Belbo, Piedmont, Italy to uncover income potential. This 2026 STR market report for Santo Stefano Belbo, based on AirROI data from February 2025 to January 2026, reveals key trends in the niche market of 22 active listings.
Whether you're considering an Airbnb investment in Santo Stefano Belbo, optimizing your existing vacation rental, or exploring rental arbitrage opportunities, understanding the Santo Stefano Belbo Airbnb data is crucial. Navigating the high regulation landscape is key to maximizing your short term rental income potential. Let's dive into the specifics.
Key Santo Stefano Belbo Airbnb Performance Metrics Overview
Monthly Airbnb Revenue Variations & Income Potential in Santo Stefano Belbo (2026)
Understanding the monthly revenue variations for Airbnb listings in Santo Stefano Belbo is key to maximizing your short term rental income potential. Seasonality significantly impacts earnings. Our analysis, based on data from the past 12 months, shows that the peak revenue month for STRs in Santo Stefano Belbo is typically August, while January often presents the lowest earnings, highlighting opportunities for strategic pricing adjustments during shoulder and low seasons. Explore the typical Airbnb income in Santo Stefano Belbo across different performance tiers:
- Best-in-class properties (Top 10%) achieve $13,725+ monthly, often utilizing dynamic pricing and superior guest experiences.
- Strong performing properties (Top 25%) earn $4,744 or more, indicating effective management and desirable locations/amenities.
- Typical properties (Median) generate around $1,283 per month, representing the average market performance.
- Entry-level properties (Bottom 25%) see earnings around $673, often with potential for optimization.
Average Monthly Airbnb Earnings Trend in Santo Stefano Belbo
Santo Stefano Belbo Airbnb Occupancy Rate Trends (2026)
Maximize your bookings by understanding the Santo Stefano Belbo STR occupancy trends. Seasonal demand shifts significantly influence how often properties are booked. Typically, Augustsees the highest demand (peak season occupancy), while January experiences the lowest (low season). Effective strategies, like adjusting minimum stays or offering promotions, can boost occupancy during slower periods. Here's how different property tiers perform in Santo Stefano Belbo:
- Best-in-class properties (Top 10%) achieve 66%+ occupancy, indicating high desirability and potentially optimized availability.
- Strong performing properties (Top 25%) maintain 42% or higher occupancy, suggesting good market fit and guest satisfaction.
- Typical properties (Median) have an occupancy rate around 24%.
- Entry-level properties (Bottom 25%) average 12% occupancy, potentially facing higher vacancy.
Average Monthly Occupancy Rate Trend in Santo Stefano Belbo
Average Daily Rate (ADR) Airbnb Trends in Santo Stefano Belbo (2026)
Effective short term rental pricing strategy in Santo Stefano Belbo involves understanding monthly ADR fluctuations. The Average Daily Rate (ADR) for Airbnb in Santo Stefano Belbo typically peaks in October and dips lowest during February. Leveraging Airbnb dynamic pricing tools or strategies based on this seasonality can significantly boost revenue. Here's a look at the typical nightly rates achieved:
- Best-in-class properties (Top 10%) command rates of $821+ per night, often due to premium features or locations.
- Strong performing properties (Top 25%) achieve nightly rates of $239 or more.
- Typical properties (Median) charge around $167 per night.
- Entry-level properties (Bottom 25%) earn around $124 per night.
Average Daily Rate (ADR) Trend by Month in Santo Stefano Belbo
Get Live Santo Stefano Belbo Market Intelligence 👇

Explore Real-time Analytics
Airbnb Seasonality Analysis & Trends in Santo Stefano Belbo (2026)
Peak Season (August, July, September)
- Revenue averages $5,986 per month
- Occupancy rates average 42.7%
- Daily rates average $307
Shoulder Season
- Revenue averages $3,824 per month
- Occupancy maintains around 27.4%
- Daily rates hold near $313
Low Season (January, February, March)
- Revenue drops to average $2,172 per month
- Occupancy decreases to average 20.3%
- Daily rates adjust to average $300
Seasonality Insights for Santo Stefano Belbo
- The Airbnb seasonality in Santo Stefano Belbo shows highly seasonal trends requiring careful strategy. While the sections above show seasonal averages, it's also insightful to look at the extremes:
- During the high season, the absolute peak month showcases Santo Stefano Belbo's highest earning potential, with monthly revenues capable of climbing to $6,443, occupancy reaching a high of 44.7%, and ADRs peaking at $328.
- Conversely, the slowest single month of the year, typically falling within the low season, marks the market's lowest point. In this month, revenue might dip to $1,573, occupancy could drop to 10.6%, and ADRs may adjust down to $288.
- Understanding both the seasonal averages and these monthly peaks and troughs in revenue, occupancy, and ADR is crucial for maximizing your Airbnb profit potential in Santo Stefano Belbo.
Seasonal Strategies for Maximizing Profit
- Peak Season: Maximize revenue through premium pricing and potentially longer minimum stays. Ensure high availability.
- Low Season: Offer competitive pricing, special promotions (e.g., extended stay discounts), and flexible cancellation policies. Target off-season travelers like remote workers or budget-conscious guests.
- Shoulder Seasons: Implement dynamic pricing that balances peak and low rates. Target weekend travelers or specific events. Offer slightly more flexible terms than peak season.
- Regularly analyze your own performance against these Santo Stefano Belbo seasonality benchmarks and adjust your pricing and availability strategy accordingly.
Best Areas for Airbnb Investment in Santo Stefano Belbo (2026)
Exploring the top neighborhoods for short-term rentals in Santo Stefano Belbo? This section highlights key areas, outlining why they are attractive for hosts and guests, along with notable local attractions. Consider these locations based on your target guest profile and investment strategy.
| Neighborhood / Area | Why Host Here? (Target Guests & Appeal) | Key Attractions & Landmarks |
|---|---|---|
| Centro Storico | The historic center of Santo Stefano Belbo attracts visitors looking for authentic Italian culture, charming architecture, and traditional local cuisine. | Church of Santo Stefano, Local wineries, Historical walking tours, La Rocca, Piazza Marconi, Local trattorias |
| Wine Country | Famous for its vineyards and wine production, this area appeals to wine lovers and tourists looking for vineyard tours and tastings. | Vineyard tours, Barolo wine tastings, Langhe area, Cascina Adelaide, Wine festivals, Alba truffle market |
| Rocchetta Tanaro | Nearby scenic village known for outdoor activities and beautiful landscapes, perfect for nature lovers and hiking enthusiasts. | Hiking trails, Scenic viewpoints, Natural parks, Local wildlife, Historical sites, Outdoor adventure tours |
| Local Gastronomy | Santo Stefano Belbo is part of Piedmont, known for its rich culinary heritage, making it attractive for foodies and culinary tourism. | Piedmontese cuisine, Trattoria and Osteria visits, Local cheese markets, Food festivals, Cooking classes, Street food tours |
| Cultural Festivals | Santo Stefano Belbo hosts various cultural and local festivals throughout the year, drawing visitors interested in local traditions and festivities. | Local festivals, Cultural events, Art exhibitions, Music concerts, Local artisan markets, Traditional food stalls |
| Outdoor Activities | With access to beautiful landscapes and outdoor activities, this area is ideal for tourists who enjoy hiking and nature excursions. | Biking paths, Nature parks, Scenic drives, Wine country views, Horseback riding, Fishing spots |
| Historic Vineyards | The region is renowned for historic vineyards that produce some of Italy's best wines. Visitors can explore these sites and enjoy panoramic views. | Historic vineyard tours, Wine tasting events, Cultural heritage sites, Breathtaking landscapes, Grape harvest festivals, Historical wine making techniques |
| Local Art and Crafts | The area is home to various artists and craftsmen, making it a unique destination for art lovers looking for local handmade products. | Art galleries, Craft shops, Local artisan workshops, Artisan fairs, Gallery events, Cultural art projects |
Understanding Airbnb License Requirements & STR Laws in Santo Stefano Belbo (2026)
Yes, Santo Stefano Belbo, Piedmont, Italy enforces high STR regulations. Obtaining a license and ensuring compliance is almost certainly required according to current 2026 STR laws. Always verify the latest short term rental regulations and Airbnb license requirements directly with local government authorities for Santo Stefano Belbo to ensure full compliance before hosting.
(Source: AirROI data, 2026, based on 91% licensed listings)
Top Performing Airbnb Properties in Santo Stefano Belbo (2026)
Benchmark your potential! Explore examples of top-performing Airbnb properties in Santo Stefano Belbobased on Trailing Twelve Month (TTM) revenue. Analyze their characteristics, revenue, occupancy rate, and ADR to understand what drives success in this market.
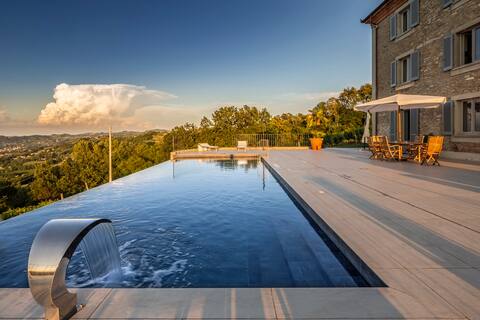
Luxury Villa Alba Asti & spectacular infinity pool
Entire Place • 7 bedrooms
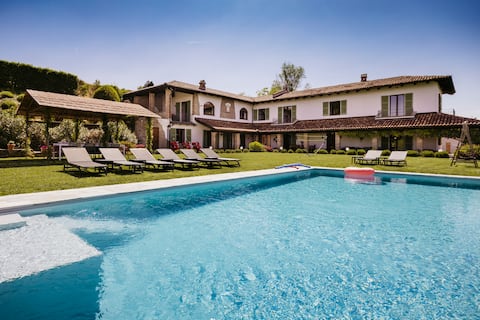
Exclusive villa 'Poggio sul Belbo'
Entire Place • 6 bedrooms
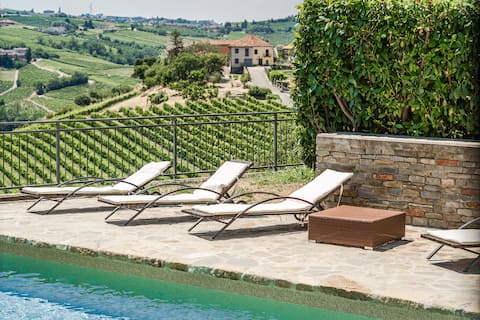
La Dimora delle Langhe – Pool and private vineyard
Entire Place • 7 bedrooms

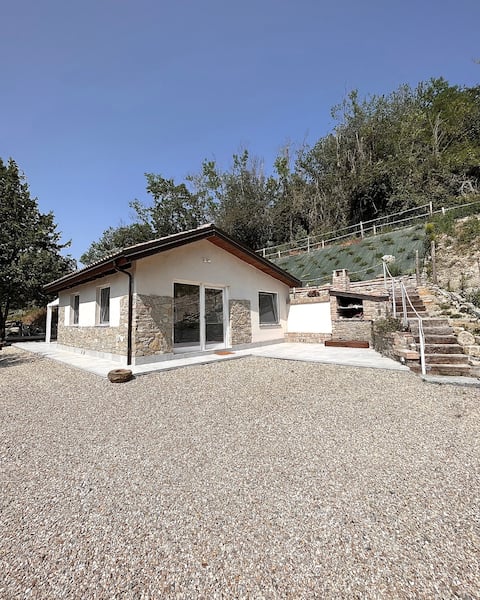
La Casa Vola - own pool, large terrace with a view!
Entire Place • 2 bedrooms
Ciabot Donna Rosa
Entire Place • 1 bedroom
Casa More' in Langa
Entire Place • 3 bedrooms
Note: Performance varies based on location, size, amenities, seasonality, and management quality. Data reflects the past 12 months.
Top Performing Airbnb Hosts in Santo Stefano Belbo (2026)
Learn from the best! This table showcases top-performing Airbnb hosts in Santo Stefano Belbo based on the number of properties managed and estimated total revenue over the past year. Analyze their scale and performance metrics.
| Host Name | Properties | Grossing Revenue | Stay Reviews | Avg Rating |
|---|---|---|---|---|
| Matteo Dante | 1 | $178,070 | 24 | 4.96/5.0 |
| Erik | 1 | $156,214 | 11 | 5.00/5.0 |
| Giuseppe | 1 | $154,668 | 26 | 4.85/5.0 |
| Claes | 1 | $66,927 | 33 | 5.00/5.0 |
| Vigna Dell'Acqua S.R.L. | 6 | $50,321 | 74 | 4.80/5.0 |
| Ivan | 1 | $30,563 | 4 | 5.00/5.0 |
| Carla | 1 | $23,548 | 19 | 4.95/5.0 |
| Monica | 1 | $19,801 | 33 | 4.91/5.0 |
| Piedmont Holiday | 1 | $17,390 | 1 | Not Rated |
| Cristian | 1 | $10,924 | 7 | 4.43/5.0 |
Analyzing the strategies of top hosts, such as their property selection, pricing, and guest communication, can offer valuable lessons for optimizing your own Airbnb operations in Santo Stefano Belbo.
Dive Deeper: Advanced Santo Stefano Belbo STR Market Data (2026)
Ready to unlock more insights? AirROI provides access to advanced metrics and comprehensive Airbnb data for Santo Stefano Belbo. Explore detailed analytics beyond this report to refine your investment strategy, optimize pricing, and maximize your vacation rental profits.
Explore Advanced MetricsSanto Stefano Belbo Short-Term Rental Market Composition (2026): Property & Room Types
Room Type Distribution
Property Type Distribution
Market Composition Insights for Santo Stefano Belbo
- The Santo Stefano Belbo Airbnb market composition is heavily skewed towards Entire Home/Apt listings, which make up 90.9% of the 22 active rentals. This indicates strong guest preference for privacy and space.
- Looking at the property type distribution in Santo Stefano Belbo, House properties are the most common (63.6%), reflecting the local real estate landscape.
- Houses represent a significant 63.6% portion, catering likely to families or larger groups.
Santo Stefano Belbo Airbnb Room Capacity Analysis (2026): Bedroom Distribution
Distribution of Listings by Number of Bedrooms
Room Capacity Insights for Santo Stefano Belbo
- The dominant room capacity in Santo Stefano Belbo is 1 bedroom listings, making up 40.9% of the market. This suggests a strong demand for properties suitable for couples or solo travelers.
- Together, 1 bedroom and 2 bedrooms properties represent 63.6% of the active Airbnb listings in Santo Stefano Belbo, indicating a high concentration in these sizes.
- A significant 27.3% of listings offer 3+ bedrooms, catering to larger groups and families seeking more space in Santo Stefano Belbo.
Santo Stefano Belbo Vacation Rental Guest Capacity Trends (2026)
Distribution of Listings by Guest Capacity
Guest Capacity Insights for Santo Stefano Belbo
- The most common guest capacity trend in Santo Stefano Belbo vacation rentals is listings accommodating 6 guests (27.3%). This suggests the primary traveler segment is likely larger groups.
- Properties designed for 6 guests and 4 guests dominate the Santo Stefano Belbo STR market, accounting for 50.0% of listings.
- 45.5% of properties accommodate 6+ guests, serving the market segment for larger families or group travel in Santo Stefano Belbo.
- On average, properties in Santo Stefano Belbo are equipped to host 4.9 guests.
Santo Stefano Belbo Airbnb Booking Patterns (2026): Available vs. Booked Days
Available Days Distribution
Booked Days Distribution
Booking Pattern Insights for Santo Stefano Belbo
- The most common availability pattern in Santo Stefano Belbo falls within the 271-366 days range, representing 68.2% of listings. This suggests many properties have significant open periods on their calendars.
- Approximately 90.9% of listings show high availability (181+ days open annually), indicating potential for increased bookings or specific owner usage patterns.
- For booked days, the 31-90 days range is most frequent in Santo Stefano Belbo (45.5%), reflecting common guest stay durations or potential owner blocking patterns.
- A notable 13.6% of properties secure long booking periods (181+ days booked per year), highlighting successful long-term rental strategies or significant owner usage.
Santo Stefano Belbo Airbnb Minimum Stay Requirements Analysis
Distribution of Listings by Minimum Night Requirement
1 Night
1 listings
4.5% of total
2 Nights
9 listings
40.9% of total
3 Nights
1 listings
4.5% of total
4-6 Nights
1 listings
4.5% of total
30+ Nights
10 listings
45.5% of total
Key Insights
- The most prevalent minimum stay requirement in Santo Stefano Belbo is 30+ Nights, adopted by 45.5% of listings. This highlights the market's preference for longer commitments.
- A significant segment (45.5%) caters to monthly stays (30+ nights) in Santo Stefano Belbo, pointing to opportunities in the extended-stay market.
Recommendations
- Align with the market by considering a 30+ Nights minimum stay, as 45.5% of Santo Stefano Belbo hosts use this setting.
- If feasible, allowing 1-night stays, especially midweek or during low season, could capture last-minute bookings, as only 4.5% currently do.
- A 2-night minimum appears standard (40.9%). Consider this for weekends or peak periods.
- Explore offering discounts for stays of 30+ nights to attract the 45.5% of the market seeking extended stays.
- Adjust minimum nights based on seasonality – potentially shorter during low season and longer during peak demand periods in Santo Stefano Belbo.
Santo Stefano Belbo Airbnb Cancellation Policy Trends Analysis (2026)
Super Strict 60 Days
1 listings
4.5% of total
Flexible
6 listings
27.3% of total
Moderate
6 listings
27.3% of total
Firm
9 listings
40.9% of total
Cancellation Policy Insights for Santo Stefano Belbo
- The prevailing Airbnb cancellation policy trend in Santo Stefano Belbo is Firm, used by 40.9% of listings.
- There's a relatively balanced mix between guest-friendly (54.6%) and stricter (40.9%) policies, offering choices for different guest needs.
Recommendations for Hosts
- Consider adopting a Firm policy to align with the 40.9% market standard in Santo Stefano Belbo.
- Regularly review your cancellation policy against competitors and market demand shifts in Santo Stefano Belbo.
Santo Stefano Belbo STR Booking Lead Time Analysis (2026)
Average Booking Lead Time by Month
Booking Lead Time Insights for Santo Stefano Belbo
- The overall average booking lead time for vacation rentals in Santo Stefano Belbo is 53 days.
- Guests book furthest in advance for stays during August (average 81 days), likely coinciding with peak travel demand or local events.
- The shortest booking windows occur for stays in January (average 3 days), indicating more last-minute travel plans during this time.
- Seasonally, Summer (70 days avg.) sees the longest lead times, while Winter (21 days avg.) has the shortest, reflecting typical travel planning cycles.
Recommendations for Hosts
- Use the overall average lead time (53 days) as a baseline for your pricing and availability strategy in Santo Stefano Belbo.
- For August stays, consider implementing length-of-stay discounts or slightly higher rates for bookings made less than 81 days out to capitalize on advance planning.
- During January, focus on last-minute booking availability and promotions, as guests book with very short notice (3 days avg.).
- Target marketing efforts for the Summer season well in advance (at least 70 days) to capture early planners.
- Monitor your own booking lead times against these Santo Stefano Belbo averages to identify opportunities for dynamic pricing adjustments.
Popular & Essential Airbnb Amenities in Santo Stefano Belbo (2026)
Amenity Prevalence
Amenity Insights for Santo Stefano Belbo
- Essential amenities in Santo Stefano Belbo that guests expect include: Wifi. Lacking these (this) could significantly impact bookings.
- Popular amenities like Heating, Refrigerator, Kitchen are common but not universal. Offering these can provide a competitive edge.
Recommendations for Hosts
- Ensure your listing includes all essential amenities for Santo Stefano Belbo: Wifi.
- Prioritize adding missing essentials: Wifi.
- Consider adding popular differentiators like Heating or Refrigerator to increase appeal.
- Highlight unique or less common amenities you offer (e.g., hot tub, dedicated workspace, EV charger) in your listing description and photos.
- Regularly check competitor amenities in Santo Stefano Belbo to stay competitive.
Santo Stefano Belbo Airbnb Guest Demographics & Profile Analysis (2026)
Guest Profile Summary for Santo Stefano Belbo
- The typical guest profile for Airbnb in Santo Stefano Belbo consists of predominantly international visitors (82%), with top international origins including Switzerland, typically belonging to the Post-2000s (Gen Z/Alpha) group (50%), primarily speaking English or German.
- Domestic travelers account for 18.2% of guests.
- Key international markets include Italy (18.2%) and Switzerland (14.5%).
- Top languages spoken are English (38.3%) followed by German (14.9%).
- A significant demographic segment is the Post-2000s (Gen Z/Alpha) group, representing 50% of guests.
Recommendations for Hosts
- Focus marketing internationally, particularly towards travelers from Switzerland.
- Tailor amenities and listing descriptions to appeal to the dominant Post-2000s (Gen Z/Alpha) demographic (e.g., highlight fast WiFi, smart home features, local guides).
- Highlight unique local experiences or amenities relevant to the primary guest profile.
- Consider seasonal promotions aligned with peak travel times for key origin markets.
Nearby Short-Term Rental Market Comparison
How does the Santo Stefano Belbo Airbnb market stack up against its neighbors? Compare key performance metrics like average monthly revenue, ADR, and occupancy rates in surrounding areas to understand the broader regional STR landscape.
| Market | Active Properties | Monthly Revenue | Daily Rate | Avg. Occupancy |
|---|---|---|---|---|
| Ranco | 12 | $5,691 | $536.46 | 42% |
| Monteu Roero | 12 | $5,184 | $403.07 | 41% |
| Laglio | 64 | $4,334 | $518.58 | 43% |
| Saint-Jean-Cap-Ferrat | 114 | $3,894 | $465.00 | 44% |
| Cassinasco | 19 | $3,887 | $718.39 | 40% |
| Cossano Belbo | 15 | $3,763 | $326.53 | 36% |
| Portofino | 77 | $3,585 | $509.42 | 38% |
| Bellagio | 461 | $3,466 | $325.87 | 49% |
| Vico Morcote | 12 | $3,347 | $317.07 | 46% |
| Sala Comacina | 73 | $3,332 | $451.20 | 46% |