Tortona Airbnb Market Analysis 2026: Short Term Rental Data & Vacation Rental Statistics in Piedmont, Italy
Is Airbnb profitable in Tortona in 2026? Explore comprehensive Airbnb analytics for Tortona, Piedmont, Italy to uncover income potential. This 2026 STR market report for Tortona, based on AirROI data from February 2025 to January 2026, reveals key trends in the niche market of 19 active listings.
Whether you're considering an Airbnb investment in Tortona, optimizing your existing vacation rental, or exploring rental arbitrage opportunities, understanding the Tortona Airbnb data is crucial. Navigating the high regulation landscape is key to maximizing your short term rental income potential. Let's dive into the specifics.
Key Tortona Airbnb Performance Metrics Overview
Monthly Airbnb Revenue Variations & Income Potential in Tortona (2026)
Understanding the monthly revenue variations for Airbnb listings in Tortona is key to maximizing your short term rental income potential. Seasonality significantly impacts earnings. Our analysis, based on data from the past 12 months, shows that the peak revenue month for STRs in Tortona is typically June, while January often presents the lowest earnings, highlighting opportunities for strategic pricing adjustments during shoulder and low seasons. Explore the typical Airbnb income in Tortona across different performance tiers:
- Best-in-class properties (Top 10%) achieve $2,080+ monthly, often utilizing dynamic pricing and superior guest experiences.
- Strong performing properties (Top 25%) earn $1,504 or more, indicating effective management and desirable locations/amenities.
- Typical properties (Median) generate around $870 per month, representing the average market performance.
- Entry-level properties (Bottom 25%) see earnings around $447, often with potential for optimization.
Average Monthly Airbnb Earnings Trend in Tortona
Tortona Airbnb Occupancy Rate Trends (2026)
Maximize your bookings by understanding the Tortona STR occupancy trends. Seasonal demand shifts significantly influence how often properties are booked. Typically, Septembersees the highest demand (peak season occupancy), while January experiences the lowest (low season). Effective strategies, like adjusting minimum stays or offering promotions, can boost occupancy during slower periods. Here's how different property tiers perform in Tortona:
- Best-in-class properties (Top 10%) achieve 76%+ occupancy, indicating high desirability and potentially optimized availability.
- Strong performing properties (Top 25%) maintain 59% or higher occupancy, suggesting good market fit and guest satisfaction.
- Typical properties (Median) have an occupancy rate around 33%.
- Entry-level properties (Bottom 25%) average 15% occupancy, potentially facing higher vacancy.
Average Monthly Occupancy Rate Trend in Tortona
Average Daily Rate (ADR) Airbnb Trends in Tortona (2026)
Effective short term rental pricing strategy in Tortona involves understanding monthly ADR fluctuations. The Average Daily Rate (ADR) for Airbnb in Tortona typically peaks in September and dips lowest during February. Leveraging Airbnb dynamic pricing tools or strategies based on this seasonality can significantly boost revenue. Here's a look at the typical nightly rates achieved:
- Best-in-class properties (Top 10%) command rates of $218+ per night, often due to premium features or locations.
- Strong performing properties (Top 25%) achieve nightly rates of $102 or more.
- Typical properties (Median) charge around $82 per night.
- Entry-level properties (Bottom 25%) earn around $71 per night.
Average Daily Rate (ADR) Trend by Month in Tortona
Get Live Tortona Market Intelligence 👇
Explore Real-time Analytics
Airbnb Seasonality Analysis & Trends in Tortona (2026)
Peak Season (June, August, July)
- Revenue averages $1,406 per month
- Occupancy rates average 44.2%
- Daily rates average $102
Shoulder Season
- Revenue averages $1,075 per month
- Occupancy maintains around 40.1%
- Daily rates hold near $105
Low Season (January, April, December)
- Revenue drops to average $767 per month
- Occupancy decreases to average 33.7%
- Daily rates adjust to average $102
Seasonality Insights for Tortona
- The Airbnb seasonality in Tortona shows highly seasonal trends requiring careful strategy. While the sections above show seasonal averages, it's also insightful to look at the extremes:
- During the high season, the absolute peak month showcases Tortona's highest earning potential, with monthly revenues capable of climbing to $1,450, occupancy reaching a high of 47.1%, and ADRs peaking at $127.
- Conversely, the slowest single month of the year, typically falling within the low season, marks the market's lowest point. In this month, revenue might dip to $586, occupancy could drop to 25.8%, and ADRs may adjust down to $92.
- Understanding both the seasonal averages and these monthly peaks and troughs in revenue, occupancy, and ADR is crucial for maximizing your Airbnb profit potential in Tortona.
Seasonal Strategies for Maximizing Profit
- Peak Season: Maximize revenue through premium pricing and potentially longer minimum stays. Ensure high availability.
- Low Season: Offer competitive pricing, special promotions (e.g., extended stay discounts), and flexible cancellation policies. Target off-season travelers like remote workers or budget-conscious guests.
- Shoulder Seasons: Implement dynamic pricing that balances peak and low rates. Target weekend travelers or specific events. Offer slightly more flexible terms than peak season.
- Regularly analyze your own performance against these Tortona seasonality benchmarks and adjust your pricing and availability strategy accordingly.
Best Areas for Airbnb Investment in Tortona (2026)
Exploring the top neighborhoods for short-term rentals in Tortona? This section highlights key areas, outlining why they are attractive for hosts and guests, along with notable local attractions. Consider these locations based on your target guest profile and investment strategy.
| Neighborhood / Area | Why Host Here? (Target Guests & Appeal) | Key Attractions & Landmarks |
|---|---|---|
| Centro Storico | The historical center of Tortona, featuring beautiful architecture and local markets. Ideal for tourists seeking culture and history, with easy access to shops and restaurants. | Tortona Cathedral, Piazza Duomo, Museo delle Arti, Chiesa di San Matteo, Tortona's local markets |
| Tortona Railway Station Area | A key transportation hub, convenient for travelers accessing nearby cities. This area attracts business visitors and those needing quick transit options. | Tortona Railway Station, Piazza Malaspina, Nearby dining options, Convenient transport links |
| Parco Casale | A green park area that offers relaxation and outdoor activities. Perfect for families and anyone looking to enjoy nature within the city. | Parco Casale, Playgrounds, Picnic areas, Walking trails |
| Via Emilia | A bustling street with shops, restaurants, and local life. It attracts visitors who want to experience the local culture and cuisine. | Restaurants and cafes, Local boutiques, Historical buildings, Cultural events |
| Stadio Comunale | The sports area home to local football games. Great for sports fans and families attending events and games. | Stadio Comunale, Local sports events, Nearby restaurants |
| Colline Tortonesi | The surrounding hills of Tortona, known for their wineries and stunning views. This area is perfect for wine lovers and those looking for tranquility. | Local wineries, Hiking trails, Scenic viewpoints |
| Local Vineyards | A great area to experience the wine culture of Piedmont, attracting wine enthusiasts and tourists interested in enogastronomy. | Vineyard tours, Wine tasting, Culinary experiences |
| Shopping District | The primary area for retail shopping in Tortona, appealing to those who love to shop and explore local Italian brands. | Shops and boutiques, Local crafts, Cafes and eateries |
Understanding Airbnb License Requirements & STR Laws in Tortona (2026)
Yes, Tortona, Piedmont, Italy enforces high STR regulations. Obtaining a license and ensuring compliance is almost certainly required according to current 2026 STR laws. Always verify the latest short term rental regulations and Airbnb license requirements directly with local government authorities for Tortona to ensure full compliance before hosting.
(Source: AirROI data, 2026, based on 100% licensed listings)
Top Performing Airbnb Properties in Tortona (2026)
Benchmark your potential! Explore examples of top-performing Airbnb properties in Tortonabased on Trailing Twelve Month (TTM) revenue. Analyze their characteristics, revenue, occupancy rate, and ADR to understand what drives success in this market.
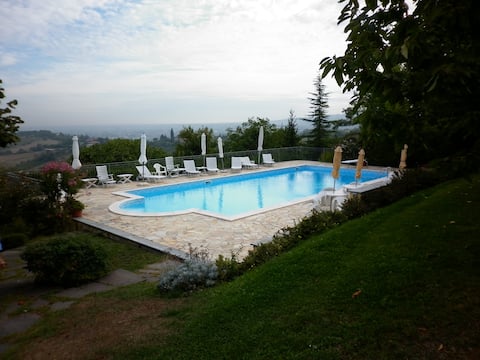
Country villa with pool and incredible view
Entire Place • 3 bedrooms
Spacious apartment
Entire Place • 1 bedroom
Henson apartment
Entire Place • 1 bedroom
Old House Apartment
Entire Place • 1 bedroom

The Truffle House - Colli Tortonesi Timorasso Area
Entire Place • 1 bedroom
Vittoria and Bernard's Maison
Entire Place • 1 bedroom
Note: Performance varies based on location, size, amenities, seasonality, and management quality. Data reflects the past 12 months.
Top Performing Airbnb Hosts in Tortona (2026)
Learn from the best! This table showcases top-performing Airbnb hosts in Tortona based on the number of properties managed and estimated total revenue over the past year. Analyze their scale and performance metrics.
| Host Name | Properties | Grossing Revenue | Stay Reviews | Avg Rating |
|---|---|---|---|---|
| Mateo | 3 | $40,560 | 85 | 4.88/5.0 |
| Antonella | 1 | $19,240 | 22 | 4.91/5.0 |
| Marco | 1 | $15,363 | 50 | 4.76/5.0 |
| Alice | 1 | $14,472 | 180 | 4.83/5.0 |
| Camilla | 1 | $14,298 | 73 | 4.90/5.0 |
| Vittoria | 1 | $14,296 | 111 | 4.95/5.0 |
| Barbara | 1 | $13,145 | 39 | 4.85/5.0 |
| Ivan | 1 | $9,188 | 3 | 5.00/5.0 |
| Cristina | 1 | $7,721 | 47 | 4.77/5.0 |
| Marco | 2 | $7,622 | 62 | 4.50/5.0 |
Analyzing the strategies of top hosts, such as their property selection, pricing, and guest communication, can offer valuable lessons for optimizing your own Airbnb operations in Tortona.
Dive Deeper: Advanced Tortona STR Market Data (2026)
Ready to unlock more insights? AirROI provides access to advanced metrics and comprehensive Airbnb data for Tortona. Explore detailed analytics beyond this report to refine your investment strategy, optimize pricing, and maximize your vacation rental profits.
Explore Advanced MetricsTortona Short-Term Rental Market Composition (2026): Property & Room Types
Room Type Distribution
Property Type Distribution
Market Composition Insights for Tortona
- The Tortona Airbnb market composition is heavily skewed towards Entire Home/Apt listings, which make up 100% of the 19 active rentals. This indicates strong guest preference for privacy and space.
- Looking at the property type distribution in Tortona, Apartment/Condo properties are the most common (78.9%), reflecting the local real estate landscape.
- Houses represent a significant 21.1% portion, catering likely to families or larger groups.
Tortona Airbnb Room Capacity Analysis (2026): Bedroom Distribution
Distribution of Listings by Number of Bedrooms
Room Capacity Insights for Tortona
- The dominant room capacity in Tortona is 1 bedroom listings, making up 68.4% of the market. This suggests a strong demand for properties suitable for couples or solo travelers.
- Together, 1 bedroom and 2 bedrooms properties represent 84.2% of the active Airbnb listings in Tortona, indicating a high concentration in these sizes.
- With over half the market (68.4%) consisting of studios or 1-bedroom units, Tortona is particularly well-suited for individuals or couples.
Tortona Vacation Rental Guest Capacity Trends (2026)
Distribution of Listings by Guest Capacity
Guest Capacity Insights for Tortona
- The most common guest capacity trend in Tortona vacation rentals is listings accommodating 2 guests (31.6%). This suggests the primary traveler segment is likely couples or solo travelers.
- Properties designed for 2 guests and 3 guests dominate the Tortona STR market, accounting for 57.9% of listings.
- 10.6% of properties accommodate 6+ guests, serving the market segment for larger families or group travel in Tortona.
- On average, properties in Tortona are equipped to host 3.6 guests.
Tortona Airbnb Booking Patterns (2026): Available vs. Booked Days
Available Days Distribution
Booked Days Distribution
Booking Pattern Insights for Tortona
- The most common availability pattern in Tortona falls within the 271-366 days range, representing 52.6% of listings. This suggests many properties have significant open periods on their calendars.
- Approximately 84.2% of listings show high availability (181+ days open annually), indicating potential for increased bookings or specific owner usage patterns.
- For booked days, the 91-180 days range is most frequent in Tortona (42.1%), reflecting common guest stay durations or potential owner blocking patterns.
- A notable 15.8% of properties secure long booking periods (181+ days booked per year), highlighting successful long-term rental strategies or significant owner usage.
Tortona Airbnb Minimum Stay Requirements Analysis
Distribution of Listings by Minimum Night Requirement
1 Night
11 listings
57.9% of total
2 Nights
2 listings
10.5% of total
4-6 Nights
1 listings
5.3% of total
7-29 Nights
2 listings
10.5% of total
30+ Nights
3 listings
15.8% of total
Key Insights
- The most prevalent minimum stay requirement in Tortona is 1 Night, adopted by 57.9% of listings. This highlights the market's preference for shorter, flexible bookings.
- A strong majority (68.4%) of the Tortona Airbnb data shows acceptance of very short stays (1-2 nights), indicating a dynamic, high-turnover market.
- A significant segment (15.8%) caters to monthly stays (30+ nights) in Tortona, pointing to opportunities in the extended-stay market.
Recommendations
- Align with the market by considering a 1 Night minimum stay, as 57.9% of Tortona hosts use this setting.
- Explore offering discounts for stays of 30+ nights to attract the 15.8% of the market seeking extended stays.
- Adjust minimum nights based on seasonality – potentially shorter during low season and longer during peak demand periods in Tortona.
Tortona Airbnb Cancellation Policy Trends Analysis (2026)
Flexible
10 listings
52.6% of total
Moderate
7 listings
36.8% of total
Firm
2 listings
10.5% of total
Cancellation Policy Insights for Tortona
- The prevailing Airbnb cancellation policy trend in Tortona is Flexible, used by 52.6% of listings.
- The market strongly favors guest-friendly terms, with 89.4% of listings offering Flexible or Moderate policies. This suggests guests in Tortona may expect booking flexibility.
Recommendations for Hosts
- Consider adopting a Flexible policy to align with the 52.6% market standard in Tortona.
- Given the high prevalence of Flexible policies (52.6%), offering this can enhance booking appeal, especially during shoulder seasons.
- Regularly review your cancellation policy against competitors and market demand shifts in Tortona.
Tortona STR Booking Lead Time Analysis (2026)
Average Booking Lead Time by Month
Booking Lead Time Insights for Tortona
- The overall average booking lead time for vacation rentals in Tortona is 44 days.
- Guests book furthest in advance for stays during August (average 62 days), likely coinciding with peak travel demand or local events.
- The shortest booking windows occur for stays in March (average 21 days), indicating more last-minute travel plans during this time.
- Seasonally, Summer (54 days avg.) sees the longest lead times, while Winter (27 days avg.) has the shortest, reflecting typical travel planning cycles.
Recommendations for Hosts
- Use the overall average lead time (44 days) as a baseline for your pricing and availability strategy in Tortona.
- For August stays, consider implementing length-of-stay discounts or slightly higher rates for bookings made less than 62 days out to capitalize on advance planning.
- Target marketing efforts for the Summer season well in advance (at least 54 days) to capture early planners.
- Monitor your own booking lead times against these Tortona averages to identify opportunities for dynamic pricing adjustments.
Popular & Essential Airbnb Amenities in Tortona (2026)
Amenity Prevalence
Amenity Insights for Tortona
- Essential amenities in Tortona that guests expect include: Dishes and silverware, Heating, Kitchen. Lacking these (any) could significantly impact bookings.
- Popular amenities like Cooking basics, Hair dryer, Hot water are common but not universal. Offering these can provide a competitive edge.
Recommendations for Hosts
- Ensure your listing includes all essential amenities for Tortona: Dishes and silverware, Heating, Kitchen.
- Consider adding popular differentiators like Cooking basics or Hair dryer to increase appeal.
- Highlight unique or less common amenities you offer (e.g., hot tub, dedicated workspace, EV charger) in your listing description and photos.
- Regularly check competitor amenities in Tortona to stay competitive.
Tortona Airbnb Guest Demographics & Profile Analysis (2026)
Guest Profile Summary for Tortona
- The typical guest profile for Airbnb in Tortona consists of predominantly international visitors (71%), with top international origins including France, typically belonging to the Post-2000s (Gen Z/Alpha) group (50%), primarily speaking English or Italian.
- Domestic travelers account for 29.2% of guests.
- Key international markets include Italy (29.2%) and France (19.2%).
- Top languages spoken are English (34.4%) followed by Italian (18.4%).
- A significant demographic segment is the Post-2000s (Gen Z/Alpha) group, representing 50% of guests.
Recommendations for Hosts
- Focus marketing internationally, particularly towards travelers from France.
- Tailor amenities and listing descriptions to appeal to the dominant Post-2000s (Gen Z/Alpha) demographic (e.g., highlight fast WiFi, smart home features, local guides).
- Highlight unique local experiences or amenities relevant to the primary guest profile.
- Consider seasonal promotions aligned with peak travel times for key origin markets.
Nearby Short-Term Rental Market Comparison
How does the Tortona Airbnb market stack up against its neighbors? Compare key performance metrics like average monthly revenue, ADR, and occupancy rates in surrounding areas to understand the broader regional STR landscape.
| Market | Active Properties | Monthly Revenue | Daily Rate | Avg. Occupancy |
|---|---|---|---|---|
| Ranco | 12 | $5,691 | $536.46 | 42% |
| Monteu Roero | 12 | $5,184 | $403.07 | 41% |
| Laglio | 64 | $4,334 | $518.58 | 43% |
| Saint-Jean-Cap-Ferrat | 114 | $3,894 | $465.00 | 44% |
| Cassinasco | 19 | $3,887 | $718.39 | 40% |
| Cossano Belbo | 15 | $3,763 | $326.53 | 36% |
| Portofino | 77 | $3,585 | $509.42 | 38% |
| Bellagio | 461 | $3,466 | $325.87 | 49% |
| Vico Morcote | 12 | $3,347 | $317.07 | 46% |
| Sala Comacina | 73 | $3,332 | $451.20 | 46% |