Arbatax Airbnb Market Analysis 2026: Short Term Rental Data & Vacation Rental Statistics in Sardegna, Italy
Is Airbnb profitable in Arbatax in 2026? Explore comprehensive Airbnb analytics for Arbatax, Sardegna, Italy to uncover income potential. This 2026 STR market report for Arbatax, based on AirROI data from February 2025 to January 2026, reveals key trends in the niche market of 24 active listings.
Whether you're considering an Airbnb investment in Arbatax, optimizing your existing vacation rental, or exploring rental arbitrage opportunities, understanding the Arbatax Airbnb data is crucial. Navigating the high regulation landscape is key to maximizing your short term rental income potential. Let's dive into the specifics.
Key Arbatax Airbnb Performance Metrics Overview
Monthly Airbnb Revenue Variations & Income Potential in Arbatax (2026)
Understanding the monthly revenue variations for Airbnb listings in Arbatax is key to maximizing your short term rental income potential. Seasonality significantly impacts earnings. Our analysis, based on data from the past 12 months, shows that the peak revenue month for STRs in Arbatax is typically August, while May often presents the lowest earnings, highlighting opportunities for strategic pricing adjustments during shoulder and low seasons. Explore the typical Airbnb income in Arbatax across different performance tiers:
- Best-in-class properties (Top 10%) achieve $4,250+ monthly, often utilizing dynamic pricing and superior guest experiences.
- Strong performing properties (Top 25%) earn $2,894 or more, indicating effective management and desirable locations/amenities.
- Typical properties (Median) generate around $1,989 per month, representing the average market performance.
- Entry-level properties (Bottom 25%) see earnings around $1,213, often with potential for optimization.
Average Monthly Airbnb Earnings Trend in Arbatax
Arbatax Airbnb Occupancy Rate Trends (2026)
Maximize your bookings by understanding the Arbatax STR occupancy trends. Seasonal demand shifts significantly influence how often properties are booked. Typically, Augustsees the highest demand (peak season occupancy), while May experiences the lowest (low season). Effective strategies, like adjusting minimum stays or offering promotions, can boost occupancy during slower periods. Here's how different property tiers perform in Arbatax:
- Best-in-class properties (Top 10%) achieve 56%+ occupancy, indicating high desirability and potentially optimized availability.
- Strong performing properties (Top 25%) maintain 50% or higher occupancy, suggesting good market fit and guest satisfaction.
- Typical properties (Median) have an occupancy rate around 40%.
- Entry-level properties (Bottom 25%) average 26% occupancy, potentially facing higher vacancy.
Average Monthly Occupancy Rate Trend in Arbatax
Average Daily Rate (ADR) Airbnb Trends in Arbatax (2026)
Effective short term rental pricing strategy in Arbatax involves understanding monthly ADR fluctuations. The Average Daily Rate (ADR) for Airbnb in Arbatax typically peaks in August and dips lowest during November. Leveraging Airbnb dynamic pricing tools or strategies based on this seasonality can significantly boost revenue. Here's a look at the typical nightly rates achieved:
- Best-in-class properties (Top 10%) command rates of $324+ per night, often due to premium features or locations.
- Strong performing properties (Top 25%) achieve nightly rates of $200 or more.
- Typical properties (Median) charge around $156 per night.
- Entry-level properties (Bottom 25%) earn around $124 per night.
Average Daily Rate (ADR) Trend by Month in Arbatax
Get Live Arbatax Market Intelligence 👇
Explore Real-time Analytics
Airbnb Seasonality Analysis & Trends in Arbatax (2026)
Peak Season (August, July, September)
- Revenue averages $4,058 per month
- Occupancy rates average 64.0%
- Daily rates average $200
Shoulder Season
- Revenue averages $1,440 per month
- Occupancy maintains around 25.2%
- Daily rates hold near $182
Low Season (February, March, April)
- Revenue drops to average $0 per month
- Occupancy decreases to average 0.0%
- Daily rates adjust to average $203
Seasonality Insights for Arbatax
- The Airbnb seasonality in Arbatax shows highly seasonal trends requiring careful strategy. While the sections above show seasonal averages, it's also insightful to look at the extremes:
- During the high season, the absolute peak month showcases Arbatax's highest earning potential, with monthly revenues capable of climbing to $4,834, occupancy reaching a high of 69.4%, and ADRs peaking at $215.
- Conversely, the slowest single month of the year, typically falling within the low season, marks the market's lowest point. In this month, revenue might dip to $0, occupancy could drop to 0.0%, and ADRs may adjust down to $147.
- Understanding both the seasonal averages and these monthly peaks and troughs in revenue, occupancy, and ADR is crucial for maximizing your Airbnb profit potential in Arbatax.
Seasonal Strategies for Maximizing Profit
- Peak Season: Maximize revenue through premium pricing and potentially longer minimum stays. Ensure high availability.
- Low Season: Offer competitive pricing, special promotions (e.g., extended stay discounts), and flexible cancellation policies. Target off-season travelers like remote workers or budget-conscious guests.
- Shoulder Seasons: Implement dynamic pricing that balances peak and low rates. Target weekend travelers or specific events. Offer slightly more flexible terms than peak season.
- Regularly analyze your own performance against these Arbatax seasonality benchmarks and adjust your pricing and availability strategy accordingly.
Best Areas for Airbnb Investment in Arbatax (2026)
Exploring the top neighborhoods for short-term rentals in Arbatax? This section highlights key areas, outlining why they are attractive for hosts and guests, along with notable local attractions. Consider these locations based on your target guest profile and investment strategy.
| Neighborhood / Area | Why Host Here? (Target Guests & Appeal) | Key Attractions & Landmarks |
|---|---|---|
| Porto Frailis | Beautiful beach area known for its clear waters and stunning coastline. Popular with tourists for beach activities, making it ideal for vacation rentals. | Porto Frailis Beach, Torre di San Gemiliano, Scivu Beach, Oasis of Bidderosa, Capo di Monte, Lido di Orri |
| Lido di Orrì | Famous for its long sandy beaches and summer vibe. Attracts families and beach lovers looking for a relaxing getaway. | Lido di Orrì Beach, La Torre di Barì, Cala dei Gabbiani, Chiesetta di Santa Barbara, Cala Liberotto, Oasi di Bidderosa |
| Arbatax Harbour | The gateway to the Golfo di Orosei, it's a hub for boat excursions and offers a unique maritime experience for tourists. | Arbatax Harbour, Trekking in the Gennargentu National Park, Snorkeling in the Marine Park, Red Rocks of Arbatax, Visiting the Island of Ogliastra, Boat excursions |
| Capo Bellavista | Known for its breathtaking views and hiking trails, attracting nature enthusiasts and adventure seekers. | Capo Bellavista, Hiking Trails, Watchtower of Bellavista, Stargazing, Nature Photography, Canoeing |
| San Gemiliano | A quiet residential area close to the beaches, ideal for those looking for a peaceful vacation experience away from the crowds. | San Gemiliano Beach, Barì Sardinia, Water Sports Activities, Local Restaurants, Nature Walks, Relaxation Spots |
| Santa Maria Navarrese | Another coastal gem, famous for its picturesque beaches and charming village atmosphere, offering relaxed seaside living. | Santa Maria Navarrese Beach, Marina di Santa Maria, The Ancient Church of Santa Maria, Paddleboarding, Snorkeling, Coastal Walks |
| Cala Moresca | Known for its pristine, secluded beaches and clear seas, it appeals to those wanting a tranquil getaway. | Cala Moresca Beach, Nature Trails, Beautiful Sunsets, Coves Exploration, Fishing, Kayaking |
| Torre di Bari | Historic area with ancient ruins and stunning coastal views, appealing to history buffs and beachgoers alike. | Torre di Bari, Archaeological Site, Scenic Viewpoints, Hiking Trails, Cultural Tours, Snorkeling |
Understanding Airbnb License Requirements & STR Laws in Arbatax (2026)
Yes, Arbatax, Sardegna, Italy enforces high STR regulations. Obtaining a license and ensuring compliance is almost certainly required according to current 2026 STR laws. Always verify the latest short term rental regulations and Airbnb license requirements directly with local government authorities for Arbatax to ensure full compliance before hosting.
(Source: AirROI data, 2026, based on 100% licensed listings)
Top Performing Airbnb Properties in Arbatax (2026)
Benchmark your potential! Explore examples of top-performing Airbnb properties in Arbataxbased on Trailing Twelve Month (TTM) revenue. Analyze their characteristics, revenue, occupancy rate, and ADR to understand what drives success in this market.
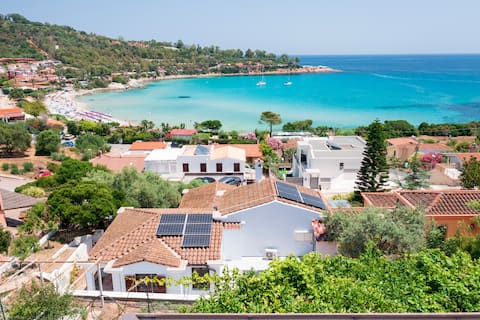
Alisei Villa with sea view
Entire Place • 4 bedrooms
Villa-Private Bathroom
Entire Place • 3 bedrooms
Villa Manzoni
Entire Place • 2 bedrooms
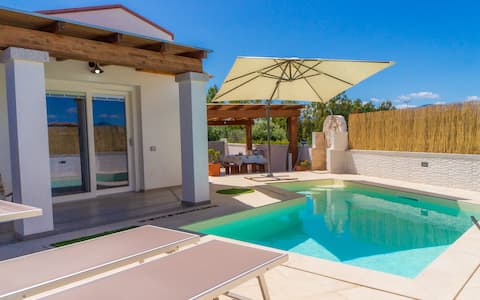
Deluxe Suite w/ Hot Tub, 200 m from Sea
Entire Place • 1 bedroom
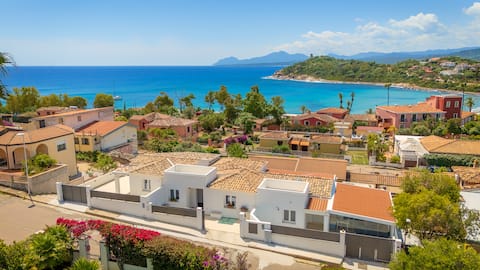
*Villa with Jacuzzi Joy Collection*
Entire Place • 3 bedrooms

(2) One-bedroom 200m from sea WiFi parking
Entire Place • 1 bedroom
Note: Performance varies based on location, size, amenities, seasonality, and management quality. Data reflects the past 12 months.
Top Performing Airbnb Hosts in Arbatax (2026)
Learn from the best! This table showcases top-performing Airbnb hosts in Arbatax based on the number of properties managed and estimated total revenue over the past year. Analyze their scale and performance metrics.
| Host Name | Properties | Grossing Revenue | Stay Reviews | Avg Rating |
|---|---|---|---|---|
| Enrico | 8 | $131,359 | 33 | 4.98/5.0 |
| Marco | 5 | $106,942 | 7 | 4.67/5.0 |
| Barbara | 2 | $53,325 | 4 | 5.00/5.0 |
| Maria Consolata | 1 | $19,020 | 8 | 5.00/5.0 |
| Anna Claudia | 1 | $14,589 | 2 | Not Rated |
| Federica | 1 | $11,133 | 2 | Not Rated |
| Mirko | 1 | $10,858 | 1 | Not Rated |
| Margherita | 1 | $8,038 | 1 | Not Rated |
| Vittoria | 1 | $4,909 | 1 | Not Rated |
| Rita | 1 | $4,456 | 3 | 5.00/5.0 |
Analyzing the strategies of top hosts, such as their property selection, pricing, and guest communication, can offer valuable lessons for optimizing your own Airbnb operations in Arbatax.
Dive Deeper: Advanced Arbatax STR Market Data (2026)
Ready to unlock more insights? AirROI provides access to advanced metrics and comprehensive Airbnb data for Arbatax. Explore detailed analytics beyond this report to refine your investment strategy, optimize pricing, and maximize your vacation rental profits.
Explore Advanced MetricsArbatax Short-Term Rental Market Composition (2026): Property & Room Types
Room Type Distribution
Property Type Distribution
Market Composition Insights for Arbatax
- The Arbatax Airbnb market composition is heavily skewed towards Entire Home/Apt listings, which make up 66.7% of the 24 active rentals. This indicates strong guest preference for privacy and space.
- However, a notable 33.3% share for Private Rooms suggests opportunities for budget-conscious travelers or hosts renting out spare rooms.
- Looking at the property type distribution in Arbatax, Apartment/Condo properties are the most common (66.7%), reflecting the local real estate landscape.
- Houses represent a significant 20.8% portion, catering likely to families or larger groups.
- The presence of 12.5% Hotel/Boutique listings indicates integration with traditional hospitality.
Arbatax Airbnb Room Capacity Analysis (2026): Bedroom Distribution
Distribution of Listings by Number of Bedrooms
Room Capacity Insights for Arbatax
- The dominant room capacity in Arbatax is 2 bedrooms listings, making up 37.5% of the market. This suggests a strong demand for properties suitable for couples or solo travelers.
- Together, 2 bedrooms and 1 bedroom properties represent 66.7% of the active Airbnb listings in Arbatax, indicating a high concentration in these sizes.
Arbatax Vacation Rental Guest Capacity Trends (2026)
Distribution of Listings by Guest Capacity
Guest Capacity Insights for Arbatax
- The most common guest capacity trend in Arbatax vacation rentals is listings accommodating 4 guests (33.3%). This suggests the primary traveler segment is likely small families or groups.
- Properties designed for 4 guests and 2 guests dominate the Arbatax STR market, accounting for 45.8% of listings.
- 20.8% of properties accommodate 6+ guests, serving the market segment for larger families or group travel in Arbatax.
- On average, properties in Arbatax are equipped to host 3.5 guests.
Arbatax Airbnb Booking Patterns (2026): Available vs. Booked Days
Available Days Distribution
Booked Days Distribution
Booking Pattern Insights for Arbatax
- The most common availability pattern in Arbatax falls within the 271-366 days range, representing 66.7% of listings. This suggests many properties have significant open periods on their calendars.
- Approximately 100.0% of listings show high availability (181+ days open annually), indicating potential for increased bookings or specific owner usage patterns.
- For booked days, the 31-90 days range is most frequent in Arbatax (54.2%), reflecting common guest stay durations or potential owner blocking patterns.
Arbatax Airbnb Minimum Stay Requirements Analysis
Distribution of Listings by Minimum Night Requirement
1 Night
5 listings
20.8% of total
2 Nights
2 listings
8.3% of total
3 Nights
3 listings
12.5% of total
4-6 Nights
3 listings
12.5% of total
30+ Nights
11 listings
45.8% of total
Key Insights
- The most prevalent minimum stay requirement in Arbatax is 30+ Nights, adopted by 45.8% of listings. This highlights the market's preference for longer commitments.
- A significant segment (45.8%) caters to monthly stays (30+ nights) in Arbatax, pointing to opportunities in the extended-stay market.
Recommendations
- Align with the market by considering a 30+ Nights minimum stay, as 45.8% of Arbatax hosts use this setting.
- If feasible, allowing 1-night stays, especially midweek or during low season, could capture last-minute bookings, as only 20.8% currently do.
- Explore offering discounts for stays of 30+ nights to attract the 45.8% of the market seeking extended stays.
- Adjust minimum nights based on seasonality – potentially shorter during low season and longer during peak demand periods in Arbatax.
Arbatax Airbnb Cancellation Policy Trends Analysis (2026)
Super Strict 60 Days
7 listings
29.2% of total
Super Strict 30 Days
1 listings
4.2% of total
Flexible
1 listings
4.2% of total
Moderate
8 listings
33.3% of total
Firm
7 listings
29.2% of total
Cancellation Policy Insights for Arbatax
- The prevailing Airbnb cancellation policy trend in Arbatax is Moderate, used by 33.3% of listings.
- There's a relatively balanced mix between guest-friendly (37.5%) and stricter (29.2%) policies, offering choices for different guest needs.
Recommendations for Hosts
- Consider adopting a Moderate policy to align with the 33.3% market standard in Arbatax.
- Regularly review your cancellation policy against competitors and market demand shifts in Arbatax.
Arbatax STR Booking Lead Time Analysis (2026)
Average Booking Lead Time by Month
Booking Lead Time Insights for Arbatax
- The overall average booking lead time for vacation rentals in Arbatax is 35 days.
- Guests book furthest in advance for stays during December (average 56 days), likely coinciding with peak travel demand or local events.
- The shortest booking windows occur for stays in April (average 0 days), indicating more last-minute travel plans during this time.
- Seasonally, Fall (40 days avg.) sees the longest lead times, while Spring (1 days avg.) has the shortest, reflecting typical travel planning cycles.
Recommendations for Hosts
- Use the overall average lead time (35 days) as a baseline for your pricing and availability strategy in Arbatax.
- For December stays, consider implementing length-of-stay discounts or slightly higher rates for bookings made less than 56 days out to capitalize on advance planning.
- During April, focus on last-minute booking availability and promotions, as guests book with very short notice (0 days avg.).
- Target marketing efforts for the Fall season well in advance (at least 40 days) to capture early planners.
- Monitor your own booking lead times against these Arbatax averages to identify opportunities for dynamic pricing adjustments.
Popular & Essential Airbnb Amenities in Arbatax (2026)
Amenity Prevalence
Amenity Insights for Arbatax
- Essential amenities in Arbatax that guests expect include: Air conditioning, TV. Lacking these (any) could significantly impact bookings.
- Popular amenities like Wifi, BBQ grill, Free parking on premises are common but not universal. Offering these can provide a competitive edge.
- Warning: Wifi is not universally provided but is considered essential globally. Ensure reliable Wifi is offered.
Recommendations for Hosts
- Ensure your listing includes all essential amenities for Arbatax: Air conditioning, TV.
- Prioritize adding missing essentials: Air conditioning, TV.
- Consider adding popular differentiators like Wifi or BBQ grill to increase appeal.
- Highlight unique or less common amenities you offer (e.g., hot tub, dedicated workspace, EV charger) in your listing description and photos.
- Regularly check competitor amenities in Arbatax to stay competitive.
Arbatax Airbnb Guest Demographics & Profile Analysis (2026)
Guest Profile Summary for Arbatax
- The typical guest profile for Airbnb in Arbatax consists of predominantly international visitors (84%), with top international origins including Italy, typically belonging to the Post-2000s (Gen Z/Alpha) group (50%), primarily speaking English or French.
- Domestic travelers account for 16.1% of guests.
- Key international markets include Switzerland (16.1%) and Italy (16.1%).
- Top languages spoken are English (34.3%) followed by French (14.3%).
- A significant demographic segment is the Post-2000s (Gen Z/Alpha) group, representing 50% of guests.
Recommendations for Hosts
- Focus marketing internationally, particularly towards travelers from Italy.
- Tailor amenities and listing descriptions to appeal to the dominant Post-2000s (Gen Z/Alpha) demographic (e.g., highlight fast WiFi, smart home features, local guides).
- Highlight unique local experiences or amenities relevant to the primary guest profile.
- Consider seasonal promotions aligned with peak travel times for key origin markets.
Nearby Short-Term Rental Market Comparison
How does the Arbatax Airbnb market stack up against its neighbors? Compare key performance metrics like average monthly revenue, ADR, and occupancy rates in surrounding areas to understand the broader regional STR landscape.
| Market | Active Properties | Monthly Revenue | Daily Rate | Avg. Occupancy |
|---|---|---|---|---|
| Maracalagonis | 268 | $2,396 | $338.45 | 43% |
| Torre Delle Stelle (Maracalagonis) | 18 | $2,082 | $416.40 | 42% |
| Pittulongu | 22 | $2,036 | $399.40 | 45% |
| Sarrocu/Sarroch | 89 | $1,968 | $239.26 | 43% |
| Golfo Aranci | 36 | $1,963 | $362.29 | 46% |
| Castiadas | 188 | $1,953 | $263.12 | 42% |
| Santa Margherita di Pula | 28 | $1,860 | $393.54 | 46% |
| Santu Diadòru/San Teodoro | 880 | $1,815 | $286.96 | 43% |
| La Caletta | 13 | $1,801 | $176.59 | 50% |
| Figari/Golfo Aranci | 383 | $1,651 | $286.39 | 39% |