Cabuderra/Capoterra Airbnb Market Analysis 2026: Short Term Rental Data & Vacation Rental Statistics in Sardinia, Italy
Is Airbnb profitable in Cabuderra/Capoterra in 2026? Explore comprehensive Airbnb analytics for Cabuderra/Capoterra, Sardinia, Italy to uncover income potential. This 2026 STR market report for Cabuderra/Capoterra, based on AirROI data from February 2025 to January 2026, reveals key trends in the niche market of 136 active listings.
Whether you're considering an Airbnb investment in Cabuderra/Capoterra, optimizing your existing vacation rental, or exploring rental arbitrage opportunities, understanding the Cabuderra/Capoterra Airbnb data is crucial. Navigating the high regulation landscape is key to maximizing your short term rental income potential. Let's dive into the specifics.
Key Cabuderra/Capoterra Airbnb Performance Metrics Overview
Monthly Airbnb Revenue Variations & Income Potential in Cabuderra/Capoterra (2026)
Understanding the monthly revenue variations for Airbnb listings in Cabuderra/Capoterra is key to maximizing your short term rental income potential. Seasonality significantly impacts earnings. Our analysis, based on data from the past 12 months, shows that the peak revenue month for STRs in Cabuderra/Capoterra is typically August, while January often presents the lowest earnings, highlighting opportunities for strategic pricing adjustments during shoulder and low seasons. Explore the typical Airbnb income in Cabuderra/Capoterra across different performance tiers:
- Best-in-class properties (Top 10%) achieve $2,930+ monthly, often utilizing dynamic pricing and superior guest experiences.
- Strong performing properties (Top 25%) earn $2,053 or more, indicating effective management and desirable locations/amenities.
- Typical properties (Median) generate around $1,233 per month, representing the average market performance.
- Entry-level properties (Bottom 25%) see earnings around $568, often with potential for optimization.
Average Monthly Airbnb Earnings Trend in Cabuderra/Capoterra
Cabuderra/Capoterra Airbnb Occupancy Rate Trends (2026)
Maximize your bookings by understanding the Cabuderra/Capoterra STR occupancy trends. Seasonal demand shifts significantly influence how often properties are booked. Typically, Augustsees the highest demand (peak season occupancy), while January experiences the lowest (low season). Effective strategies, like adjusting minimum stays or offering promotions, can boost occupancy during slower periods. Here's how different property tiers perform in Cabuderra/Capoterra:
- Best-in-class properties (Top 10%) achieve 72%+ occupancy, indicating high desirability and potentially optimized availability.
- Strong performing properties (Top 25%) maintain 56% or higher occupancy, suggesting good market fit and guest satisfaction.
- Typical properties (Median) have an occupancy rate around 32%.
- Entry-level properties (Bottom 25%) average 15% occupancy, potentially facing higher vacancy.
Average Monthly Occupancy Rate Trend in Cabuderra/Capoterra
Average Daily Rate (ADR) Airbnb Trends in Cabuderra/Capoterra (2026)
Effective short term rental pricing strategy in Cabuderra/Capoterra involves understanding monthly ADR fluctuations. The Average Daily Rate (ADR) for Airbnb in Cabuderra/Capoterra typically peaks in August and dips lowest during March. Leveraging Airbnb dynamic pricing tools or strategies based on this seasonality can significantly boost revenue. Here's a look at the typical nightly rates achieved:
- Best-in-class properties (Top 10%) command rates of $213+ per night, often due to premium features or locations.
- Strong performing properties (Top 25%) achieve nightly rates of $150 or more.
- Typical properties (Median) charge around $111 per night.
- Entry-level properties (Bottom 25%) earn around $86 per night.
Average Daily Rate (ADR) Trend by Month in Cabuderra/Capoterra
Get Live Cabuderra/Capoterra Market Intelligence 👇

Explore Real-time Analytics
Airbnb Seasonality Analysis & Trends in Cabuderra/Capoterra (2026)
Peak Season (August, July, September)
- Revenue averages $2,776 per month
- Occupancy rates average 55.9%
- Daily rates average $153
Shoulder Season
- Revenue averages $1,519 per month
- Occupancy maintains around 36.1%
- Daily rates hold near $134
Low Season (January, February, December)
- Revenue drops to average $600 per month
- Occupancy decreases to average 19.0%
- Daily rates adjust to average $146
Seasonality Insights for Cabuderra/Capoterra
- The Airbnb seasonality in Cabuderra/Capoterra shows highly seasonal trends requiring careful strategy. While the sections above show seasonal averages, it's also insightful to look at the extremes:
- During the high season, the absolute peak month showcases Cabuderra/Capoterra's highest earning potential, with monthly revenues capable of climbing to $3,516, occupancy reaching a high of 64.5%, and ADRs peaking at $161.
- Conversely, the slowest single month of the year, typically falling within the low season, marks the market's lowest point. In this month, revenue might dip to $596, occupancy could drop to 18.2%, and ADRs may adjust down to $125.
- Understanding both the seasonal averages and these monthly peaks and troughs in revenue, occupancy, and ADR is crucial for maximizing your Airbnb profit potential in Cabuderra/Capoterra.
Seasonal Strategies for Maximizing Profit
- Peak Season: Maximize revenue through premium pricing and potentially longer minimum stays. Ensure high availability.
- Low Season: Offer competitive pricing, special promotions (e.g., extended stay discounts), and flexible cancellation policies. Target off-season travelers like remote workers or budget-conscious guests.
- Shoulder Seasons: Implement dynamic pricing that balances peak and low rates. Target weekend travelers or specific events. Offer slightly more flexible terms than peak season.
- Regularly analyze your own performance against these Cabuderra/Capoterra seasonality benchmarks and adjust your pricing and availability strategy accordingly.
Best Areas for Airbnb Investment in Cabuderra/Capoterra (2026)
Exploring the top neighborhoods for short-term rentals in Cabuderra/Capoterra? This section highlights key areas, outlining why they are attractive for hosts and guests, along with notable local attractions. Consider these locations based on your target guest profile and investment strategy.
| Neighborhood / Area | Why Host Here? (Target Guests & Appeal) | Key Attractions & Landmarks |
|---|---|---|
| Capoterra Beach | Beautiful beach area known for its clear waters and scenic views, popular among families and tourists looking for relaxation and sun. | Capoterra Beach, Sardinian coastline, Local seafood restaurants, Water sports activities, Scenic walking trails |
| Cagliari City Center | The vibrant capital of Sardinia offers rich history, cultural landmarks, and bustling markets, ideal for guests interested in urban exploration. | Bastione di Saint Remy, Poetto Beach, Cagliari Cathedral, Mercato di San Benedetto, Roman Amphitheatre |
| Costa degli Angeli | A picturesque coastal area known for its beautiful landscapes and serene beaches, perfect for travelers seeking tranquility and nature. | Spiaggia di Costa degli Angeli, Local hiking trails, Scenic viewpoints, Natural parks, Gastronomic tours |
| Pula | A charming town famous for its archaeological sites and beautiful beaches, drawing in history enthusiasts and summer vacationers alike. | Nora archaeological site, Tuerredda Beach, Pula town square, Local festivals, Restaurants with traditional cuisine |
| Nora | Ancient ruins combined with stunning beaches; an ideal setting for history lovers and beachgoers looking for a unique experience. | Ancient city of Nora, Crystal-clear waters, Archaeological museum of Cagliari, La Maddalena beach, Cultural exhibitions |
| Is Molas | An upscale resort area with golf courses and luxury accommodations, attracting tourists interested in leisure and relaxation. | Is Molas Golf Club, Nearby beaches, High-end resorts, Spa services, Adventure sports |
| Solanas | Known for its breathtaking beaches and crystal-clear waters. Ideal for families and those looking to escape the crowds. | Solanas Beach, Water sports facilities, Natural beauty spots, Local artisan shops, Family-friendly activities |
| Santa Margherita di Pula | Offers stunning sandy beaches and a laid-back atmosphere, making it popular for both relaxation and family vacations. | Santa Margherita Beach, Outdoor dining options, Family activities, Water sports, Close to nature reserves |
Understanding Airbnb License Requirements & STR Laws in Cabuderra/Capoterra (2026)
Yes, Cabuderra/Capoterra, Sardinia, Italy enforces high STR regulations. Obtaining a license and ensuring compliance is almost certainly required according to current 2026 STR laws. Always verify the latest short term rental regulations and Airbnb license requirements directly with local government authorities for Cabuderra/Capoterra to ensure full compliance before hosting.
(Source: AirROI data, 2026, based on 88% licensed listings)
Top Performing Airbnb Properties in Cabuderra/Capoterra (2026)
Benchmark your potential! Explore examples of top-performing Airbnb properties in Cabuderra/Capoterrabased on Trailing Twelve Month (TTM) revenue. Analyze their characteristics, revenue, occupancy rate, and ADR to understand what drives success in this market.
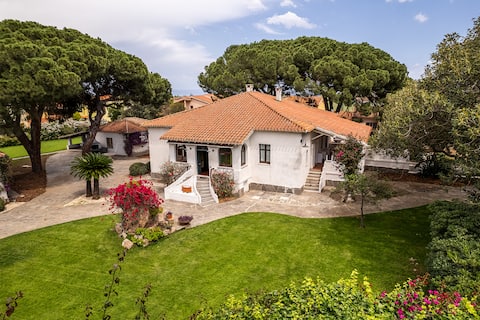
Historic Villa Giardini, Pool and Private Park
Entire Place • 4 bedrooms
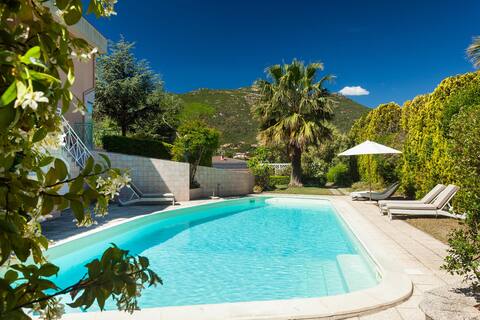
Villa Ferrara with pool Sardinia
Entire Place • 4 bedrooms

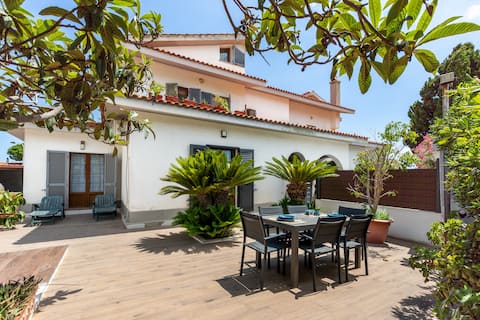
Rodani Villa - Unforgettable Sunrise
Entire Place • 3 bedrooms
Zen Relax Guest House - near the beach
Entire Place • 2 bedrooms
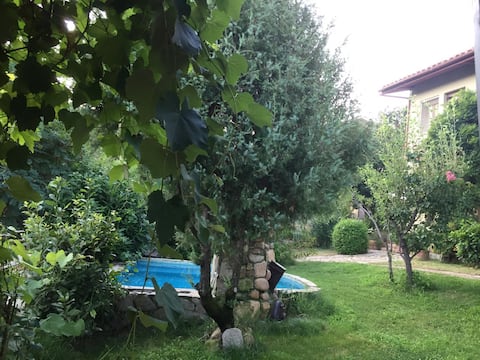
Villa in the countryside 4 kilometers from the sea
Entire Place • 3 bedrooms
Zen Luxury Guest House - near the beach
Entire Place • 2 bedrooms
Note: Performance varies based on location, size, amenities, seasonality, and management quality. Data reflects the past 12 months.
Top Performing Airbnb Hosts in Cabuderra/Capoterra (2026)
Learn from the best! This table showcases top-performing Airbnb hosts in Cabuderra/Capoterra based on the number of properties managed and estimated total revenue over the past year. Analyze their scale and performance metrics.
| Host Name | Properties | Grossing Revenue | Stay Reviews | Avg Rating |
|---|---|---|---|---|
| Aldo | 1 | $104,494 | 6 | 5.00/5.0 |
| Riccardo | 4 | $84,724 | 339 | 4.88/5.0 |
| Stefano | 2 | $59,584 | 261 | 4.83/5.0 |
| Simone | 3 | $58,353 | 183 | 4.90/5.0 |
| Claudia | 1 | $49,394 | 21 | 4.67/5.0 |
| Andrea | 3 | $47,100 | 109 | 4.82/5.0 |
| Elisabetta | 4 | $41,754 | 38 | 4.78/5.0 |
| Cristina | 2 | $34,712 | 135 | 4.88/5.0 |
| Roberta | 1 | $34,213 | 70 | 4.86/5.0 |
| Rosina | 2 | $28,914 | 99 | 4.42/5.0 |
Analyzing the strategies of top hosts, such as their property selection, pricing, and guest communication, can offer valuable lessons for optimizing your own Airbnb operations in Cabuderra/Capoterra.
Dive Deeper: Advanced Cabuderra/Capoterra STR Market Data (2026)
Ready to unlock more insights? AirROI provides access to advanced metrics and comprehensive Airbnb data for Cabuderra/Capoterra. Explore detailed analytics beyond this report to refine your investment strategy, optimize pricing, and maximize your vacation rental profits.
Explore Advanced MetricsCabuderra/Capoterra Short-Term Rental Market Composition (2026): Property & Room Types
Room Type Distribution
Property Type Distribution
Market Composition Insights for Cabuderra/Capoterra
- The Cabuderra/Capoterra Airbnb market composition is heavily skewed towards Entire Home/Apt listings, which make up 77.2% of the 136 active rentals. This indicates strong guest preference for privacy and space.
- Looking at the property type distribution in Cabuderra/Capoterra, House properties are the most common (56.6%), reflecting the local real estate landscape.
- Houses represent a significant 56.6% portion, catering likely to families or larger groups.
- The presence of 6.6% Hotel/Boutique listings indicates integration with traditional hospitality.
- Smaller segments like others (combined 0.7%) offer potential for unique stay experiences.
Cabuderra/Capoterra Airbnb Room Capacity Analysis (2026): Bedroom Distribution
Distribution of Listings by Number of Bedrooms
Room Capacity Insights for Cabuderra/Capoterra
- The dominant room capacity in Cabuderra/Capoterra is 2 bedrooms listings, making up 34.6% of the market. This suggests a strong demand for properties suitable for couples or solo travelers.
- Together, 2 bedrooms and 1 bedroom properties represent 67.7% of the active Airbnb listings in Cabuderra/Capoterra, indicating a high concentration in these sizes.
Cabuderra/Capoterra Vacation Rental Guest Capacity Trends (2026)
Distribution of Listings by Guest Capacity
Guest Capacity Insights for Cabuderra/Capoterra
- The most common guest capacity trend in Cabuderra/Capoterra vacation rentals is listings accommodating 4 guests (24.3%). This suggests the primary traveler segment is likely small families or groups.
- Properties designed for 4 guests and 2 guests dominate the Cabuderra/Capoterra STR market, accounting for 42.7% of listings.
- 16.2% of properties accommodate 6+ guests, serving the market segment for larger families or group travel in Cabuderra/Capoterra.
- On average, properties in Cabuderra/Capoterra are equipped to host 3.3 guests.
Cabuderra/Capoterra Airbnb Booking Patterns (2026): Available vs. Booked Days
Available Days Distribution
Booked Days Distribution
Booking Pattern Insights for Cabuderra/Capoterra
- The most common availability pattern in Cabuderra/Capoterra falls within the 271-366 days range, representing 64.7% of listings. This suggests many properties have significant open periods on their calendars.
- Approximately 91.9% of listings show high availability (181+ days open annually), indicating potential for increased bookings or specific owner usage patterns.
- For booked days, the 1-30 days range is most frequent in Cabuderra/Capoterra (33.1%), reflecting common guest stay durations or potential owner blocking patterns.
- A notable 9.6% of properties secure long booking periods (181+ days booked per year), highlighting successful long-term rental strategies or significant owner usage.
Cabuderra/Capoterra Airbnb Minimum Stay Requirements Analysis
Distribution of Listings by Minimum Night Requirement
1 Night
19 listings
14% of total
2 Nights
26 listings
19.1% of total
3 Nights
28 listings
20.6% of total
4-6 Nights
24 listings
17.6% of total
7-29 Nights
10 listings
7.4% of total
30+ Nights
29 listings
21.3% of total
Key Insights
- The most prevalent minimum stay requirement in Cabuderra/Capoterra is 30+ Nights, adopted by 21.3% of listings. This highlights the market's preference for longer commitments.
- A significant segment (21.3%) caters to monthly stays (30+ nights) in Cabuderra/Capoterra, pointing to opportunities in the extended-stay market.
Recommendations
- Align with the market by considering a 30+ Nights minimum stay, as 21.3% of Cabuderra/Capoterra hosts use this setting.
- If feasible, allowing 1-night stays, especially midweek or during low season, could capture last-minute bookings, as only 14% currently do.
- Explore offering discounts for stays of 30+ nights to attract the 21.3% of the market seeking extended stays.
- Adjust minimum nights based on seasonality – potentially shorter during low season and longer during peak demand periods in Cabuderra/Capoterra.
Cabuderra/Capoterra Airbnb Cancellation Policy Trends Analysis (2026)
Super Strict 30 Days
4 listings
2.9% of total
Flexible
39 listings
28.7% of total
Moderate
53 listings
39% of total
Firm
27 listings
19.9% of total
Strict
13 listings
9.6% of total
Cancellation Policy Insights for Cabuderra/Capoterra
- The prevailing Airbnb cancellation policy trend in Cabuderra/Capoterra is Moderate, used by 39% of listings.
- There's a relatively balanced mix between guest-friendly (67.7%) and stricter (29.5%) policies, offering choices for different guest needs.
- Strict cancellation policies are quite rare (9.6%), potentially making listings with this policy less competitive unless justified by high demand or property type.
Recommendations for Hosts
- Consider adopting a Moderate policy to align with the 39% market standard in Cabuderra/Capoterra.
- Using a Strict policy might deter some guests, as only 9.6% of listings use it. Evaluate if potential revenue protection outweighs possible lower booking rates.
- Regularly review your cancellation policy against competitors and market demand shifts in Cabuderra/Capoterra.
Cabuderra/Capoterra STR Booking Lead Time Analysis (2026)
Average Booking Lead Time by Month
Booking Lead Time Insights for Cabuderra/Capoterra
- The overall average booking lead time for vacation rentals in Cabuderra/Capoterra is 63 days.
- Guests book furthest in advance for stays during August (average 102 days), likely coinciding with peak travel demand or local events.
- The shortest booking windows occur for stays in January (average 15 days), indicating more last-minute travel plans during this time.
- Seasonally, Summer (82 days avg.) sees the longest lead times, while Winter (32 days avg.) has the shortest, reflecting typical travel planning cycles.
Recommendations for Hosts
- Use the overall average lead time (63 days) as a baseline for your pricing and availability strategy in Cabuderra/Capoterra.
- For August stays, consider implementing length-of-stay discounts or slightly higher rates for bookings made less than 102 days out to capitalize on advance planning.
- Target marketing efforts for the Summer season well in advance (at least 82 days) to capture early planners.
- Monitor your own booking lead times against these Cabuderra/Capoterra averages to identify opportunities for dynamic pricing adjustments.
Popular & Essential Airbnb Amenities in Cabuderra/Capoterra (2026)
Amenity Prevalence
Amenity Insights for Cabuderra/Capoterra
- Popular amenities like Air conditioning, Hair dryer, TV are common but not universal. Offering these can provide a competitive edge.
- Warning: Wifi is not universally provided but is considered essential globally. Ensure reliable Wifi is offered.
Recommendations for Hosts
- Consider adding popular differentiators like Air conditioning or Hair dryer to increase appeal.
- Highlight unique or less common amenities you offer (e.g., hot tub, dedicated workspace, EV charger) in your listing description and photos.
- Regularly check competitor amenities in Cabuderra/Capoterra to stay competitive.
Cabuderra/Capoterra Airbnb Guest Demographics & Profile Analysis (2026)
Guest Profile Summary for Cabuderra/Capoterra
- The typical guest profile for Airbnb in Cabuderra/Capoterra consists of predominantly international visitors (87%), with top international origins including Germany, typically belonging to the Post-2000s (Gen Z/Alpha) group (50%), primarily speaking English or German.
- Domestic travelers account for 12.8% of guests.
- Key international markets include France (25.6%) and Germany (22.8%).
- Top languages spoken are English (38.3%) followed by German (16.4%).
- A significant demographic segment is the Post-2000s (Gen Z/Alpha) group, representing 50% of guests.
Recommendations for Hosts
- Focus marketing internationally, particularly towards travelers from Germany.
- Tailor amenities and listing descriptions to appeal to the dominant Post-2000s (Gen Z/Alpha) demographic (e.g., highlight fast WiFi, smart home features, local guides).
- Highlight unique local experiences or amenities relevant to the primary guest profile.
- Consider seasonal promotions aligned with peak travel times for key origin markets.
Nearby Short-Term Rental Market Comparison
How does the Cabuderra/Capoterra Airbnb market stack up against its neighbors? Compare key performance metrics like average monthly revenue, ADR, and occupancy rates in surrounding areas to understand the broader regional STR landscape.
| Market | Active Properties | Monthly Revenue | Daily Rate | Avg. Occupancy |
|---|---|---|---|---|
| Maracalagonis | 268 | $2,396 | $338.45 | 43% |
| Torre Delle Stelle (Maracalagonis) | 18 | $2,082 | $416.40 | 42% |
| Pittulongu | 22 | $2,036 | $399.40 | 45% |
| Sarrocu/Sarroch | 89 | $1,968 | $239.26 | 43% |
| Golfo Aranci | 36 | $1,963 | $362.29 | 46% |
| Castiadas | 188 | $1,953 | $263.12 | 42% |
| Santa Margherita di Pula | 28 | $1,860 | $393.54 | 46% |
| Santu Diadòru/San Teodoro | 880 | $1,815 | $286.96 | 43% |
| La Caletta | 13 | $1,801 | $176.59 | 50% |
| Figari/Golfo Aranci | 383 | $1,651 | $286.39 | 39% |