Caragnani/Calangianus Airbnb Market Analysis 2025: Short Term Rental Data & Vacation Rental Statistics in Sardinia, Italy
Is Airbnb profitable in Caragnani/Calangianus in 2025? Explore comprehensive Airbnb analytics for Caragnani/Calangianus, Sardinia, Italy to uncover income potential. This 2025 STR market report for Caragnani/Calangianus, based on AirROI data from December 2024 to November 2025, reveals key trends in the niche market of 19 active listings.
Whether you're considering an Airbnb investment in Caragnani/Calangianus, optimizing your existing vacation rental, or exploring rental arbitrage opportunities, understanding the Caragnani/Calangianus Airbnb data is crucial. Navigating the high regulation landscape is key to maximizing your short term rental income potential. Let's dive into the specifics.
Key Caragnani/Calangianus Airbnb Performance Metrics Overview
Monthly Airbnb Revenue Variations & Income Potential in Caragnani/Calangianus (2025)
Understanding the monthly revenue variations for Airbnb listings in Caragnani/Calangianus is key to maximizing your short term rental income potential. Seasonality significantly impacts earnings. Our analysis, based on data from the past 12 months, shows that the peak revenue month for STRs in Caragnani/Calangianus is typically July, while February often presents the lowest earnings, highlighting opportunities for strategic pricing adjustments during shoulder and low seasons. Explore the typical Airbnb income in Caragnani/Calangianus across different performance tiers:
- Best-in-class properties (Top 10%) achieve $2,438+ monthly, often utilizing dynamic pricing and superior guest experiences.
- Strong performing properties (Top 25%) earn $1,831 or more, indicating effective management and desirable locations/amenities.
- Typical properties (Median) generate around $970 per month, representing the average market performance.
- Entry-level properties (Bottom 25%) see earnings around $551, often with potential for optimization.
Average Monthly Airbnb Earnings Trend in Caragnani/Calangianus
Caragnani/Calangianus Airbnb Occupancy Rate Trends (2025)
Maximize your bookings by understanding the Caragnani/Calangianus STR occupancy trends. Seasonal demand shifts significantly influence how often properties are booked. Typically, Julysees the highest demand (peak season occupancy), while February experiences the lowest (low season). Effective strategies, like adjusting minimum stays or offering promotions, can boost occupancy during slower periods. Here's how different property tiers perform in Caragnani/Calangianus:
- Best-in-class properties (Top 10%) achieve 53%+ occupancy, indicating high desirability and potentially optimized availability.
- Strong performing properties (Top 25%) maintain 43% or higher occupancy, suggesting good market fit and guest satisfaction.
- Typical properties (Median) have an occupancy rate around 27%.
- Entry-level properties (Bottom 25%) average 11% occupancy, potentially facing higher vacancy.
Average Monthly Occupancy Rate Trend in Caragnani/Calangianus
Average Daily Rate (ADR) Airbnb Trends in Caragnani/Calangianus (2025)
Effective short term rental pricing strategy in Caragnani/Calangianus involves understanding monthly ADR fluctuations. The Average Daily Rate (ADR) for Airbnb in Caragnani/Calangianus typically peaks in July and dips lowest during November. Leveraging Airbnb dynamic pricing tools or strategies based on this seasonality can significantly boost revenue. Here's a look at the typical nightly rates achieved:
- Best-in-class properties (Top 10%) command rates of $331+ per night, often due to premium features or locations.
- Strong performing properties (Top 25%) achieve nightly rates of $169 or more.
- Typical properties (Median) charge around $121 per night.
- Entry-level properties (Bottom 25%) earn around $84 per night.
Average Daily Rate (ADR) Trend by Month in Caragnani/Calangianus
Get Live Caragnani/Calangianus Market Intelligence 👇

Explore Real-time Analytics
Airbnb Seasonality Analysis & Trends in Caragnani/Calangianus (2025)
Peak Season (July, August, June)
- Revenue averages $2,813 per month
- Occupancy rates average 48.3%
- Daily rates average $210
Shoulder Season
- Revenue averages $923 per month
- Occupancy maintains around 27.8%
- Daily rates hold near $169
Low Season (January, February, December)
- Revenue drops to average $508 per month
- Occupancy decreases to average 14.1%
- Daily rates adjust to average $166
Seasonality Insights for Caragnani/Calangianus
- The Airbnb seasonality in Caragnani/Calangianus shows highly seasonal trends requiring careful strategy. While the sections above show seasonal averages, it's also insightful to look at the extremes:
- During the high season, the absolute peak month showcases Caragnani/Calangianus's highest earning potential, with monthly revenues capable of climbing to $3,526, occupancy reaching a high of 59.4%, and ADRs peaking at $227.
- Conversely, the slowest single month of the year, typically falling within the low season, marks the market's lowest point. In this month, revenue might dip to $319, occupancy could drop to 9.7%, and ADRs may adjust down to $152.
- Understanding both the seasonal averages and these monthly peaks and troughs in revenue, occupancy, and ADR is crucial for maximizing your Airbnb profit potential in Caragnani/Calangianus.
Seasonal Strategies for Maximizing Profit
- Peak Season: Maximize revenue through premium pricing and potentially longer minimum stays. Ensure high availability.
- Low Season: Offer competitive pricing, special promotions (e.g., extended stay discounts), and flexible cancellation policies. Target off-season travelers like remote workers or budget-conscious guests.
- Shoulder Seasons: Implement dynamic pricing that balances peak and low rates. Target weekend travelers or specific events. Offer slightly more flexible terms than peak season.
- Regularly analyze your own performance against these Caragnani/Calangianus seasonality benchmarks and adjust your pricing and availability strategy accordingly.
Best Areas for Airbnb Investment in Caragnani/Calangianus (2025)
Exploring the top neighborhoods for short-term rentals in Caragnani/Calangianus? This section highlights key areas, outlining why they are attractive for hosts and guests, along with notable local attractions. Consider these locations based on your target guest profile and investment strategy.
| Neighborhood / Area | Why Host Here? (Target Guests & Appeal) | Key Attractions & Landmarks |
|---|---|---|
| Calangianus Historic Center | Charming old town with traditional Sardinian architecture and a rich cultural heritage. Attracts tourists looking for authentic Italian experiences, local cuisine, and historic sites. | San Giovanni Battista Church, Museo del Sughero, Old Town Streets, Castello di Calangianus, Local Markets |
| Sant'Antonio di Gallura | Quaint village known for its peaceful surroundings and proximity to beautiful nature. Perfect for tourists seeking a tranquil getaway and outdoor activities. | Monti di Mola Nature Reserve, Local Vineyards, Traditional Sardinian Cuisine, Hiking Trails |
| Aggius | Known for its beautiful landscapes and traditional crafts. Attracts visitors interested in Sardinian traditions, artisanal products, and stunning mountain views. | Museum of Aggius, Local Craft Shops, Nature Walks, Traditional Festivals |
| Luogosanto | A scenic village in Gallura, noted for its natural beauty, rich history, and proximity to the Costa Smeralda. Great for nature lovers and those exploring Sardinia's coastal beauty. | San Trano Church, Tomba dei Giganti, Natural Parks, Scenic Views |
| Tempio Pausania | A historical town with a vibrant culture and stunning granite landscapes. Attracts tourists interested in history, architecture, and outdoor activities. | Cattedrale di San Pietro, Historic Center, Pulsano Abbey, Hiking in Monti di Gallura |
| Paduleddu | An idyllic area surrounded by nature, ideal for eco-tourism. Attracts travelers looking for outdoor adventures combined with relaxation. | Hiking Pathways, Nature Reserves, Local Wildlife, Scenic Picnics |
| Palau | A lively coastal town known for its beaches and access to La Maddalena Archipelago. Ideal for beach lovers and those looking for water sports activities. | Spalmatore Beach, Porto Faro, La Maddalena Archipelago, Snorkeling and Diving Tours |
| Olbia | A bustling town and major gateway to Sardinia, renowned for its nightlife and dining options. Attracts both tourists and business travelers who seek convenience and entertainment. | Olbia Cathedral, Porto Rotondo, Local Beaches, Shopping District |
Understanding Airbnb License Requirements & STR Laws in Caragnani/Calangianus (2025)
Yes, Caragnani/Calangianus, Sardinia, Italy enforces high STR regulations. Obtaining a license and ensuring compliance is almost certainly required according to current 2025 STR laws. Always verify the latest short term rental regulations and Airbnb license requirements directly with local government authorities for Caragnani/Calangianus to ensure full compliance before hosting.
(Source: AirROI data, 2025, based on 68% licensed listings)
Top Performing Airbnb Properties in Caragnani/Calangianus (2025)
Benchmark your potential! Explore examples of top-performing Airbnb properties in Caragnani/Calangianusbased on Trailing Twelve Month (TTM) revenue. Analyze their characteristics, revenue, occupancy rate, and ADR to understand what drives success in this market.
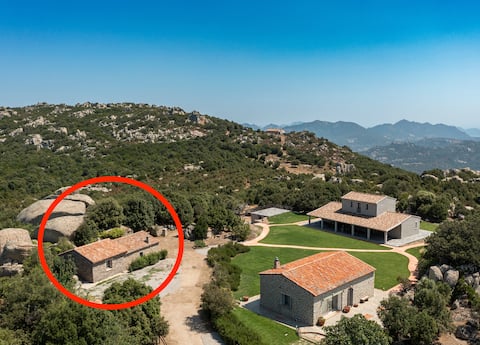
Ancient Gallura Farmhouse
Entire Place • 2 bedrooms

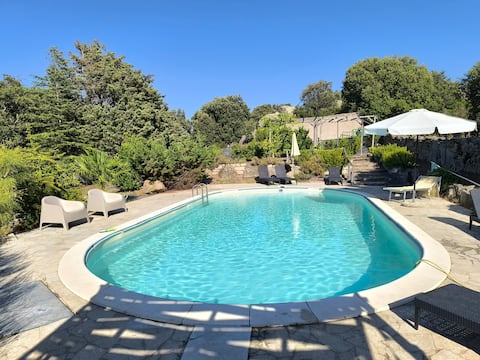
Le Querce, Vacation Home With Swimming Pool!
Entire Place • 2 bedrooms

EcoLodge in nature + "La Grande Quercia" swimming pool
Entire Place • 2 bedrooms
"Le Grazie" Holiday home with pool
Entire Place • 2 bedrooms
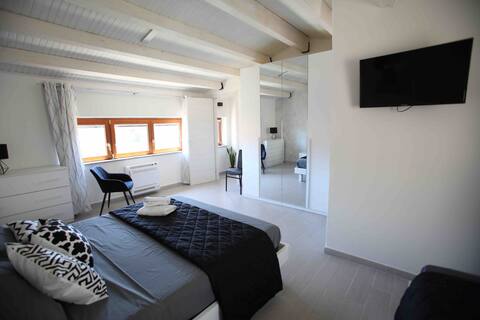
Sweet C&C
Entire Place • 1 bedroom
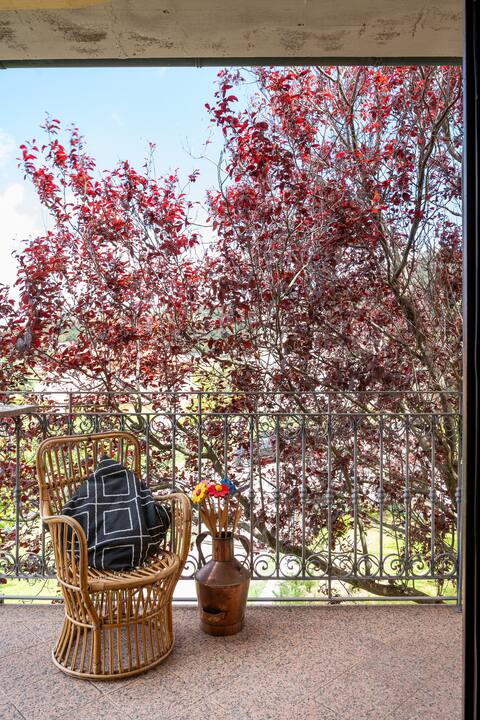
House in Gallura - Sea, Mountain, Excursions
Entire Place • 3 bedrooms
Note: Performance varies based on location, size, amenities, seasonality, and management quality. Data reflects the past 12 months.
Top Performing Airbnb Hosts in Caragnani/Calangianus (2025)
Learn from the best! This table showcases top-performing Airbnb hosts in Caragnani/Calangianus based on the number of properties managed and estimated total revenue over the past year. Analyze their scale and performance metrics.
| Host Name | Properties | Grossing Revenue | Stay Reviews | Avg Rating |
|---|---|---|---|---|
| Antonio | 4 | $58,191 | 222 | 4.86/5.0 |
| Loredana | 1 | $27,765 | 1 | Not Rated |
| Giovanni | 1 | $21,373 | 144 | 4.84/5.0 |
| Orlando | 2 | $17,464 | 71 | 4.87/5.0 |
| Luciano | 1 | $15,858 | 19 | 5.00/5.0 |
| Alessandra | 2 | $15,483 | 101 | 4.94/5.0 |
| Paola | 1 | $13,973 | 49 | 4.92/5.0 |
| Pes | 1 | $6,599 | 100 | 4.64/5.0 |
| Giuliano Salvatore | 2 | $5,860 | 6 | 5.00/5.0 |
| Marcello | 1 | $5,147 | 7 | 5.00/5.0 |
Analyzing the strategies of top hosts, such as their property selection, pricing, and guest communication, can offer valuable lessons for optimizing your own Airbnb operations in Caragnani/Calangianus.
Dive Deeper: Advanced Caragnani/Calangianus STR Market Data (2025)
Ready to unlock more insights? AirROI provides access to advanced metrics and comprehensive Airbnb data for Caragnani/Calangianus. Explore detailed analytics beyond this report to refine your investment strategy, optimize pricing, and maximize your vacation rental profits.
Explore Advanced MetricsCaragnani/Calangianus Short-Term Rental Market Composition (2025): Property & Room Types
Room Type Distribution
Property Type Distribution
Market Composition Insights for Caragnani/Calangianus
- The Caragnani/Calangianus Airbnb market composition is heavily skewed towards Entire Home/Apt listings, which make up 73.7% of the 19 active rentals. This indicates strong guest preference for privacy and space.
- Looking at the property type distribution in Caragnani/Calangianus, House properties are the most common (63.2%), reflecting the local real estate landscape.
- Houses represent a significant 63.2% portion, catering likely to families or larger groups.
- The presence of 21.1% Hotel/Boutique listings indicates integration with traditional hospitality.
Caragnani/Calangianus Airbnb Room Capacity Analysis (2025): Bedroom Distribution
Distribution of Listings by Number of Bedrooms
Room Capacity Insights for Caragnani/Calangianus
- The dominant room capacity in Caragnani/Calangianus is 1 bedroom listings, making up 31.6% of the market. This suggests a strong demand for properties suitable for couples or solo travelers.
- Together, 1 bedroom and 2 bedrooms properties represent 52.7% of the active Airbnb listings in Caragnani/Calangianus, indicating a high concentration in these sizes.
- A significant 21.1% of listings offer 3+ bedrooms, catering to larger groups and families seeking more space in Caragnani/Calangianus.
Caragnani/Calangianus Vacation Rental Guest Capacity Trends (2025)
Distribution of Listings by Guest Capacity
Guest Capacity Insights for Caragnani/Calangianus
- The most common guest capacity trend in Caragnani/Calangianus vacation rentals is listings accommodating 4 guests (26.3%). This suggests the primary traveler segment is likely small families or groups.
- Properties designed for 4 guests and 5 guests dominate the Caragnani/Calangianus STR market, accounting for 42.1% of listings.
- 15.8% of properties accommodate 6+ guests, serving the market segment for larger families or group travel in Caragnani/Calangianus.
- On average, properties in Caragnani/Calangianus are equipped to host 3.5 guests.
Caragnani/Calangianus Airbnb Booking Patterns (2025): Available vs. Booked Days
Available Days Distribution
Booked Days Distribution
Booking Pattern Insights for Caragnani/Calangianus
- The most common availability pattern in Caragnani/Calangianus falls within the 271-366 days range, representing 63.2% of listings. This suggests many properties have significant open periods on their calendars.
- Approximately 94.8% of listings show high availability (181+ days open annually), indicating potential for increased bookings or specific owner usage patterns.
- For booked days, the 1-30 days range is most frequent in Caragnani/Calangianus (42.1%), reflecting common guest stay durations or potential owner blocking patterns.
- A notable 5.3% of properties secure long booking periods (181+ days booked per year), highlighting successful long-term rental strategies or significant owner usage.
Caragnani/Calangianus Airbnb Minimum Stay Requirements Analysis
Distribution of Listings by Minimum Night Requirement
1 Night
3 listings
15.8% of total
2 Nights
3 listings
15.8% of total
3 Nights
1 listings
5.3% of total
4-6 Nights
1 listings
5.3% of total
7-29 Nights
1 listings
5.3% of total
30+ Nights
10 listings
52.6% of total
Key Insights
- The most prevalent minimum stay requirement in Caragnani/Calangianus is 30+ Nights, adopted by 52.6% of listings. This highlights the market's preference for longer commitments.
- A significant segment (52.6%) caters to monthly stays (30+ nights) in Caragnani/Calangianus, pointing to opportunities in the extended-stay market.
Recommendations
- Align with the market by considering a 30+ Nights minimum stay, as 52.6% of Caragnani/Calangianus hosts use this setting.
- If feasible, allowing 1-night stays, especially midweek or during low season, could capture last-minute bookings, as only 15.8% currently do.
- Explore offering discounts for stays of 30+ nights to attract the 52.6% of the market seeking extended stays.
- Adjust minimum nights based on seasonality – potentially shorter during low season and longer during peak demand periods in Caragnani/Calangianus.
Caragnani/Calangianus Airbnb Cancellation Policy Trends Analysis (2025)
Flexible
8 listings
42.1% of total
Moderate
10 listings
52.6% of total
Strict
1 listings
5.3% of total
Cancellation Policy Insights for Caragnani/Calangianus
- The prevailing Airbnb cancellation policy trend in Caragnani/Calangianus is Moderate, used by 52.6% of listings.
- The market strongly favors guest-friendly terms, with 94.7% of listings offering Flexible or Moderate policies. This suggests guests in Caragnani/Calangianus may expect booking flexibility.
- Strict cancellation policies are quite rare (5.3%), potentially making listings with this policy less competitive unless justified by high demand or property type.
Recommendations for Hosts
- Consider adopting a Moderate policy to align with the 52.6% market standard in Caragnani/Calangianus.
- Using a Strict policy might deter some guests, as only 5.3% of listings use it. Evaluate if potential revenue protection outweighs possible lower booking rates.
- Regularly review your cancellation policy against competitors and market demand shifts in Caragnani/Calangianus.
Caragnani/Calangianus STR Booking Lead Time Analysis (2025)
Average Booking Lead Time by Month
Booking Lead Time Insights for Caragnani/Calangianus
- The overall average booking lead time for vacation rentals in Caragnani/Calangianus is 51 days.
- Guests book furthest in advance for stays during August (average 110 days), likely coinciding with peak travel demand or local events.
- The shortest booking windows occur for stays in January (average 7 days), indicating more last-minute travel plans during this time.
- Seasonally, Summer (79 days avg.) sees the longest lead times, while Winter (15 days avg.) has the shortest, reflecting typical travel planning cycles.
Recommendations for Hosts
- Use the overall average lead time (51 days) as a baseline for your pricing and availability strategy in Caragnani/Calangianus.
- For August stays, consider implementing length-of-stay discounts or slightly higher rates for bookings made less than 110 days out to capitalize on advance planning.
- During January, focus on last-minute booking availability and promotions, as guests book with very short notice (7 days avg.).
- Target marketing efforts for the Summer season well in advance (at least 79 days) to capture early planners.
- Monitor your own booking lead times against these Caragnani/Calangianus averages to identify opportunities for dynamic pricing adjustments.
Popular & Essential Airbnb Amenities in Caragnani/Calangianus (2025)
Amenity Prevalence
Amenity Insights for Caragnani/Calangianus
- Popular amenities like Essentials, Hangers, Hair dryer are common but not universal. Offering these can provide a competitive edge.
Recommendations for Hosts
- Consider adding popular differentiators like Essentials or Hangers to increase appeal.
- Highlight unique or less common amenities you offer (e.g., hot tub, dedicated workspace, EV charger) in your listing description and photos.
- Regularly check competitor amenities in Caragnani/Calangianus to stay competitive.
Caragnani/Calangianus Airbnb Guest Demographics & Profile Analysis (2025)
Guest Profile Summary for Caragnani/Calangianus
- The typical guest profile for Airbnb in Caragnani/Calangianus consists of predominantly international visitors (88%), with top international origins including Italy, typically belonging to the Post-2000s (Gen Z/Alpha) group (50%), primarily speaking English or French.
- Domestic travelers account for 12.0% of guests.
- Key international markets include France (32%) and Italy (12%).
- Top languages spoken are English (39.5%) followed by French (16.3%).
- A significant demographic segment is the Post-2000s (Gen Z/Alpha) group, representing 50% of guests.
Recommendations for Hosts
- Focus marketing internationally, particularly towards travelers from Italy.
- Tailor amenities and listing descriptions to appeal to the dominant Post-2000s (Gen Z/Alpha) demographic (e.g., highlight fast WiFi, smart home features, local guides).
- Highlight unique local experiences or amenities relevant to the primary guest profile.
- Consider seasonal promotions aligned with peak travel times for key origin markets.
Nearby Short-Term Rental Market Comparison
How does the Caragnani/Calangianus Airbnb market stack up against its neighbors? Compare key performance metrics like average monthly revenue, ADR, and occupancy rates in surrounding areas to understand the broader regional STR landscape.
| Market | Active Properties | Monthly Revenue | Daily Rate | Avg. Occupancy |
|---|---|---|---|---|
| Porto Cervo | 188 | $3,259 | $564.78 | 38% |
| Maracalagonis | 261 | $2,483 | $341.24 | 42% |
| Poltu Quatu | 56 | $2,288 | $318.50 | 39% |
| Alzachèna/Arzachena | 336 | $2,196 | $342.29 | 40% |
| Golfo Aranci | 24 | $2,164 | $401.62 | 43% |
| Lecci | 575 | $2,133 | $278.58 | 43% |
| Baja Sardinia | 119 | $2,110 | $309.77 | 39% |
| Zonza | 736 | $2,013 | $302.76 | 40% |
| Sarrocu/Sarroch | 87 | $2,009 | $241.43 | 40% |
| Liscia di Vacca | 11 | $1,990 | $398.41 | 37% |