Carbonia Airbnb Market Analysis 2026: Short Term Rental Data & Vacation Rental Statistics in Sardinia, Italy
Is Airbnb profitable in Carbonia in 2026? Explore comprehensive Airbnb analytics for Carbonia, Sardinia, Italy to uncover income potential. This 2026 STR market report for Carbonia, based on AirROI data from February 2025 to January 2026, reveals key trends in the niche market of 54 active listings.
Whether you're considering an Airbnb investment in Carbonia, optimizing your existing vacation rental, or exploring rental arbitrage opportunities, understanding the Carbonia Airbnb data is crucial. Navigating the high regulation landscape is key to maximizing your short term rental income potential. Let's dive into the specifics.
Key Carbonia Airbnb Performance Metrics Overview
Monthly Airbnb Revenue Variations & Income Potential in Carbonia (2026)
Understanding the monthly revenue variations for Airbnb listings in Carbonia is key to maximizing your short term rental income potential. Seasonality significantly impacts earnings. Our analysis, based on data from the past 12 months, shows that the peak revenue month for STRs in Carbonia is typically August, while February often presents the lowest earnings, highlighting opportunities for strategic pricing adjustments during shoulder and low seasons. Explore the typical Airbnb income in Carbonia across different performance tiers:
- Best-in-class properties (Top 10%) achieve $1,876+ monthly, often utilizing dynamic pricing and superior guest experiences.
- Strong performing properties (Top 25%) earn $1,225 or more, indicating effective management and desirable locations/amenities.
- Typical properties (Median) generate around $723 per month, representing the average market performance.
- Entry-level properties (Bottom 25%) see earnings around $363, often with potential for optimization.
Average Monthly Airbnb Earnings Trend in Carbonia
Carbonia Airbnb Occupancy Rate Trends (2026)
Maximize your bookings by understanding the Carbonia STR occupancy trends. Seasonal demand shifts significantly influence how often properties are booked. Typically, Augustsees the highest demand (peak season occupancy), while March experiences the lowest (low season). Effective strategies, like adjusting minimum stays or offering promotions, can boost occupancy during slower periods. Here's how different property tiers perform in Carbonia:
- Best-in-class properties (Top 10%) achieve 59%+ occupancy, indicating high desirability and potentially optimized availability.
- Strong performing properties (Top 25%) maintain 47% or higher occupancy, suggesting good market fit and guest satisfaction.
- Typical properties (Median) have an occupancy rate around 30%.
- Entry-level properties (Bottom 25%) average 13% occupancy, potentially facing higher vacancy.
Average Monthly Occupancy Rate Trend in Carbonia
Average Daily Rate (ADR) Airbnb Trends in Carbonia (2026)
Effective short term rental pricing strategy in Carbonia involves understanding monthly ADR fluctuations. The Average Daily Rate (ADR) for Airbnb in Carbonia typically peaks in August and dips lowest during March. Leveraging Airbnb dynamic pricing tools or strategies based on this seasonality can significantly boost revenue. Here's a look at the typical nightly rates achieved:
- Best-in-class properties (Top 10%) command rates of $131+ per night, often due to premium features or locations.
- Strong performing properties (Top 25%) achieve nightly rates of $106 or more.
- Typical properties (Median) charge around $84 per night.
- Entry-level properties (Bottom 25%) earn around $69 per night.
Average Daily Rate (ADR) Trend by Month in Carbonia
Get Live Carbonia Market Intelligence 👇

Explore Real-time Analytics
Airbnb Seasonality Analysis & Trends in Carbonia (2026)
Peak Season (August, July, September)
- Revenue averages $1,592 per month
- Occupancy rates average 51.3%
- Daily rates average $102
Shoulder Season
- Revenue averages $733 per month
- Occupancy maintains around 27.1%
- Daily rates hold near $95
Low Season (January, February, December)
- Revenue drops to average $524 per month
- Occupancy decreases to average 21.8%
- Daily rates adjust to average $97
Seasonality Insights for Carbonia
- The Airbnb seasonality in Carbonia shows highly seasonal trends requiring careful strategy. While the sections above show seasonal averages, it's also insightful to look at the extremes:
- During the high season, the absolute peak month showcases Carbonia's highest earning potential, with monthly revenues capable of climbing to $1,863, occupancy reaching a high of 57.7%, and ADRs peaking at $105.
- Conversely, the slowest single month of the year, typically falling within the low season, marks the market's lowest point. In this month, revenue might dip to $448, occupancy could drop to 18.2%, and ADRs may adjust down to $91.
- Understanding both the seasonal averages and these monthly peaks and troughs in revenue, occupancy, and ADR is crucial for maximizing your Airbnb profit potential in Carbonia.
Seasonal Strategies for Maximizing Profit
- Peak Season: Maximize revenue through premium pricing and potentially longer minimum stays. Ensure high availability.
- Low Season: Offer competitive pricing, special promotions (e.g., extended stay discounts), and flexible cancellation policies. Target off-season travelers like remote workers or budget-conscious guests.
- Shoulder Seasons: Implement dynamic pricing that balances peak and low rates. Target weekend travelers or specific events. Offer slightly more flexible terms than peak season.
- Regularly analyze your own performance against these Carbonia seasonality benchmarks and adjust your pricing and availability strategy accordingly.
Best Areas for Airbnb Investment in Carbonia (2026)
Exploring the top neighborhoods for short-term rentals in Carbonia? This section highlights key areas, outlining why they are attractive for hosts and guests, along with notable local attractions. Consider these locations based on your target guest profile and investment strategy.
| Neighborhood / Area | Why Host Here? (Target Guests & Appeal) | Key Attractions & Landmarks |
|---|---|---|
| Centro Storico | The historic center of Carbonia, full of cultural heritage and architectural interest. It attracts tourists interested in exploring the history of Sardinia and its mining past. | Museo del Carbone, Church of Santa Barbara, Parco della Resistenza, Villa Sulcis, Piazza Roma |
| Monte Sirai | An archaeological site with ancient ruins that draw history enthusiasts and tourists interested in archaeology and history of Sardinia. | Monte Sirai Archaeological Site, Panoramic views of the Sulcis region, Nearby hiking trails, Interpretative center |
| Pilastri Beach | A beautiful coastal area known for its sandy beaches and clear waters. Ideal for vacation rentals targeting beachgoers and families. | Pilastri Beach, Water sports activities, Local seafood restaurants, Beach bars |
| Carbonia Coal Mine | An industrial heritage site that attracts visitors interested in the mining history of Sardinia and offers unique tours. | Carbonia Coal Mine Tours, Historical exhibitions, Surrounding nature trails |
| Torre di Calasetta | A scenic tower offering stunning views and a rich history. It's a great spot for tourists and photography enthusiasts. | Torre di Calasetta, Coastal walks, Nearby beaches, Local shops |
| Sardinian Countryside | The rural areas surrounding Carbonia offer a taste of traditional Sardinian life, appealing to tourists looking for authentic experiences. | Agro-tourism farms, Local festivals, Winery tours, Hiking and nature walks |
| Portoscuso | A nearby port town with beautiful beaches and a vibrant local culture. Attracts tourists seeking both relaxation and local cuisine. | Portoscuso Beach, Ferry to Carloforte, Local fish market, Historical town center |
| Sant'Antioco Island | Easily accessible from Carbonia, this island is known for its stunning landscapes and ancient sites, perfect for tourists interested in nature and history. | Sant'Antioco Island Beaches, Phoenician Archeological Museum, Cala Lunga, Scoglio del Catalano |
Understanding Airbnb License Requirements & STR Laws in Carbonia (2026)
Yes, Carbonia, Sardinia, Italy enforces high STR regulations. Obtaining a license and ensuring compliance is almost certainly required according to current 2026 STR laws. Always verify the latest short term rental regulations and Airbnb license requirements directly with local government authorities for Carbonia to ensure full compliance before hosting.
(Source: AirROI data, 2026, based on 87% licensed listings)
Top Performing Airbnb Properties in Carbonia (2026)
Benchmark your potential! Explore examples of top-performing Airbnb properties in Carboniabased on Trailing Twelve Month (TTM) revenue. Analyze their characteristics, revenue, occupancy rate, and ADR to understand what drives success in this market.

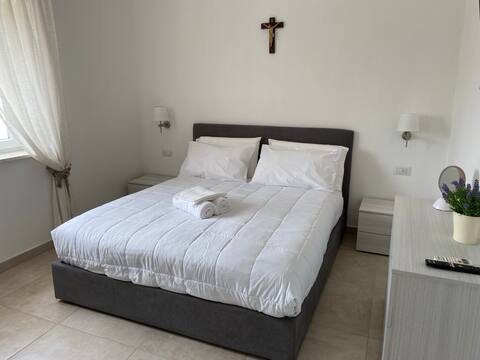
APARTMENT NEBIDA SEA VIEW
Entire Place • 2 bedrooms
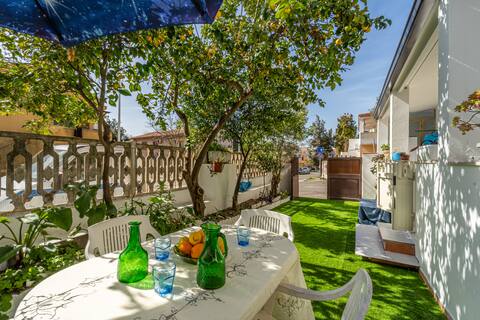
Vacation Home near the beaches
Entire Place • 2 bedrooms

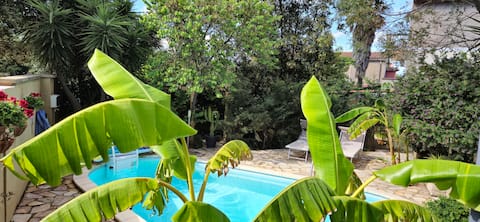
Paola's Garden
Entire Place • 2 bedrooms
Piero's Apartment Carbonia
Entire Place • 2 bedrooms

Trivano il Rifugio
Entire Place • 2 bedrooms
Studio apartment Gio
Entire Place • 1 bedroom
Note: Performance varies based on location, size, amenities, seasonality, and management quality. Data reflects the past 12 months.
Top Performing Airbnb Hosts in Carbonia (2026)
Learn from the best! This table showcases top-performing Airbnb hosts in Carbonia based on the number of properties managed and estimated total revenue over the past year. Analyze their scale and performance metrics.
| Host Name | Properties | Grossing Revenue | Stay Reviews | Avg Rating |
|---|---|---|---|---|
| Gianna | 4 | $41,986 | 30 | 4.86/5.0 |
| Annarella | 1 | $24,000 | 123 | 4.96/5.0 |
| Federico | 1 | $19,499 | 28 | 5.00/5.0 |
| Flavio | 1 | $17,839 | 28 | 4.46/5.0 |
| Enrico | 1 | $16,140 | 2 | Not Rated |
| Sandro | 4 | $15,042 | 79 | 4.47/5.0 |
| Andrea E Sandra | 2 | $14,017 | 189 | 4.82/5.0 |
| Ivan | 1 | $12,179 | 40 | 4.65/5.0 |
| Marco | 1 | $12,011 | 2 | Not Rated |
| Alderico | 1 | $11,545 | 38 | 4.95/5.0 |
Analyzing the strategies of top hosts, such as their property selection, pricing, and guest communication, can offer valuable lessons for optimizing your own Airbnb operations in Carbonia.
Dive Deeper: Advanced Carbonia STR Market Data (2026)
Ready to unlock more insights? AirROI provides access to advanced metrics and comprehensive Airbnb data for Carbonia. Explore detailed analytics beyond this report to refine your investment strategy, optimize pricing, and maximize your vacation rental profits.
Explore Advanced MetricsCarbonia Short-Term Rental Market Composition (2026): Property & Room Types
Room Type Distribution
Property Type Distribution
Market Composition Insights for Carbonia
- The Carbonia Airbnb market composition is heavily skewed towards Entire Home/Apt listings, which make up 81.5% of the 54 active rentals. This indicates strong guest preference for privacy and space.
- Looking at the property type distribution in Carbonia, House properties are the most common (44.4%), reflecting the local real estate landscape.
- Houses represent a significant 44.4% portion, catering likely to families or larger groups.
- The presence of 13% Hotel/Boutique listings indicates integration with traditional hospitality.
- Smaller segments like outdoor/unique, others (combined 5.6%) offer potential for unique stay experiences.
Carbonia Airbnb Room Capacity Analysis (2026): Bedroom Distribution
Distribution of Listings by Number of Bedrooms
Room Capacity Insights for Carbonia
- The dominant room capacity in Carbonia is 2 bedrooms listings, making up 53.7% of the market. This suggests a strong demand for properties suitable for couples or solo travelers.
- Together, 2 bedrooms and 1 bedroom properties represent 74.1% of the active Airbnb listings in Carbonia, indicating a high concentration in these sizes.
Carbonia Vacation Rental Guest Capacity Trends (2026)
Distribution of Listings by Guest Capacity
Guest Capacity Insights for Carbonia
- The most common guest capacity trend in Carbonia vacation rentals is listings accommodating 4 guests (33.3%). This suggests the primary traveler segment is likely small families or groups.
- Properties designed for 4 guests and 5 guests dominate the Carbonia STR market, accounting for 51.8% of listings.
- 13.1% of properties accommodate 6+ guests, serving the market segment for larger families or group travel in Carbonia.
- On average, properties in Carbonia are equipped to host 3.6 guests.
Carbonia Airbnb Booking Patterns (2026): Available vs. Booked Days
Available Days Distribution
Booked Days Distribution
Booking Pattern Insights for Carbonia
- The most common availability pattern in Carbonia falls within the 271-366 days range, representing 70.4% of listings. This suggests many properties have significant open periods on their calendars.
- Approximately 96.3% of listings show high availability (181+ days open annually), indicating potential for increased bookings or specific owner usage patterns.
- For booked days, the 31-90 days range is most frequent in Carbonia (42.6%), reflecting common guest stay durations or potential owner blocking patterns.
- A notable 5.6% of properties secure long booking periods (181+ days booked per year), highlighting successful long-term rental strategies or significant owner usage.
Carbonia Airbnb Minimum Stay Requirements Analysis
Distribution of Listings by Minimum Night Requirement
1 Night
14 listings
25.9% of total
2 Nights
7 listings
13% of total
3 Nights
10 listings
18.5% of total
4-6 Nights
3 listings
5.6% of total
7-29 Nights
6 listings
11.1% of total
30+ Nights
14 listings
25.9% of total
Key Insights
- The most prevalent minimum stay requirement in Carbonia is 1 Night, adopted by 25.9% of listings. This highlights the market's preference for shorter, flexible bookings.
- A significant segment (25.9%) caters to monthly stays (30+ nights) in Carbonia, pointing to opportunities in the extended-stay market.
Recommendations
- Align with the market by considering a 1 Night minimum stay, as 25.9% of Carbonia hosts use this setting.
- If feasible, allowing 1-night stays, especially midweek or during low season, could capture last-minute bookings, as only 25.9% currently do.
- Explore offering discounts for stays of 30+ nights to attract the 25.9% of the market seeking extended stays.
- Adjust minimum nights based on seasonality – potentially shorter during low season and longer during peak demand periods in Carbonia.
Carbonia Airbnb Cancellation Policy Trends Analysis (2026)
Super Strict 30 Days
2 listings
3.7% of total
Limited
2 listings
3.7% of total
Flexible
23 listings
42.6% of total
Moderate
15 listings
27.8% of total
Firm
8 listings
14.8% of total
Strict
4 listings
7.4% of total
Cancellation Policy Insights for Carbonia
- The prevailing Airbnb cancellation policy trend in Carbonia is Flexible, used by 42.6% of listings.
- The market strongly favors guest-friendly terms, with 70.4% of listings offering Flexible or Moderate policies. This suggests guests in Carbonia may expect booking flexibility.
- Strict cancellation policies are quite rare (7.4%), potentially making listings with this policy less competitive unless justified by high demand or property type.
Recommendations for Hosts
- Consider adopting a Flexible policy to align with the 42.6% market standard in Carbonia.
- Using a Strict policy might deter some guests, as only 7.4% of listings use it. Evaluate if potential revenue protection outweighs possible lower booking rates.
- Regularly review your cancellation policy against competitors and market demand shifts in Carbonia.
Carbonia STR Booking Lead Time Analysis (2026)
Average Booking Lead Time by Month
Booking Lead Time Insights for Carbonia
- The overall average booking lead time for vacation rentals in Carbonia is 60 days.
- Guests book furthest in advance for stays during August (average 99 days), likely coinciding with peak travel demand or local events.
- The shortest booking windows occur for stays in February (average 11 days), indicating more last-minute travel plans during this time.
- Seasonally, Summer (71 days avg.) sees the longest lead times, while Winter (32 days avg.) has the shortest, reflecting typical travel planning cycles.
Recommendations for Hosts
- Use the overall average lead time (60 days) as a baseline for your pricing and availability strategy in Carbonia.
- For August stays, consider implementing length-of-stay discounts or slightly higher rates for bookings made less than 99 days out to capitalize on advance planning.
- During February, focus on last-minute booking availability and promotions, as guests book with very short notice (11 days avg.).
- Target marketing efforts for the Summer season well in advance (at least 71 days) to capture early planners.
- Monitor your own booking lead times against these Carbonia averages to identify opportunities for dynamic pricing adjustments.
Popular & Essential Airbnb Amenities in Carbonia (2026)
Amenity Prevalence
Amenity Insights for Carbonia
- Popular amenities like Hair dryer, Air conditioning, Heating are common but not universal. Offering these can provide a competitive edge.
- Warning: Wifi is not universally provided but is considered essential globally. Ensure reliable Wifi is offered.
Recommendations for Hosts
- Consider adding popular differentiators like Hair dryer or Air conditioning to increase appeal.
- Highlight unique or less common amenities you offer (e.g., hot tub, dedicated workspace, EV charger) in your listing description and photos.
- Regularly check competitor amenities in Carbonia to stay competitive.
Carbonia Airbnb Guest Demographics & Profile Analysis (2026)
Guest Profile Summary for Carbonia
- The typical guest profile for Airbnb in Carbonia consists of predominantly international visitors (77%), with top international origins including Italy, typically belonging to the Post-2000s (Gen Z/Alpha) group (50%), primarily speaking English or French.
- Domestic travelers account for 23.0% of guests.
- Key international markets include France (36.3%) and Italy (23%).
- Top languages spoken are English (35.8%) followed by French (22%).
- A significant demographic segment is the Post-2000s (Gen Z/Alpha) group, representing 50% of guests.
Recommendations for Hosts
- Focus marketing internationally, particularly towards travelers from Italy.
- Tailor amenities and listing descriptions to appeal to the dominant Post-2000s (Gen Z/Alpha) demographic (e.g., highlight fast WiFi, smart home features, local guides).
- Highlight unique local experiences or amenities relevant to the primary guest profile.
- Consider seasonal promotions aligned with peak travel times for key origin markets.
Nearby Short-Term Rental Market Comparison
How does the Carbonia Airbnb market stack up against its neighbors? Compare key performance metrics like average monthly revenue, ADR, and occupancy rates in surrounding areas to understand the broader regional STR landscape.
| Market | Active Properties | Monthly Revenue | Daily Rate | Avg. Occupancy |
|---|---|---|---|---|
| Maracalagonis | 268 | $2,396 | $338.45 | 43% |
| Torre Delle Stelle (Maracalagonis) | 18 | $2,082 | $416.40 | 42% |
| Pittulongu | 22 | $2,036 | $399.40 | 45% |
| Sarrocu/Sarroch | 89 | $1,968 | $239.26 | 43% |
| Golfo Aranci | 36 | $1,963 | $362.29 | 46% |
| Castiadas | 188 | $1,953 | $263.12 | 42% |
| Santa Margherita di Pula | 28 | $1,860 | $393.54 | 46% |
| Santu Diadòru/San Teodoro | 880 | $1,815 | $286.96 | 43% |
| La Caletta | 13 | $1,801 | $176.59 | 50% |
| Figari/Golfo Aranci | 383 | $1,651 | $286.39 | 39% |