Giba Airbnb Market Analysis 2026: Short Term Rental Data & Vacation Rental Statistics in Sardinia, Italy
Is Airbnb profitable in Giba in 2026? Explore comprehensive Airbnb analytics for Giba, Sardinia, Italy to uncover income potential. This 2026 STR market report for Giba, based on AirROI data from February 2025 to January 2026, reveals key trends in the niche market of 19 active listings.
Whether you're considering an Airbnb investment in Giba, optimizing your existing vacation rental, or exploring rental arbitrage opportunities, understanding the Giba Airbnb data is crucial. Navigating the high regulation landscape is key to maximizing your short term rental income potential. Let's dive into the specifics.
Key Giba Airbnb Performance Metrics Overview
Monthly Airbnb Revenue Variations & Income Potential in Giba (2026)
Understanding the monthly revenue variations for Airbnb listings in Giba is key to maximizing your short term rental income potential. Seasonality significantly impacts earnings. Our analysis, based on data from the past 12 months, shows that the peak revenue month for STRs in Giba is typically August, while December often presents the lowest earnings, highlighting opportunities for strategic pricing adjustments during shoulder and low seasons. Explore the typical Airbnb income in Giba across different performance tiers:
- Best-in-class properties (Top 10%) achieve $2,002+ monthly, often utilizing dynamic pricing and superior guest experiences.
- Strong performing properties (Top 25%) earn $1,331 or more, indicating effective management and desirable locations/amenities.
- Typical properties (Median) generate around $661 per month, representing the average market performance.
- Entry-level properties (Bottom 25%) see earnings around $292, often with potential for optimization.
Average Monthly Airbnb Earnings Trend in Giba
Giba Airbnb Occupancy Rate Trends (2026)
Maximize your bookings by understanding the Giba STR occupancy trends. Seasonal demand shifts significantly influence how often properties are booked. Typically, Augustsees the highest demand (peak season occupancy), while December experiences the lowest (low season). Effective strategies, like adjusting minimum stays or offering promotions, can boost occupancy during slower periods. Here's how different property tiers perform in Giba:
- Best-in-class properties (Top 10%) achieve 55%+ occupancy, indicating high desirability and potentially optimized availability.
- Strong performing properties (Top 25%) maintain 46% or higher occupancy, suggesting good market fit and guest satisfaction.
- Typical properties (Median) have an occupancy rate around 20%.
- Entry-level properties (Bottom 25%) average 8% occupancy, potentially facing higher vacancy.
Average Monthly Occupancy Rate Trend in Giba
Average Daily Rate (ADR) Airbnb Trends in Giba (2026)
Effective short term rental pricing strategy in Giba involves understanding monthly ADR fluctuations. The Average Daily Rate (ADR) for Airbnb in Giba typically peaks in September and dips lowest during February. Leveraging Airbnb dynamic pricing tools or strategies based on this seasonality can significantly boost revenue. Here's a look at the typical nightly rates achieved:
- Best-in-class properties (Top 10%) command rates of $384+ per night, often due to premium features or locations.
- Strong performing properties (Top 25%) achieve nightly rates of $141 or more.
- Typical properties (Median) charge around $108 per night.
- Entry-level properties (Bottom 25%) earn around $87 per night.
Average Daily Rate (ADR) Trend by Month in Giba
Get Live Giba Market Intelligence 👇

Explore Real-time Analytics
Airbnb Seasonality Analysis & Trends in Giba (2026)
Peak Season (August, July, June)
- Revenue averages $1,810 per month
- Occupancy rates average 40.6%
- Daily rates average $161
Shoulder Season
- Revenue averages $767 per month
- Occupancy maintains around 28.2%
- Daily rates hold near $153
Low Season (February, November, December)
- Revenue drops to average $334 per month
- Occupancy decreases to average 12.7%
- Daily rates adjust to average $153
Seasonality Insights for Giba
- The Airbnb seasonality in Giba shows highly seasonal trends requiring careful strategy. While the sections above show seasonal averages, it's also insightful to look at the extremes:
- During the high season, the absolute peak month showcases Giba's highest earning potential, with monthly revenues capable of climbing to $2,698, occupancy reaching a high of 47.3%, and ADRs peaking at $185.
- Conversely, the slowest single month of the year, typically falling within the low season, marks the market's lowest point. In this month, revenue might dip to $162, occupancy could drop to 4.9%, and ADRs may adjust down to $135.
- Understanding both the seasonal averages and these monthly peaks and troughs in revenue, occupancy, and ADR is crucial for maximizing your Airbnb profit potential in Giba.
Seasonal Strategies for Maximizing Profit
- Peak Season: Maximize revenue through premium pricing and potentially longer minimum stays. Ensure high availability.
- Low Season: Offer competitive pricing, special promotions (e.g., extended stay discounts), and flexible cancellation policies. Target off-season travelers like remote workers or budget-conscious guests.
- Shoulder Seasons: Implement dynamic pricing that balances peak and low rates. Target weekend travelers or specific events. Offer slightly more flexible terms than peak season.
- Regularly analyze your own performance against these Giba seasonality benchmarks and adjust your pricing and availability strategy accordingly.
Best Areas for Airbnb Investment in Giba (2026)
Exploring the top neighborhoods for short-term rentals in Giba? This section highlights key areas, outlining why they are attractive for hosts and guests, along with notable local attractions. Consider these locations based on your target guest profile and investment strategy.
| Neighborhood / Area | Why Host Here? (Target Guests & Appeal) | Key Attractions & Landmarks |
|---|---|---|
| Giba Center | The heart of Giba, offering easy access to local shops and restaurants. A great place for tourists to experience the local culture and cuisine while being close to popular attractions. | Parco Monte dei Sette Fratelli, Chiesa di San Giovanni Battista, Local markets, Parks and outdoor spaces, Restaurants offering Sardinian cuisine |
| Nora Beach | Scenic coastal area known for its beautiful beaches and archaeological sites. Perfect for guests looking for relaxation and history, located near the ancient ruins of Nora. | Nora Archaeological Site, Nora Beach, Pinus Village Beach, Sandy beaches, Water sports activities |
| Sant'Antioco Island | Charming island easily accessed from Giba, known for its picturesque landscapes and local culture. Ideal for tourists seeking a unique island experience. | Sant'Antioco Island beaches, Museo del Bisso, Local seafood restaurants, Hiking trails, Cultural festivals |
| Excursion to the Southwest Coast | Popular for outdoor activities such as hiking and biking, and exploring the stunning coastal scenery. Attracts adventure seekers and nature lovers. | Costa Verde, Hiking trails, Stunning coastal views, Caves and natural formations, Wildlife watching |
| Villasimius Nearby | Famous for its crystal-clear waters and vibrant nightlife. A hotspot for beach goers and young travelers looking for fun and sun. | Spiaggia del Riso, Porto Giunco, Local nightlife, Water sports, Cafes and bars |
| Cagliari Day Trip | Close enough for easy day trips to the capital of Sardinia, offering a blend of historical attractions and urban experiences. A great option for those looking to explore beyond Giba. | Bastione di Saint Remy, Cagliari Cathedral, Poetto Beach, Local shops, Restaurants |
| Local Wine Region | Home to many vineyards, attracting tourists interested in wine tasting and culinary experiences. Perfect for guests looking to enjoy local products and specialties. | Wine tasting tours, Vineyards, Farm-to-table restaurants, Culinary classes, Scenic drives |
| Top Beaches of Sulcis | The coastline near Giba is famous for its stunning beaches, attracting tourists looking for sun and superior natural beauty. Great for families and couples. | Spiaggia di Fontanamare, Spiaggia di Torre di Cala d'Oliva, Family-friendly beaches, Scenic viewpoints, Local beach clubs |
Understanding Airbnb License Requirements & STR Laws in Giba (2026)
Yes, Giba, Sardinia, Italy enforces high STR regulations. Obtaining a license and ensuring compliance is almost certainly required according to current 2026 STR laws. Always verify the latest short term rental regulations and Airbnb license requirements directly with local government authorities for Giba to ensure full compliance before hosting.
(Source: AirROI data, 2026, based on 74% licensed listings)
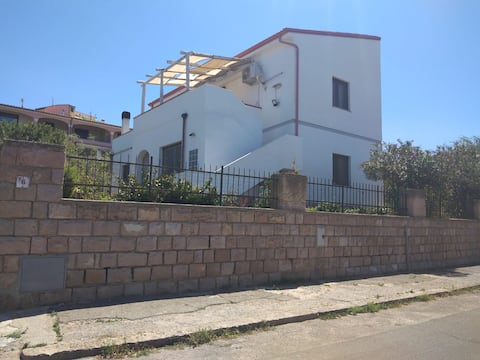
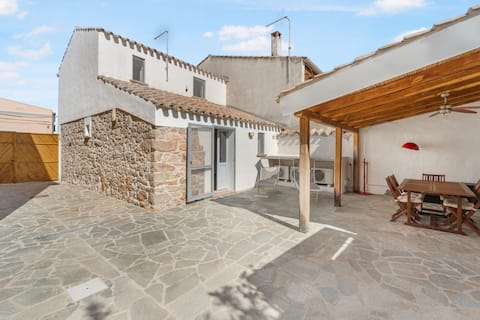
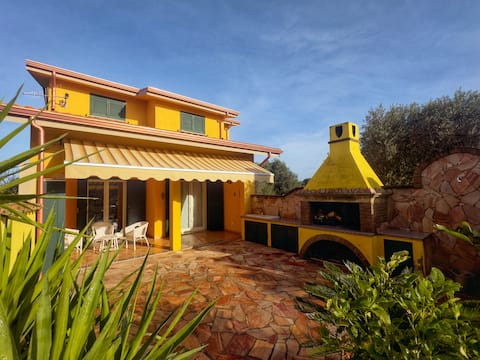
Top Performing Airbnb Properties in Giba (2026)
Benchmark your potential! Explore examples of top-performing Airbnb properties in Gibabased on Trailing Twelve Month (TTM) revenue. Analyze their characteristics, revenue, occupancy rate, and ADR to understand what drives success in this market.

Sea views & magical sunsets.
Entire Place • 2 bedrooms
Claudia & Giulia's Terrace
Entire Place • 2 bedrooms

Detached house with large garden (IUN: Q0063)
Entire Place • 2 bedrooms
La Casetta
Entire Place • 2 bedrooms
Villetta Giba
Entire Place • 4 bedrooms
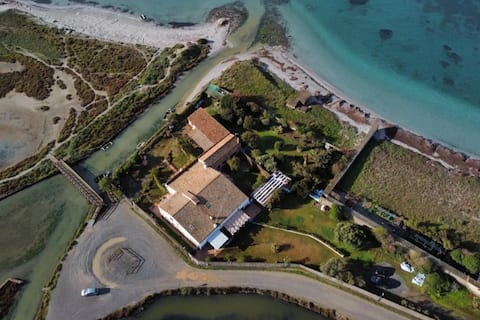
"Antica Peschiera" Holiday Home
Entire Place • 3 bedrooms
Note: Performance varies based on location, size, amenities, seasonality, and management quality. Data reflects the past 12 months.
Top Performing Airbnb Hosts in Giba (2026)
Learn from the best! This table showcases top-performing Airbnb hosts in Giba based on the number of properties managed and estimated total revenue over the past year. Analyze their scale and performance metrics.
| Host Name | Properties | Grossing Revenue | Stay Reviews | Avg Rating |
|---|---|---|---|---|
| Giancarlo | 1 | $17,749 | 164 | 4.90/5.0 |
| Rosalba | 1 | $13,471 | 20 | 5.00/5.0 |
| Luciano E Danila | 1 | $12,860 | 37 | 4.97/5.0 |
| Holidu | 1 | $12,784 | 8 | 5.00/5.0 |
| Stefano | 1 | $10,017 | 1 | Not Rated |
| Martina | 1 | $8,124 | 8 | 4.50/5.0 |
| Francesca | 1 | $5,837 | 82 | 4.89/5.0 |
| Maria Grazia | 1 | $5,335 | 1 | Not Rated |
| Edoardo | 1 | $4,418 | 8 | 4.88/5.0 |
| Cinzia | 1 | $4,264 | 36 | 4.89/5.0 |
Analyzing the strategies of top hosts, such as their property selection, pricing, and guest communication, can offer valuable lessons for optimizing your own Airbnb operations in Giba.
Dive Deeper: Advanced Giba STR Market Data (2026)
Ready to unlock more insights? AirROI provides access to advanced metrics and comprehensive Airbnb data for Giba. Explore detailed analytics beyond this report to refine your investment strategy, optimize pricing, and maximize your vacation rental profits.
Explore Advanced MetricsGiba Short-Term Rental Market Composition (2026): Property & Room Types
Room Type Distribution
Property Type Distribution
Market Composition Insights for Giba
- The Giba Airbnb market composition is heavily skewed towards Entire Home/Apt listings, which make up 100% of the 19 active rentals. This indicates strong guest preference for privacy and space.
- Looking at the property type distribution in Giba, House properties are the most common (52.6%), reflecting the local real estate landscape.
- Houses represent a significant 52.6% portion, catering likely to families or larger groups.
- The presence of 5.3% Hotel/Boutique listings indicates integration with traditional hospitality.
Giba Airbnb Room Capacity Analysis (2026): Bedroom Distribution
Distribution of Listings by Number of Bedrooms
Room Capacity Insights for Giba
- The dominant room capacity in Giba is 2 bedrooms listings, making up 57.9% of the market. This suggests a strong demand for properties suitable for couples or solo travelers.
- Together, 2 bedrooms and 1 bedroom properties represent 84.2% of the active Airbnb listings in Giba, indicating a high concentration in these sizes.
Giba Vacation Rental Guest Capacity Trends (2026)
Distribution of Listings by Guest Capacity
Guest Capacity Insights for Giba
- The most common guest capacity trend in Giba vacation rentals is listings accommodating 4 guests (36.8%). This suggests the primary traveler segment is likely small families or groups.
- Properties designed for 4 guests and 6 guests dominate the Giba STR market, accounting for 52.6% of listings.
- 31.6% of properties accommodate 6+ guests, serving the market segment for larger families or group travel in Giba.
- On average, properties in Giba are equipped to host 4.8 guests.
Giba Airbnb Booking Patterns (2026): Available vs. Booked Days
Available Days Distribution
Booked Days Distribution
Booking Pattern Insights for Giba
- The most common availability pattern in Giba falls within the 271-366 days range, representing 89.5% of listings. This suggests many properties have significant open periods on their calendars.
- Approximately 100.0% of listings show high availability (181+ days open annually), indicating potential for increased bookings or specific owner usage patterns.
- For booked days, the 1-30 days range is most frequent in Giba (63.2%), reflecting common guest stay durations or potential owner blocking patterns.
Giba Airbnb Minimum Stay Requirements Analysis
Distribution of Listings by Minimum Night Requirement
1 Night
2 listings
10.5% of total
2 Nights
3 listings
15.8% of total
4-6 Nights
7 listings
36.8% of total
7-29 Nights
1 listings
5.3% of total
30+ Nights
6 listings
31.6% of total
Key Insights
- The most prevalent minimum stay requirement in Giba is 4-6 Nights, adopted by 36.8% of listings. This highlights the market's preference for longer commitments.
- A significant segment (31.6%) caters to monthly stays (30+ nights) in Giba, pointing to opportunities in the extended-stay market.
Recommendations
- Align with the market by considering a 4-6 Nights minimum stay, as 36.8% of Giba hosts use this setting.
- If feasible, allowing 1-night stays, especially midweek or during low season, could capture last-minute bookings, as only 10.5% currently do.
- Explore offering discounts for stays of 30+ nights to attract the 31.6% of the market seeking extended stays.
- Adjust minimum nights based on seasonality – potentially shorter during low season and longer during peak demand periods in Giba.
Giba Airbnb Cancellation Policy Trends Analysis (2026)
Super Strict 30 Days
1 listings
5.3% of total
Flexible
3 listings
15.8% of total
Moderate
8 listings
42.1% of total
Firm
3 listings
15.8% of total
Strict
4 listings
21.1% of total
Cancellation Policy Insights for Giba
- The prevailing Airbnb cancellation policy trend in Giba is Moderate, used by 42.1% of listings.
- There's a relatively balanced mix between guest-friendly (57.9%) and stricter (36.9%) policies, offering choices for different guest needs.
Recommendations for Hosts
- Consider adopting a Moderate policy to align with the 42.1% market standard in Giba.
- Regularly review your cancellation policy against competitors and market demand shifts in Giba.
Giba STR Booking Lead Time Analysis (2026)
Average Booking Lead Time by Month
Booking Lead Time Insights for Giba
- The overall average booking lead time for vacation rentals in Giba is 50 days.
- Guests book furthest in advance for stays during March (average 139 days), likely coinciding with peak travel demand or local events.
- The shortest booking windows occur for stays in December (average 1 days), indicating more last-minute travel plans during this time.
- Seasonally, Spring (78 days avg.) sees the longest lead times, while Winter (6 days avg.) has the shortest, reflecting typical travel planning cycles.
Recommendations for Hosts
- Use the overall average lead time (50 days) as a baseline for your pricing and availability strategy in Giba.
- For March stays, consider implementing length-of-stay discounts or slightly higher rates for bookings made less than 139 days out to capitalize on advance planning.
- During December, focus on last-minute booking availability and promotions, as guests book with very short notice (1 days avg.).
- Target marketing efforts for the Spring season well in advance (at least 78 days) to capture early planners.
- Monitor your own booking lead times against these Giba averages to identify opportunities for dynamic pricing adjustments.
Popular & Essential Airbnb Amenities in Giba (2026)
Amenity Prevalence
Amenity Insights for Giba
- Essential amenities in Giba that guests expect include: Kitchen, Washer. Lacking these (any) could significantly impact bookings.
- Popular amenities like Free parking on premises, Refrigerator, Hangers are common but not universal. Offering these can provide a competitive edge.
Recommendations for Hosts
- Ensure your listing includes all essential amenities for Giba: Kitchen, Washer.
- Consider adding popular differentiators like Free parking on premises or Refrigerator to increase appeal.
- Highlight unique or less common amenities you offer (e.g., hot tub, dedicated workspace, EV charger) in your listing description and photos.
- Regularly check competitor amenities in Giba to stay competitive.
Giba Airbnb Guest Demographics & Profile Analysis (2026)
Guest Profile Summary for Giba
- The typical guest profile for Airbnb in Giba consists of predominantly international visitors (79%), with top international origins including Germany, typically belonging to the Post-2000s (Gen Z/Alpha) group (50%), primarily speaking English or German.
- Domestic travelers account for 21.4% of guests.
- Key international markets include France (31%) and Germany (26.2%).
- Top languages spoken are English (34%) followed by German (20.8%).
- A significant demographic segment is the Post-2000s (Gen Z/Alpha) group, representing 50% of guests.
Recommendations for Hosts
- Focus marketing internationally, particularly towards travelers from Germany.
- Tailor amenities and listing descriptions to appeal to the dominant Post-2000s (Gen Z/Alpha) demographic (e.g., highlight fast WiFi, smart home features, local guides).
- Highlight unique local experiences or amenities relevant to the primary guest profile.
- Consider seasonal promotions aligned with peak travel times for key origin markets.
Nearby Short-Term Rental Market Comparison
How does the Giba Airbnb market stack up against its neighbors? Compare key performance metrics like average monthly revenue, ADR, and occupancy rates in surrounding areas to understand the broader regional STR landscape.
| Market | Active Properties | Monthly Revenue | Daily Rate | Avg. Occupancy |
|---|---|---|---|---|
| Maracalagonis | 268 | $2,396 | $338.45 | 43% |
| Torre Delle Stelle (Maracalagonis) | 18 | $2,082 | $416.40 | 42% |
| Pittulongu | 22 | $2,036 | $399.40 | 45% |
| Sarrocu/Sarroch | 89 | $1,968 | $239.26 | 43% |
| Golfo Aranci | 36 | $1,963 | $362.29 | 46% |
| Castiadas | 188 | $1,953 | $263.12 | 42% |
| Santa Margherita di Pula | 28 | $1,860 | $393.54 | 46% |
| Santu Diadòru/San Teodoro | 880 | $1,815 | $286.96 | 43% |
| La Caletta | 13 | $1,801 | $176.59 | 50% |
| Figari/Golfo Aranci | 383 | $1,651 | $286.39 | 39% |