Pula Airbnb Market Analysis 2026: Short Term Rental Data & Vacation Rental Statistics in Sardinia, Italy
Is Airbnb profitable in Pula in 2026? Explore comprehensive Airbnb analytics for Pula, Sardinia, Italy to uncover income potential. This 2026 STR market report for Pula, based on AirROI data from February 2025 to January 2026, reveals key trends in the market of 589 active listings.
Whether you're considering an Airbnb investment in Pula, optimizing your existing vacation rental, or exploring rental arbitrage opportunities, understanding the Pula Airbnb data is crucial. Navigating the high regulation landscape is key to maximizing your short term rental income potential. Let's dive into the specifics.
Key Pula Airbnb Performance Metrics Overview
Monthly Airbnb Revenue Variations & Income Potential in Pula (2026)
Understanding the monthly revenue variations for Airbnb listings in Pula is key to maximizing your short term rental income potential. Seasonality significantly impacts earnings. Our analysis, based on data from the past 12 months, shows that the peak revenue month for STRs in Pula is typically August, while February often presents the lowest earnings, highlighting opportunities for strategic pricing adjustments during shoulder and low seasons. Explore the typical Airbnb income in Pula across different performance tiers:
- Best-in-class properties (Top 10%) achieve $5,364+ monthly, often utilizing dynamic pricing and superior guest experiences.
- Strong performing properties (Top 25%) earn $3,001 or more, indicating effective management and desirable locations/amenities.
- Typical properties (Median) generate around $1,651 per month, representing the average market performance.
- Entry-level properties (Bottom 25%) see earnings around $861, often with potential for optimization.
Average Monthly Airbnb Earnings Trend in Pula
Pula Airbnb Occupancy Rate Trends (2026)
Maximize your bookings by understanding the Pula STR occupancy trends. Seasonal demand shifts significantly influence how often properties are booked. Typically, Augustsees the highest demand (peak season occupancy), while January experiences the lowest (low season). Effective strategies, like adjusting minimum stays or offering promotions, can boost occupancy during slower periods. Here's how different property tiers perform in Pula:
- Best-in-class properties (Top 10%) achieve 70%+ occupancy, indicating high desirability and potentially optimized availability.
- Strong performing properties (Top 25%) maintain 52% or higher occupancy, suggesting good market fit and guest satisfaction.
- Typical properties (Median) have an occupancy rate around 32%.
- Entry-level properties (Bottom 25%) average 16% occupancy, potentially facing higher vacancy.
Average Monthly Occupancy Rate Trend in Pula
Average Daily Rate (ADR) Airbnb Trends in Pula (2026)
Effective short term rental pricing strategy in Pula involves understanding monthly ADR fluctuations. The Average Daily Rate (ADR) for Airbnb in Pula typically peaks in August and dips lowest during April. Leveraging Airbnb dynamic pricing tools or strategies based on this seasonality can significantly boost revenue. Here's a look at the typical nightly rates achieved:
- Best-in-class properties (Top 10%) command rates of $409+ per night, often due to premium features or locations.
- Strong performing properties (Top 25%) achieve nightly rates of $254 or more.
- Typical properties (Median) charge around $157 per night.
- Entry-level properties (Bottom 25%) earn around $114 per night.
Average Daily Rate (ADR) Trend by Month in Pula
Get Live Pula Market Intelligence 👇

Explore Real-time Analytics
Airbnb Seasonality Analysis & Trends in Pula (2026)
Peak Season (August, July, September)
- Revenue averages $4,456 per month
- Occupancy rates average 57.6%
- Daily rates average $257
Shoulder Season
- Revenue averages $2,226 per month
- Occupancy maintains around 33.6%
- Daily rates hold near $221
Low Season (January, February, December)
- Revenue drops to average $928 per month
- Occupancy decreases to average 16.9%
- Daily rates adjust to average $235
Seasonality Insights for Pula
- The Airbnb seasonality in Pula shows highly seasonal trends requiring careful strategy. While the sections above show seasonal averages, it's also insightful to look at the extremes:
- During the high season, the absolute peak month showcases Pula's highest earning potential, with monthly revenues capable of climbing to $5,536, occupancy reaching a high of 66.3%, and ADRs peaking at $267.
- Conversely, the slowest single month of the year, typically falling within the low season, marks the market's lowest point. In this month, revenue might dip to $838, occupancy could drop to 14.8%, and ADRs may adjust down to $211.
- Understanding both the seasonal averages and these monthly peaks and troughs in revenue, occupancy, and ADR is crucial for maximizing your Airbnb profit potential in Pula.
Seasonal Strategies for Maximizing Profit
- Peak Season: Maximize revenue through premium pricing and potentially longer minimum stays. Ensure high availability.
- Low Season: Offer competitive pricing, special promotions (e.g., extended stay discounts), and flexible cancellation policies. Target off-season travelers like remote workers or budget-conscious guests.
- Shoulder Seasons: Implement dynamic pricing that balances peak and low rates. Target weekend travelers or specific events. Offer slightly more flexible terms than peak season.
- Regularly analyze your own performance against these Pula seasonality benchmarks and adjust your pricing and availability strategy accordingly.
Best Areas for Airbnb Investment in Pula (2026)
Exploring the top neighborhoods for short-term rentals in Pula? This section highlights key areas, outlining why they are attractive for hosts and guests, along with notable local attractions. Consider these locations based on your target guest profile and investment strategy.
| Neighborhood / Area | Why Host Here? (Target Guests & Appeal) | Key Attractions & Landmarks |
|---|---|---|
| City Center | The heart of Pula, where tourists can find historical sites, restaurants, and shops. Ideal for those who want to explore the local culture and history. | Pula Arena, Roman Theatre, Pula Fortress, The Temple of Augustus, Pula's Market, local cafes and shops |
| Nora | An ancient ruins site that attracts history enthusiasts. Close to beautiful beaches, making it a perfect spot for those wanting both history and relaxation. | Nora Archaeological Site, Church of Sant'Efisio, beaches of Baia di Nora, local seafood restaurants |
| Banje Beach | Known for its stunning seafront and beach venues. Popular with families and younger travelers looking for sun, sand, and sea activities. | Banje Beach, water sports facilities, beach clubs, scenic coastal walks |
| Sabitova | A tranquil neighborhood close to nature parks and hiking trails. Great for tourists who enjoy outdoor activities and want to escape the bustle. | Šuminac Nature Park, hiking trails, picnic areas, local wildlife |
| Sukosan | Charming village known for its quiet beaches and proximity to Pula. Attracts visitors looking for a relaxing getaway. | Sukosan Beach, marina, café bars along the coast |
| Put za Križ | This area is renowned for its lovely seaside views and access to Pula's coastal charm. Great for travelers who enjoy seaside strolls and sunsets. | seaside promenades, restaurant views, local fish markets |
| Pula's Old Town | Historic area with cobblestone streets, known for its architecture and lively atmosphere. A favorite for cultural travelers. | Historical museums, Pula Cathedral, market squares, local artisans |
| Galvani Street | A popular area with trendy cafes and shops, attracting a younger, urban demographic. Perfect for visitors who want to experience local life. | boutique shops, art galleries, café culture |
Understanding Airbnb License Requirements & STR Laws in Pula (2026)
Yes, Pula, Sardinia, Italy enforces high STR regulations. Obtaining a license and ensuring compliance is almost certainly required according to current 2026 STR laws. Always verify the latest short term rental regulations and Airbnb license requirements directly with local government authorities for Pula to ensure full compliance before hosting.
(Source: AirROI data, 2026, based on 88% licensed listings)
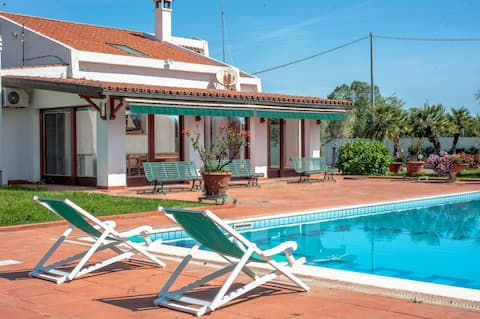
Top Performing Airbnb Properties in Pula (2026)
Benchmark your potential! Explore examples of top-performing Airbnb properties in Pulabased on Trailing Twelve Month (TTM) revenue. Analyze their characteristics, revenue, occupancy rate, and ADR to understand what drives success in this market.
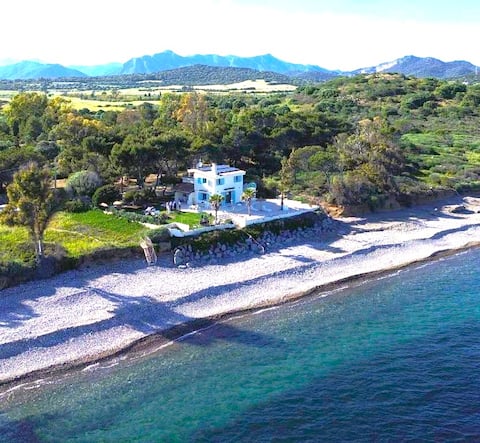
Villa Azurella - Heaven is here
Entire Place • 4 bedrooms
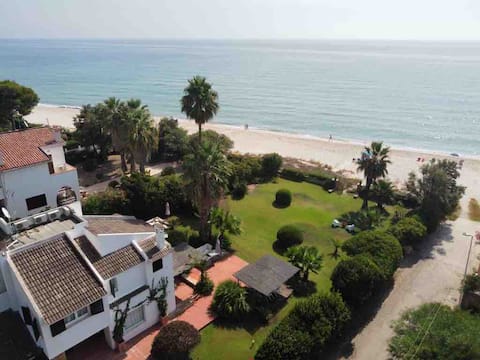
Villa Nettuno - Beachfront - Perla Marina - Pula
Entire Place • 4 bedrooms
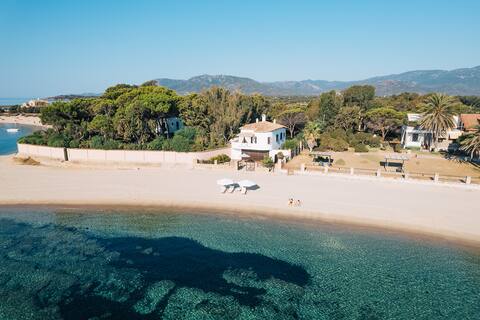
Su Faru 1 "Nora Beach" Villa - Sardinia
Entire Place • 4 bedrooms

Beachside Villa - 4BR/4BA - Garden, Gym, Wi-Fi, AC
Entire Place • 4 bedrooms
Villa Sole Pula
Entire Place • 4 bedrooms

Oasi Colombina, Private Pool
Entire Place • 3 bedrooms
Note: Performance varies based on location, size, amenities, seasonality, and management quality. Data reflects the past 12 months.
Top Performing Airbnb Hosts in Pula (2026)
Learn from the best! This table showcases top-performing Airbnb hosts in Pula based on the number of properties managed and estimated total revenue over the past year. Analyze their scale and performance metrics.
| Host Name | Properties | Grossing Revenue | Stay Reviews | Avg Rating |
|---|---|---|---|---|
| Estay | 33 | $652,626 | 251 | 4.37/5.0 |
| Stefano | 10 | $431,867 | 218 | 4.91/5.0 |
| Kristina | 17 | $270,045 | 408 | 4.52/5.0 |
| Aldo | 7 | $263,631 | 46 | 4.95/5.0 |
| Nicola | 5 | $240,394 | 90 | 4.62/5.0 |
| Sabrina | 5 | $171,037 | 86 | 4.94/5.0 |
| Santandrea | 5 | $168,062 | 22 | 4.92/5.0 |
| Aldo | 2 | $160,700 | 98 | 4.97/5.0 |
| Tommaso | 2 | $148,566 | 92 | 4.99/5.0 |
| Anakena Srls | 1 | $130,983 | 37 | 4.97/5.0 |
Analyzing the strategies of top hosts, such as their property selection, pricing, and guest communication, can offer valuable lessons for optimizing your own Airbnb operations in Pula.
Dive Deeper: Advanced Pula STR Market Data (2026)
Ready to unlock more insights? AirROI provides access to advanced metrics and comprehensive Airbnb data for Pula. Explore detailed analytics beyond this report to refine your investment strategy, optimize pricing, and maximize your vacation rental profits.
Explore Advanced MetricsPula Short-Term Rental Market Composition (2026): Property & Room Types
Room Type Distribution
Property Type Distribution
Market Composition Insights for Pula
- The Pula Airbnb market composition is heavily skewed towards Entire Home/Apt listings, which make up 94.9% of the 589 active rentals. This indicates strong guest preference for privacy and space.
- Looking at the property type distribution in Pula, House properties are the most common (66.9%), reflecting the local real estate landscape.
- Houses represent a significant 66.9% portion, catering likely to families or larger groups.
- Smaller segments like hotel/boutique, others, outdoor/unique (combined 2.4%) offer potential for unique stay experiences.
Pula Airbnb Room Capacity Analysis (2026): Bedroom Distribution
Distribution of Listings by Number of Bedrooms
Room Capacity Insights for Pula
- The dominant room capacity in Pula is 2 bedrooms listings, making up 39.6% of the market. This suggests a strong demand for properties suitable for couples or solo travelers.
- Together, 2 bedrooms and 3 bedrooms properties represent 61.3% of the active Airbnb listings in Pula, indicating a high concentration in these sizes.
- A significant 35.5% of listings offer 3+ bedrooms, catering to larger groups and families seeking more space in Pula.
Pula Vacation Rental Guest Capacity Trends (2026)
Distribution of Listings by Guest Capacity
Guest Capacity Insights for Pula
- The most common guest capacity trend in Pula vacation rentals is listings accommodating 4 guests (31.9%). This suggests the primary traveler segment is likely small families or groups.
- Properties designed for 4 guests and 6 guests dominate the Pula STR market, accounting for 52.3% of listings.
- 37.6% of properties accommodate 6+ guests, serving the market segment for larger families or group travel in Pula.
- On average, properties in Pula are equipped to host 4.8 guests.
Pula Airbnb Booking Patterns (2026): Available vs. Booked Days
Available Days Distribution
Booked Days Distribution
Booking Pattern Insights for Pula
- The most common availability pattern in Pula falls within the 271-366 days range, representing 65% of listings. This suggests many properties have significant open periods on their calendars.
- Approximately 95.1% of listings show high availability (181+ days open annually), indicating potential for increased bookings or specific owner usage patterns.
- For booked days, the 31-90 days range is most frequent in Pula (36.7%), reflecting common guest stay durations or potential owner blocking patterns.
- A notable 5.6% of properties secure long booking periods (181+ days booked per year), highlighting successful long-term rental strategies or significant owner usage.
Pula Airbnb Minimum Stay Requirements Analysis
Distribution of Listings by Minimum Night Requirement
1 Night
23 listings
3.9% of total
2 Nights
20 listings
3.4% of total
3 Nights
41 listings
7% of total
4-6 Nights
207 listings
35.1% of total
7-29 Nights
66 listings
11.2% of total
30+ Nights
232 listings
39.4% of total
Key Insights
- The most prevalent minimum stay requirement in Pula is 30+ Nights, adopted by 39.4% of listings. This highlights the market's preference for longer commitments.
- Very short stays (1-2 nights) are less common (7.3%), suggesting hosts prefer slightly longer bookings to optimize turnover.
- A significant segment (39.4%) caters to monthly stays (30+ nights) in Pula, pointing to opportunities in the extended-stay market.
Recommendations
- Align with the market by considering a 30+ Nights minimum stay, as 39.4% of Pula hosts use this setting.
- If feasible, allowing 1-night stays, especially midweek or during low season, could capture last-minute bookings, as only 3.9% currently do.
- Explore offering discounts for stays of 30+ nights to attract the 39.4% of the market seeking extended stays.
- Adjust minimum nights based on seasonality – potentially shorter during low season and longer during peak demand periods in Pula.
Pula Airbnb Cancellation Policy Trends Analysis (2026)
Super Strict 30 Days
10 listings
1.7% of total
Super Strict 60 Days
8 listings
1.4% of total
Limited
18 listings
3.1% of total
Flexible
65 listings
11.1% of total
Moderate
233 listings
39.8% of total
Firm
186 listings
31.7% of total
Strict
66 listings
11.3% of total
Cancellation Policy Insights for Pula
- The prevailing Airbnb cancellation policy trend in Pula is Moderate, used by 39.8% of listings.
- There's a relatively balanced mix between guest-friendly (50.9%) and stricter (43.0%) policies, offering choices for different guest needs.
Recommendations for Hosts
- Consider adopting a Moderate policy to align with the 39.8% market standard in Pula.
- Using a Strict policy might deter some guests, as only 11.3% of listings use it. Evaluate if potential revenue protection outweighs possible lower booking rates.
- Regularly review your cancellation policy against competitors and market demand shifts in Pula.
Pula STR Booking Lead Time Analysis (2026)
Average Booking Lead Time by Month
Booking Lead Time Insights for Pula
- The overall average booking lead time for vacation rentals in Pula is 70 days.
- Guests book furthest in advance for stays during August (average 117 days), likely coinciding with peak travel demand or local events.
- The shortest booking windows occur for stays in January (average 20 days), indicating more last-minute travel plans during this time.
- Seasonally, Summer (94 days avg.) sees the longest lead times, while Winter (28 days avg.) has the shortest, reflecting typical travel planning cycles.
Recommendations for Hosts
- Use the overall average lead time (70 days) as a baseline for your pricing and availability strategy in Pula.
- For August stays, consider implementing length-of-stay discounts or slightly higher rates for bookings made less than 117 days out to capitalize on advance planning.
- Target marketing efforts for the Summer season well in advance (at least 94 days) to capture early planners.
- Monitor your own booking lead times against these Pula averages to identify opportunities for dynamic pricing adjustments.
Popular & Essential Airbnb Amenities in Pula (2026)
Amenity Prevalence
Amenity Insights for Pula
- Popular amenities like Air conditioning, Kitchen, TV are common but not universal. Offering these can provide a competitive edge.
Recommendations for Hosts
- Consider adding popular differentiators like Air conditioning or Kitchen to increase appeal.
- Highlight unique or less common amenities you offer (e.g., hot tub, dedicated workspace, EV charger) in your listing description and photos.
- Regularly check competitor amenities in Pula to stay competitive.
Pula Airbnb Guest Demographics & Profile Analysis (2026)
Guest Profile Summary for Pula
- The typical guest profile for Airbnb in Pula consists of predominantly international visitors (79%), with top international origins including Germany, typically belonging to the Post-2000s (Gen Z/Alpha) group (50%), primarily speaking English or German.
- Domestic travelers account for 20.9% of guests.
- Key international markets include Italy (20.9%) and Germany (19.5%).
- Top languages spoken are English (36.7%) followed by German (16%).
- A significant demographic segment is the Post-2000s (Gen Z/Alpha) group, representing 50% of guests.
Recommendations for Hosts
- Focus marketing internationally, particularly towards travelers from Germany.
- Tailor amenities and listing descriptions to appeal to the dominant Post-2000s (Gen Z/Alpha) demographic (e.g., highlight fast WiFi, smart home features, local guides).
- Highlight unique local experiences or amenities relevant to the primary guest profile.
- Consider seasonal promotions aligned with peak travel times for key origin markets.
Nearby Short-Term Rental Market Comparison
How does the Pula Airbnb market stack up against its neighbors? Compare key performance metrics like average monthly revenue, ADR, and occupancy rates in surrounding areas to understand the broader regional STR landscape.
| Market | Active Properties | Monthly Revenue | Daily Rate | Avg. Occupancy |
|---|---|---|---|---|
| Maracalagonis | 268 | $2,396 | $338.45 | 43% |
| Torre Delle Stelle (Maracalagonis) | 18 | $2,082 | $416.40 | 42% |
| Sarrocu/Sarroch | 89 | $1,968 | $239.26 | 43% |
| Castiadas | 188 | $1,953 | $263.12 | 42% |
| Santa Margherita di Pula | 28 | $1,860 | $393.54 | 46% |
| Sìnnia/Sinnai | 175 | $1,631 | $223.93 | 43% |
| Costa Rei | 40 | $1,612 | $225.69 | 52% |
| Solanas | 10 | $1,605 | $268.25 | 54% |
| Domus De Maria | 279 | $1,451 | $227.68 | 43% |
| Murera/Muravera | 491 | $1,422 | $203.68 | 42% |