Canicattini Bagni Airbnb Market Analysis 2026: Short Term Rental Data & Vacation Rental Statistics in Sicily, Italy
Is Airbnb profitable in Canicattini Bagni in 2026? Explore comprehensive Airbnb analytics for Canicattini Bagni, Sicily, Italy to uncover income potential. This 2026 STR market report for Canicattini Bagni, based on AirROI data from July 2024 to June 2025, reveals key trends in the niche market of 18 active listings.
Whether you're considering an Airbnb investment in Canicattini Bagni, optimizing your existing vacation rental, or exploring rental arbitrage opportunities, understanding the Canicattini Bagni Airbnb data is crucial. Leveraging the low regulation environment is key to maximizing your short term rental income potential. Let's dive into the specifics.
Key Canicattini Bagni Airbnb Performance Metrics Overview
Monthly Airbnb Revenue Variations & Income Potential in Canicattini Bagni (2026)
Understanding the monthly revenue variations for Airbnb listings in Canicattini Bagni is key to maximizing your short term rental income potential. Seasonality significantly impacts earnings. Our analysis, based on data from the past 12 months, shows that the peak revenue month for STRs in Canicattini Bagni is typically August, while January often presents the lowest earnings, highlighting opportunities for strategic pricing adjustments during shoulder and low seasons. Explore the typical Airbnb income in Canicattini Bagni across different performance tiers:
- Best-in-class properties (Top 10%) achieve $2,926+ monthly, often utilizing dynamic pricing and superior guest experiences.
- Strong performing properties (Top 25%) earn $1,366 or more, indicating effective management and desirable locations/amenities.
- Typical properties (Median) generate around $621 per month, representing the average market performance.
- Entry-level properties (Bottom 25%) see earnings around $345, often with potential for optimization.
Average Monthly Airbnb Earnings Trend in Canicattini Bagni
Canicattini Bagni Airbnb Occupancy Rate Trends (2026)
Maximize your bookings by understanding the Canicattini Bagni STR occupancy trends. Seasonal demand shifts significantly influence how often properties are booked. Typically, Augustsees the highest demand (peak season occupancy), while February experiences the lowest (low season). Effective strategies, like adjusting minimum stays or offering promotions, can boost occupancy during slower periods. Here's how different property tiers perform in Canicattini Bagni:
- Best-in-class properties (Top 10%) achieve 64%+ occupancy, indicating high desirability and potentially optimized availability.
- Strong performing properties (Top 25%) maintain 41% or higher occupancy, suggesting good market fit and guest satisfaction.
- Typical properties (Median) have an occupancy rate around 28%.
- Entry-level properties (Bottom 25%) average 19% occupancy, potentially facing higher vacancy.
Average Monthly Occupancy Rate Trend in Canicattini Bagni
Average Daily Rate (ADR) Airbnb Trends in Canicattini Bagni (2026)
Effective short term rental pricing strategy in Canicattini Bagni involves understanding monthly ADR fluctuations. The Average Daily Rate (ADR) for Airbnb in Canicattini Bagni typically peaks in December and dips lowest during April. Leveraging Airbnb dynamic pricing tools or strategies based on this seasonality can significantly boost revenue. Here's a look at the typical nightly rates achieved:
- Best-in-class properties (Top 10%) command rates of $337+ per night, often due to premium features or locations.
- Strong performing properties (Top 25%) achieve nightly rates of $119 or more.
- Typical properties (Median) charge around $79 per night.
- Entry-level properties (Bottom 25%) earn around $55 per night.
Average Daily Rate (ADR) Trend by Month in Canicattini Bagni
Get Live Canicattini Bagni Market Intelligence 👇

Explore Real-time Analytics
Airbnb Seasonality Analysis & Trends in Canicattini Bagni (2025)
Peak Season (August, July, October)
- Revenue averages $1,698 per month
- Occupancy rates average 46.3%
- Daily rates average $147
Shoulder Season
- Revenue averages $975 per month
- Occupancy maintains around 29.8%
- Daily rates hold near $126
Low Season (January, April, December)
- Revenue drops to average $702 per month
- Occupancy decreases to average 25.4%
- Daily rates adjust to average $135
Seasonality Insights for Canicattini Bagni
- The Airbnb seasonality in Canicattini Bagni shows highly seasonal trends requiring careful strategy. While the sections above show seasonal averages, it's also insightful to look at the extremes:
- During the high season, the absolute peak month showcases Canicattini Bagni's highest earning potential, with monthly revenues capable of climbing to $2,324, occupancy reaching a high of 67.3%, and ADRs peaking at $148.
- Conversely, the slowest single month of the year, typically falling within the low season, marks the market's lowest point. In this month, revenue might dip to $626, occupancy could drop to 20.7%, and ADRs may adjust down to $113.
- Understanding both the seasonal averages and these monthly peaks and troughs in revenue, occupancy, and ADR is crucial for maximizing your Airbnb profit potential in Canicattini Bagni.
Seasonal Strategies for Maximizing Profit
- Peak Season: Maximize revenue through premium pricing and potentially longer minimum stays. Ensure high availability.
- Low Season: Offer competitive pricing, special promotions (e.g., extended stay discounts), and flexible cancellation policies. Target off-season travelers like remote workers or budget-conscious guests.
- Shoulder Seasons: Implement dynamic pricing that balances peak and low rates. Target weekend travelers or specific events. Offer slightly more flexible terms than peak season.
- Regularly analyze your own performance against these Canicattini Bagni seasonality benchmarks and adjust your pricing and availability strategy accordingly.
Best Areas for Airbnb Investment in Canicattini Bagni (2026)
Exploring the top neighborhoods for short-term rentals in Canicattini Bagni? This section highlights key areas, outlining why they are attractive for hosts and guests, along with notable local attractions. Consider these locations based on your target guest profile and investment strategy.
| Neighborhood / Area | Why Host Here? (Target Guests & Appeal) | Key Attractions & Landmarks |
|---|---|---|
| Centro Storico | The historic center of Canicattini Bagni, rich in culture and history, attracting visitors who want to experience the local heritage and cuisine. | Chiesa Madre di San Michele, Museo del Ferro, Piazza Giovanni XXIII |
| Parco dei Nebrodi | A beautiful natural park area nearby, known for its stunning landscapes and outdoor activities, ideal for nature lovers and adventure seekers. | Hiking trails, Wildlife watching, Scenic viewpoints |
| Viale della Libertà | A major boulevard in Canicattini Bagni with restaurants, cafes, and shops, popular among locals and visitors for its vibrant atmosphere. | Local boutiques, Cafes and gelaterias, Outdoor markets |
| Castello di Canicattini | The castle offers historical significance and panoramic views, making it attractive for tourists interested in history and photography. | Historical castle site, Beautiful views of the town, Cultural events |
| Spiaggia di Fontane Bianche | A nearby beach known for its soft white sand and clear waters, perfect for summer tourism and beach-related activities. | Swimming, Water sports, Beach clubs |
| Ortigia | The nearby island of Ortigia is known for its baroque architecture and vibrant local market, drawing day-trippers and cultural tourists. | Piazza del Duomo, Local markets, Historic alleyways |
| Siracusa | Close to Siracusa, a famous archaeological site and historic city, attracting many visitors for its rich history and attractions. | Greek Theatre, Ear of Dionysius, Piazza Archimede |
| Nature Reserve Cavagrande del Cassibile | A stunning nature reserve known for its canyon and swimming spots, ideal for those looking to explore nature and hiking. | Canyon hikes, Swimming spots, Photography opportunities |
Understanding Airbnb License Requirements & STR Laws in Canicattini Bagni (2026)
While Canicattini Bagni, Sicily, Italy currently shows low STR regulations, specific Airbnb license requirements might still exist or change. Always verify the latest short term rental regulations and Airbnb license requirements directly with local government authorities for Canicattini Bagni to ensure full compliance before hosting.
(Source: AirROI data, 2026, finding no licensed listings among those analyzed)
Top Performing Airbnb Properties in Canicattini Bagni (2026)
Benchmark your potential! Explore examples of top-performing Airbnb properties in Canicattini Bagnibased on Trailing Twelve Month (TTM) revenue. Analyze their characteristics, revenue, occupancy rate, and ADR to understand what drives success in this market.
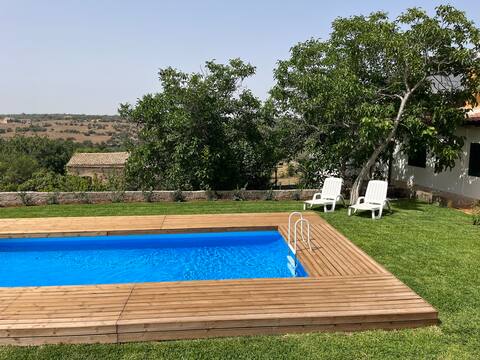
Villa con piscina privata tra Noto e Siracusa
Entire Place • 5 bedrooms

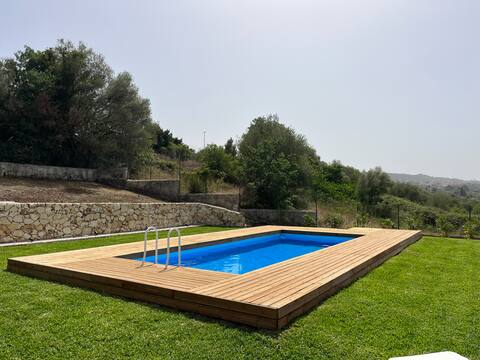
CASA LINA with 3 bedrooms and terrace
Entire Place • 3 bedrooms

Cas' i Lia
Entire Place • 1 bedroom
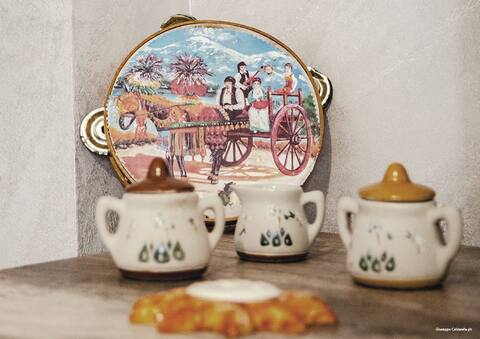
Casa delle Meridiane - House of Sundials
Private Room • N/A
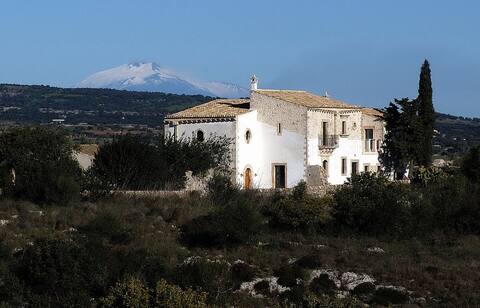
Villa con giardino tra Noto e Siracusa "Superior"
Entire Place • 3 bedrooms
Nonna Fortunata's House
Entire Place • 2 bedrooms
Note: Performance varies based on location, size, amenities, seasonality, and management quality. Data reflects the past 12 months.
Top Performing Airbnb Hosts in Canicattini Bagni (2026)
Learn from the best! This table showcases top-performing Airbnb hosts in Canicattini Bagni based on the number of properties managed and estimated total revenue over the past year. Analyze their scale and performance metrics.
| Host Name | Properties | Grossing Revenue | Stay Reviews | Avg Rating |
|---|---|---|---|---|
| Host #444935199 | 3 | $45,860 | 0 | Not Rated |
| Alessandra | 1 | $18,673 | 19 | 4.63/5.0 |
| Giuseppe | 1 | $17,628 | 98 | 4.93/5.0 |
| Andrea | 1 | $10,037 | 108 | 4.95/5.0 |
| Federica | 1 | $5,836 | 33 | 4.97/5.0 |
| Emanuele Antonio | 1 | $5,626 | 38 | 4.95/5.0 |
| Nicola | 1 | $5,084 | 32 | 5.00/5.0 |
| Sebastiano | 1 | $4,563 | 4 | 4.75/5.0 |
| Sara | 1 | $4,012 | 2 | Not Rated |
| Paolo | 1 | $3,743 | 1 | Not Rated |
Analyzing the strategies of top hosts, such as their property selection, pricing, and guest communication, can offer valuable lessons for optimizing your own Airbnb operations in Canicattini Bagni.
Dive Deeper: Advanced Canicattini Bagni STR Market Data (2026)
Ready to unlock more insights? AirROI provides access to advanced metrics and comprehensive Airbnb data for Canicattini Bagni. Explore detailed analytics beyond this report to refine your investment strategy, optimize pricing, and maximize your vacation rental profits.
Explore Advanced MetricsCanicattini Bagni Short-Term Rental Market Composition (2026): Property & Room Types
Room Type Distribution
Property Type Distribution
Market Composition Insights for Canicattini Bagni
- The Canicattini Bagni Airbnb market composition is heavily skewed towards Entire Home/Apt listings, which make up 88.9% of the 18 active rentals. This indicates strong guest preference for privacy and space.
- Looking at the property type distribution in Canicattini Bagni, House properties are the most common (72.2%), reflecting the local real estate landscape.
- Houses represent a significant 72.2% portion, catering likely to families or larger groups.
Canicattini Bagni Airbnb Room Capacity Analysis (2026): Bedroom Distribution
Distribution of Listings by Number of Bedrooms
Room Capacity Insights for Canicattini Bagni
- The dominant room capacity in Canicattini Bagni is 2 bedrooms listings, making up 44.4% of the market. This suggests a strong demand for properties suitable for couples or solo travelers.
- Together, 2 bedrooms and 1 bedroom properties represent 72.2% of the active Airbnb listings in Canicattini Bagni, indicating a high concentration in these sizes.
- A significant 22.3% of listings offer 3+ bedrooms, catering to larger groups and families seeking more space in Canicattini Bagni.
Canicattini Bagni Vacation Rental Guest Capacity Trends (2026)
Distribution of Listings by Guest Capacity
Guest Capacity Insights for Canicattini Bagni
- The most common guest capacity trend in Canicattini Bagni vacation rentals is listings accommodating 5 guests (44.4%). This suggests the primary traveler segment is likely larger groups.
- Properties designed for 5 guests and 4 guests dominate the Canicattini Bagni STR market, accounting for 72.2% of listings.
- 16.7% of properties accommodate 6+ guests, serving the market segment for larger families or group travel in Canicattini Bagni.
- On average, properties in Canicattini Bagni are equipped to host 4.7 guests.
Canicattini Bagni Airbnb Booking Patterns (2026): Available vs. Booked Days
Available Days Distribution
Booked Days Distribution
Booking Pattern Insights for Canicattini Bagni
- The most common availability pattern in Canicattini Bagni falls within the 271-366 days range, representing 66.7% of listings. This suggests many properties have significant open periods on their calendars.
- Approximately 100.0% of listings show high availability (181+ days open annually), indicating potential for increased bookings or specific owner usage patterns.
- For booked days, the 91-180 days range is most frequent in Canicattini Bagni (33.3%), reflecting common guest stay durations or potential owner blocking patterns.
Canicattini Bagni Airbnb Minimum Stay Requirements Analysis
Distribution of Listings by Minimum Night Requirement
1 Night
4 listings
26.7% of total
2 Nights
4 listings
26.7% of total
3 Nights
2 listings
13.3% of total
7-29 Nights
2 listings
13.3% of total
30+ Nights
3 listings
20% of total
Key Insights
- The most prevalent minimum stay requirement in Canicattini Bagni is 1 Night, adopted by 26.7% of listings. This highlights the market's preference for shorter, flexible bookings.
- A significant segment (20%) caters to monthly stays (30+ nights) in Canicattini Bagni, pointing to opportunities in the extended-stay market.
Recommendations
- Align with the market by considering a 1 Night minimum stay, as 26.7% of Canicattini Bagni hosts use this setting.
- If feasible, allowing 1-night stays, especially midweek or during low season, could capture last-minute bookings, as only 26.7% currently do.
- Explore offering discounts for stays of 30+ nights to attract the 20% of the market seeking extended stays.
- Adjust minimum nights based on seasonality – potentially shorter during low season and longer during peak demand periods in Canicattini Bagni.
Canicattini Bagni Airbnb Cancellation Policy Trends Analysis (2026)
Flexible
6 listings
42.9% of total
Moderate
4 listings
28.6% of total
Strict
4 listings
28.6% of total
Cancellation Policy Insights for Canicattini Bagni
- The prevailing Airbnb cancellation policy trend in Canicattini Bagni is Flexible, used by 42.9% of listings.
- The market strongly favors guest-friendly terms, with 71.5% of listings offering Flexible or Moderate policies. This suggests guests in Canicattini Bagni may expect booking flexibility.
Recommendations for Hosts
- Consider adopting a Flexible policy to align with the 42.9% market standard in Canicattini Bagni.
- Regularly review your cancellation policy against competitors and market demand shifts in Canicattini Bagni.
Canicattini Bagni STR Booking Lead Time Analysis (2026)
Average Booking Lead Time by Month
Booking Lead Time Insights for Canicattini Bagni
- The overall average booking lead time for vacation rentals in Canicattini Bagni is 30 days.
- Guests book furthest in advance for stays during May (average 55 days), likely coinciding with peak travel demand or local events.
- The shortest booking windows occur for stays in February (average 12 days), indicating more last-minute travel plans during this time.
- Seasonally, Fall (42 days avg.) sees the longest lead times, while Winter (17 days avg.) has the shortest, reflecting typical travel planning cycles.
Recommendations for Hosts
- Use the overall average lead time (30 days) as a baseline for your pricing and availability strategy in Canicattini Bagni.
- For May stays, consider implementing length-of-stay discounts or slightly higher rates for bookings made less than 55 days out to capitalize on advance planning.
- During February, focus on last-minute booking availability and promotions, as guests book with very short notice (12 days avg.).
- Target marketing efforts for the Fall season well in advance (at least 42 days) to capture early planners.
- Monitor your own booking lead times against these Canicattini Bagni averages to identify opportunities for dynamic pricing adjustments.
Popular & Essential Airbnb Amenities in Canicattini Bagni (2026)
Amenity data is currently unavailable for Canicattini Bagni.
Canicattini Bagni Airbnb Guest Demographics & Profile Analysis (2026)
Guest Profile Summary for Canicattini Bagni
- The typical guest profile for Airbnb in Canicattini Bagni consists of predominantly international visitors (83%), with top international origins including Italy, typically belonging to the Post-2000s (Gen Z/Alpha) group (50%), primarily speaking English or French.
- Domestic travelers account for 17.2% of guests.
- Key international markets include France (32.8%) and Italy (17.2%).
- Top languages spoken are English (32.4%) followed by French (15.7%).
- A significant demographic segment is the Post-2000s (Gen Z/Alpha) group, representing 50% of guests.
Recommendations for Hosts
- Focus marketing internationally, particularly towards travelers from Italy.
- Tailor amenities and listing descriptions to appeal to the dominant Post-2000s (Gen Z/Alpha) demographic (e.g., highlight fast WiFi, smart home features, local guides).
- Highlight unique local experiences or amenities relevant to the primary guest profile.
- Consider seasonal promotions aligned with peak travel times for key origin markets.
Nearby Short-Term Rental Market Comparison
How does the Canicattini Bagni Airbnb market stack up against its neighbors? Compare key performance metrics like average monthly revenue, ADR, and occupancy rates in surrounding areas to understand the broader regional STR landscape.
| Market | Active Properties | Monthly Revenue | Daily Rate | Avg. Occupancy |
|---|---|---|---|---|
| Taormina | 1,039 | $2,350 | $227.71 | 46% |
| Graniti | 20 | $2,250 | $168.62 | 48% |
| Għasri | 60 | $2,141 | $220.95 | 39% |
| Santa Venerina | 55 | $1,982 | $232.43 | 40% |
| Viagrande | 39 | $1,915 | $246.19 | 38% |
| San Marco d'Alunzio | 13 | $1,891 | $170.39 | 37% |
| Saint Lawrence | 33 | $1,865 | $219.92 | 37% |
| Castelmola | 58 | $1,785 | $198.27 | 46% |
| Torregrotta | 16 | $1,773 | $262.70 | 33% |
| Chiaramonte Gulfi | 37 | $1,669 | $294.30 | 36% |