Gaggi Airbnb Market Analysis 2026: Short Term Rental Data & Vacation Rental Statistics in Sicily, Italy
Is Airbnb profitable in Gaggi in 2026? Explore comprehensive Airbnb analytics for Gaggi, Sicily, Italy to uncover income potential. This 2026 STR market report for Gaggi, based on AirROI data from February 2025 to January 2026, reveals key trends in the niche market of 23 active listings.
Whether you're considering an Airbnb investment in Gaggi, optimizing your existing vacation rental, or exploring rental arbitrage opportunities, understanding the Gaggi Airbnb data is crucial. Navigating the high regulation landscape is key to maximizing your short term rental income potential. Let's dive into the specifics.
Key Gaggi Airbnb Performance Metrics Overview
Monthly Airbnb Revenue Variations & Income Potential in Gaggi (2026)
Understanding the monthly revenue variations for Airbnb listings in Gaggi is key to maximizing your short term rental income potential. Seasonality significantly impacts earnings. Our analysis, based on data from the past 12 months, shows that the peak revenue month for STRs in Gaggi is typically April, while February often presents the lowest earnings, highlighting opportunities for strategic pricing adjustments during shoulder and low seasons. Explore the typical Airbnb income in Gaggi across different performance tiers:
- Best-in-class properties (Top 10%) achieve $4,422+ monthly, often utilizing dynamic pricing and superior guest experiences.
- Strong performing properties (Top 25%) earn $2,116 or more, indicating effective management and desirable locations/amenities.
- Typical properties (Median) generate around $1,148 per month, representing the average market performance.
- Entry-level properties (Bottom 25%) see earnings around $806, often with potential for optimization.
Average Monthly Airbnb Earnings Trend in Gaggi
Gaggi Airbnb Occupancy Rate Trends (2026)
Maximize your bookings by understanding the Gaggi STR occupancy trends. Seasonal demand shifts significantly influence how often properties are booked. Typically, Augustsees the highest demand (peak season occupancy), while January experiences the lowest (low season). Effective strategies, like adjusting minimum stays or offering promotions, can boost occupancy during slower periods. Here's how different property tiers perform in Gaggi:
- Best-in-class properties (Top 10%) achieve 66%+ occupancy, indicating high desirability and potentially optimized availability.
- Strong performing properties (Top 25%) maintain 47% or higher occupancy, suggesting good market fit and guest satisfaction.
- Typical properties (Median) have an occupancy rate around 30%.
- Entry-level properties (Bottom 25%) average 14% occupancy, potentially facing higher vacancy.
Average Monthly Occupancy Rate Trend in Gaggi
Average Daily Rate (ADR) Airbnb Trends in Gaggi (2026)
Effective short term rental pricing strategy in Gaggi involves understanding monthly ADR fluctuations. The Average Daily Rate (ADR) for Airbnb in Gaggi typically peaks in July and dips lowest during October. Leveraging Airbnb dynamic pricing tools or strategies based on this seasonality can significantly boost revenue. Here's a look at the typical nightly rates achieved:
- Best-in-class properties (Top 10%) command rates of $490+ per night, often due to premium features or locations.
- Strong performing properties (Top 25%) achieve nightly rates of $286 or more.
- Typical properties (Median) charge around $128 per night.
- Entry-level properties (Bottom 25%) earn around $90 per night.
Average Daily Rate (ADR) Trend by Month in Gaggi
Get Live Gaggi Market Intelligence 👇

Explore Real-time Analytics
Airbnb Seasonality Analysis & Trends in Gaggi (2026)
Peak Season (April, June, July)
- Revenue averages $2,611 per month
- Occupancy rates average 45.2%
- Daily rates average $234
Shoulder Season
- Revenue averages $1,982 per month
- Occupancy maintains around 36.3%
- Daily rates hold near $220
Low Season (February, November, December)
- Revenue drops to average $737 per month
- Occupancy decreases to average 16.8%
- Daily rates adjust to average $215
Seasonality Insights for Gaggi
- The Airbnb seasonality in Gaggi shows highly seasonal trends requiring careful strategy. While the sections above show seasonal averages, it's also insightful to look at the extremes:
- During the high season, the absolute peak month showcases Gaggi's highest earning potential, with monthly revenues capable of climbing to $2,707, occupancy reaching a high of 51.2%, and ADRs peaking at $243.
- Conversely, the slowest single month of the year, typically falling within the low season, marks the market's lowest point. In this month, revenue might dip to $677, occupancy could drop to 11.3%, and ADRs may adjust down to $196.
- Understanding both the seasonal averages and these monthly peaks and troughs in revenue, occupancy, and ADR is crucial for maximizing your Airbnb profit potential in Gaggi.
Seasonal Strategies for Maximizing Profit
- Peak Season: Maximize revenue through premium pricing and potentially longer minimum stays. Ensure high availability.
- Low Season: Offer competitive pricing, special promotions (e.g., extended stay discounts), and flexible cancellation policies. Target off-season travelers like remote workers or budget-conscious guests.
- Shoulder Seasons: Implement dynamic pricing that balances peak and low rates. Target weekend travelers or specific events. Offer slightly more flexible terms than peak season.
- Regularly analyze your own performance against these Gaggi seasonality benchmarks and adjust your pricing and availability strategy accordingly.
Best Areas for Airbnb Investment in Gaggi (2026)
Exploring the top neighborhoods for short-term rentals in Gaggi? This section highlights key areas, outlining why they are attractive for hosts and guests, along with notable local attractions. Consider these locations based on your target guest profile and investment strategy.
| Neighborhood / Area | Why Host Here? (Target Guests & Appeal) | Key Attractions & Landmarks |
|---|---|---|
| Giro di Sicilia | A scenic driving route that showcases the stunning views of Mount Etna and the coast. Popular with tourists looking for breathtaking landscapes and local culture. | Mount Etna, Catania, Taormina, Castelmola, Naxos Bay, Syracuse |
| Etna Park | A natural park surrounding the famous volcano, offering outdoor activities and a unique landscape. Ideal for nature lovers and adventure seekers. | Mount Etna hiking trails, Lava caves, Local wineries, Visit to Etna crater, Alcantara Gorges |
| Castelmola | A charming medieval village with panoramic views of Taormina and the coastline. Known for its quaint streets and local charm, attracting foreign visitors. | Castelmola Castle, Piazza Sant'Antonio, Local cafes, Mirador de Saraceni, Taormina nearby |
| Taormina | A popular tourist destination known for its ancient Greek theater and stunning views of the coastal areas. It's a cultural hotspot with rich history. | Ancient Theatre, Corso Umberto, Isola Bella, Public Gardens, The Romans Theatre |
| Cefalù | A picturesque coastal town with beautiful beaches and historic architecture. It attracts beachgoers and history buffs alike. | Cefalù Cathedral, La Rocca, Cefalù beaches, Medieval wash house, Local seafood restaurants |
| Siracusa | A historical city rich in Greek history and architecture, attracting cultural tourism. Offers a blend of history and seaside relaxation. | Parco Archeologico della Neapolis, Ortigia Island, Temple of Apollo, Fountain of Arethusa, Siracusa beaches |
| Palermo | The capital of Sicily, known for its vibrant street markets and rich history. It's a cultural hub, attracting tourists year-round. | Palermo Cathedral, Palazzo dei Normanni, Cappella Palatina, Teatro Massimo, Markets of Ballarò and Vucciria |
| Agrigento | Famous for its ancient Greek ruins, particularly the Valley of the Temples. It attracts historians and tourists looking for ancient history. | Valley of the Temples, Scala dei Turchi, Agrigento Archaeological Museum, Temple of Concordia, Local agriturismos |
Understanding Airbnb License Requirements & STR Laws in Gaggi (2026)
Yes, Gaggi, Sicily, Italy enforces high STR regulations. Obtaining a license and ensuring compliance is almost certainly required according to current 2026 STR laws. Always verify the latest short term rental regulations and Airbnb license requirements directly with local government authorities for Gaggi to ensure full compliance before hosting.
(Source: AirROI data, 2026, based on 83% licensed listings)
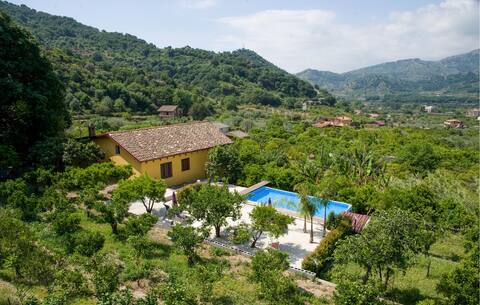
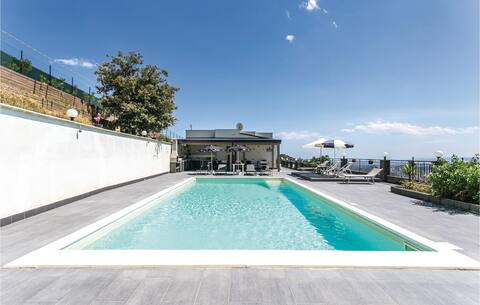
Top Performing Airbnb Properties in Gaggi (2026)
Benchmark your potential! Explore examples of top-performing Airbnb properties in Gaggibased on Trailing Twelve Month (TTM) revenue. Analyze their characteristics, revenue, occupancy rate, and ADR to understand what drives success in this market.
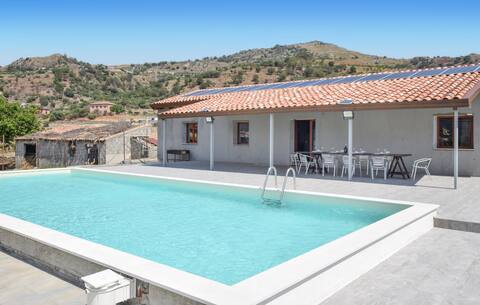
Villa Rossella
Entire Place • 5 bedrooms

Villa with pool near Taormina
Entire Place • 3 bedrooms
Cozy home in Gaggi with jacuzzi
Entire Place • 3 bedrooms
Villa Bellavista
Entire Place • 4 bedrooms

House with garden overlooking Mount Etna
Entire Place • 1 bedroom

Villa Agave - Superior Spa Suite
Private Room • N/A
Note: Performance varies based on location, size, amenities, seasonality, and management quality. Data reflects the past 12 months.
Top Performing Airbnb Hosts in Gaggi (2026)
Learn from the best! This table showcases top-performing Airbnb hosts in Gaggi based on the number of properties managed and estimated total revenue over the past year. Analyze their scale and performance metrics.
| Host Name | Properties | Grossing Revenue | Stay Reviews | Avg Rating |
|---|---|---|---|---|
| Novasol | 1 | $50,159 | 2 | Not Rated |
| Giovannino | 1 | $31,939 | 25 | 4.96/5.0 |
| Novasol | 1 | $29,987 | 4 | 3.75/5.0 |
| Novasol | 1 | $27,921 | 22 | 4.45/5.0 |
| Studio In | 3 | $25,124 | 11 | 4.90/5.0 |
| Katarina | 1 | $16,052 | 23 | 4.96/5.0 |
| Novasol | 1 | $13,696 | 2 | Not Rated |
| Floriana | 1 | $13,609 | 16 | 4.63/5.0 |
| Alessandro | 1 | $13,542 | 126 | 4.89/5.0 |
| Rosa Maria Catena | 1 | $13,406 | 37 | 4.95/5.0 |
Analyzing the strategies of top hosts, such as their property selection, pricing, and guest communication, can offer valuable lessons for optimizing your own Airbnb operations in Gaggi.
Dive Deeper: Advanced Gaggi STR Market Data (2026)
Ready to unlock more insights? AirROI provides access to advanced metrics and comprehensive Airbnb data for Gaggi. Explore detailed analytics beyond this report to refine your investment strategy, optimize pricing, and maximize your vacation rental profits.
Explore Advanced MetricsGaggi Short-Term Rental Market Composition (2026): Property & Room Types
Room Type Distribution
Property Type Distribution
Market Composition Insights for Gaggi
- The Gaggi Airbnb market composition is heavily skewed towards Entire Home/Apt listings, which make up 78.3% of the 23 active rentals. This indicates strong guest preference for privacy and space.
- Looking at the property type distribution in Gaggi, House properties are the most common (69.6%), reflecting the local real estate landscape.
- Houses represent a significant 69.6% portion, catering likely to families or larger groups.
- Smaller segments like hotel/boutique (combined 4.3%) offer potential for unique stay experiences.
Gaggi Airbnb Room Capacity Analysis (2026): Bedroom Distribution
Distribution of Listings by Number of Bedrooms
Room Capacity Insights for Gaggi
- The dominant room capacity in Gaggi is 1 bedroom listings, making up 30.4% of the market. This suggests a strong demand for properties suitable for couples or solo travelers.
- Together, 1 bedroom and 3 bedrooms properties represent 56.5% of the active Airbnb listings in Gaggi, indicating a high concentration in these sizes.
- A significant 43.5% of listings offer 3+ bedrooms, catering to larger groups and families seeking more space in Gaggi.
Gaggi Vacation Rental Guest Capacity Trends (2026)
Distribution of Listings by Guest Capacity
Guest Capacity Insights for Gaggi
- The most common guest capacity trend in Gaggi vacation rentals is listings accommodating 6 guests (30.4%). This suggests the primary traveler segment is likely larger groups.
- Properties designed for 6 guests and 8+ guests dominate the Gaggi STR market, accounting for 47.8% of listings.
- 47.8% of properties accommodate 6+ guests, serving the market segment for larger families or group travel in Gaggi.
- On average, properties in Gaggi are equipped to host 4.3 guests.
Gaggi Airbnb Booking Patterns (2026): Available vs. Booked Days
Available Days Distribution
Booked Days Distribution
Booking Pattern Insights for Gaggi
- The most common availability pattern in Gaggi falls within the 271-366 days range, representing 69.6% of listings. This suggests many properties have significant open periods on their calendars.
- Approximately 91.3% of listings show high availability (181+ days open annually), indicating potential for increased bookings or specific owner usage patterns.
- For booked days, the 31-90 days range is most frequent in Gaggi (39.1%), reflecting common guest stay durations or potential owner blocking patterns.
- A notable 8.7% of properties secure long booking periods (181+ days booked per year), highlighting successful long-term rental strategies or significant owner usage.
Gaggi Airbnb Minimum Stay Requirements Analysis
Distribution of Listings by Minimum Night Requirement
1 Night
1 listings
4.3% of total
2 Nights
1 listings
4.3% of total
3 Nights
3 listings
13% of total
4-6 Nights
2 listings
8.7% of total
7-29 Nights
2 listings
8.7% of total
30+ Nights
14 listings
60.9% of total
Key Insights
- The most prevalent minimum stay requirement in Gaggi is 30+ Nights, adopted by 60.9% of listings. This highlights the market's preference for longer commitments.
- Very short stays (1-2 nights) are less common (8.6%), suggesting hosts prefer slightly longer bookings to optimize turnover.
- A significant segment (60.9%) caters to monthly stays (30+ nights) in Gaggi, pointing to opportunities in the extended-stay market.
Recommendations
- Align with the market by considering a 30+ Nights minimum stay, as 60.9% of Gaggi hosts use this setting.
- If feasible, allowing 1-night stays, especially midweek or during low season, could capture last-minute bookings, as only 4.3% currently do.
- Explore offering discounts for stays of 30+ nights to attract the 60.9% of the market seeking extended stays.
- Adjust minimum nights based on seasonality – potentially shorter during low season and longer during peak demand periods in Gaggi.
Gaggi Airbnb Cancellation Policy Trends Analysis (2026)
Super Strict 30 Days
6 listings
26.1% of total
Super Strict 60 Days
4 listings
17.4% of total
Flexible
6 listings
26.1% of total
Moderate
4 listings
17.4% of total
Firm
3 listings
13% of total
Cancellation Policy Insights for Gaggi
- The prevailing Airbnb cancellation policy trend in Gaggi is Super Strict 30 Days, used by 26.1% of listings.
- There's a relatively balanced mix between guest-friendly (43.5%) and stricter (13.0%) policies, offering choices for different guest needs.
Recommendations for Hosts
- Consider adopting a Super Strict 30 Days policy to align with the 26.1% market standard in Gaggi.
- Regularly review your cancellation policy against competitors and market demand shifts in Gaggi.
Gaggi STR Booking Lead Time Analysis (2026)
Average Booking Lead Time by Month
Booking Lead Time Insights for Gaggi
- The overall average booking lead time for vacation rentals in Gaggi is 66 days.
- Guests book furthest in advance for stays during January (average 118 days), likely coinciding with peak travel demand or local events.
- The shortest booking windows occur for stays in April (average 40 days), indicating more last-minute travel plans during this time.
- Seasonally, Winter (83 days avg.) sees the longest lead times, while Spring (50 days avg.) has the shortest, reflecting typical travel planning cycles.
Recommendations for Hosts
- Use the overall average lead time (66 days) as a baseline for your pricing and availability strategy in Gaggi.
- For January stays, consider implementing length-of-stay discounts or slightly higher rates for bookings made less than 118 days out to capitalize on advance planning.
- Target marketing efforts for the Winter season well in advance (at least 83 days) to capture early planners.
- Monitor your own booking lead times against these Gaggi averages to identify opportunities for dynamic pricing adjustments.
Popular & Essential Airbnb Amenities in Gaggi (2026)
Amenity Prevalence
Amenity Insights for Gaggi
- Essential amenities in Gaggi that guests expect include: Hangers, TV, Wifi, Air conditioning. Lacking these (any) could significantly impact bookings.
- Popular amenities like Hair dryer, Kitchen, Dishes and silverware are common but not universal. Offering these can provide a competitive edge.
Recommendations for Hosts
- Ensure your listing includes all essential amenities for Gaggi: Hangers, TV, Wifi, Air conditioning.
- Prioritize adding missing essentials: TV, Wifi, Air conditioning.
- Consider adding popular differentiators like Hair dryer or Kitchen to increase appeal.
- Highlight unique or less common amenities you offer (e.g., hot tub, dedicated workspace, EV charger) in your listing description and photos.
- Regularly check competitor amenities in Gaggi to stay competitive.
Gaggi Airbnb Guest Demographics & Profile Analysis (2026)
Guest Profile Summary for Gaggi
- The typical guest profile for Airbnb in Gaggi consists of predominantly international visitors (91%), with top international origins including Germany, typically belonging to the Post-2000s (Gen Z/Alpha) group (50%), primarily speaking English or German.
- Domestic travelers account for 8.6% of guests.
- Key international markets include France (22.9%) and Germany (21.4%).
- Top languages spoken are English (38.7%) followed by German (20%).
- A significant demographic segment is the Post-2000s (Gen Z/Alpha) group, representing 50% of guests.
Recommendations for Hosts
- Focus marketing internationally, particularly towards travelers from Germany.
- Tailor amenities and listing descriptions to appeal to the dominant Post-2000s (Gen Z/Alpha) demographic (e.g., highlight fast WiFi, smart home features, local guides).
- Highlight unique local experiences or amenities relevant to the primary guest profile.
- Consider seasonal promotions aligned with peak travel times for key origin markets.
Nearby Short-Term Rental Market Comparison
How does the Gaggi Airbnb market stack up against its neighbors? Compare key performance metrics like average monthly revenue, ADR, and occupancy rates in surrounding areas to understand the broader regional STR landscape.
| Market | Active Properties | Monthly Revenue | Daily Rate | Avg. Occupancy |
|---|---|---|---|---|
| Taormina | 1,004 | $2,744 | $247.48 | 48% |
| Trecastagni | 57 | $2,356 | $307.87 | 34% |
| Santa Venerina | 52 | $2,153 | $278.18 | 41% |
| Graniti | 20 | $2,139 | $177.04 | 47% |
| Castelmola | 57 | $2,128 | $232.99 | 48% |
| Għasri | 66 | $1,973 | $219.61 | 38% |
| Valverde | 15 | $1,963 | $212.22 | 34% |
| Piedimonte Etneo | 74 | $1,928 | $225.24 | 36% |
| San Marco d'Alunzio | 11 | $1,912 | $199.80 | 35% |
| Caronia | 43 | $1,883 | $191.71 | 40% |