Ala Airbnb Market Analysis 2025: Short Term Rental Data & Vacation Rental Statistics in Trentino – Alto Adige/Südtirol, Italy
Is Airbnb profitable in Ala in 2025? Explore comprehensive Airbnb analytics for Ala, Trentino – Alto Adige/Südtirol, Italy to uncover income potential. This 2025 STR market report for Ala, based on AirROI data from August 2024 to July 2025, reveals key trends in the niche market of 19 active listings.
Whether you're considering an Airbnb investment in Ala, optimizing your existing vacation rental, or exploring rental arbitrage opportunities, understanding the Ala Airbnb data is crucial. Leveraging the low regulation environment is key to maximizing your short term rental income potential. Let's dive into the specifics.
Key Ala Airbnb Performance Metrics Overview
Monthly Airbnb Revenue Variations & Income Potential in Ala (2025)
Understanding the monthly revenue variations for Airbnb listings in Ala is key to maximizing your short term rental income potential. Seasonality significantly impacts earnings. Our analysis, based on data from the past 12 months, shows that the peak revenue month for STRs in Ala is typically August, while February often presents the lowest earnings, highlighting opportunities for strategic pricing adjustments during shoulder and low seasons. Explore the typical Airbnb income in Ala across different performance tiers:
- Best-in-class properties (Top 10%) achieve $3,250+ monthly, often utilizing dynamic pricing and superior guest experiences.
- Strong performing properties (Top 25%) earn $1,819 or more, indicating effective management and desirable locations/amenities.
- Typical properties (Median) generate around $903 per month, representing the average market performance.
- Entry-level properties (Bottom 25%) see earnings around $542, often with potential for optimization.
Average Monthly Airbnb Earnings Trend in Ala
Ala Airbnb Occupancy Rate Trends (2025)
Maximize your bookings by understanding the Ala STR occupancy trends. Seasonal demand shifts significantly influence how often properties are booked. Typically, Augustsees the highest demand (peak season occupancy), while March experiences the lowest (low season). Effective strategies, like adjusting minimum stays or offering promotions, can boost occupancy during slower periods. Here's how different property tiers perform in Ala:
- Best-in-class properties (Top 10%) achieve 59%+ occupancy, indicating high desirability and potentially optimized availability.
- Strong performing properties (Top 25%) maintain 43% or higher occupancy, suggesting good market fit and guest satisfaction.
- Typical properties (Median) have an occupancy rate around 26%.
- Entry-level properties (Bottom 25%) average 13% occupancy, potentially facing higher vacancy.
Average Monthly Occupancy Rate Trend in Ala
Average Daily Rate (ADR) Airbnb Trends in Ala (2025)
Effective short term rental pricing strategy in Ala involves understanding monthly ADR fluctuations. The Average Daily Rate (ADR) for Airbnb in Ala typically peaks in January and dips lowest during April. Leveraging Airbnb dynamic pricing tools or strategies based on this seasonality can significantly boost revenue. Here's a look at the typical nightly rates achieved:
- Best-in-class properties (Top 10%) command rates of $224+ per night, often due to premium features or locations.
- Strong performing properties (Top 25%) achieve nightly rates of $166 or more.
- Typical properties (Median) charge around $116 per night.
- Entry-level properties (Bottom 25%) earn around $84 per night.
Average Daily Rate (ADR) Trend by Month in Ala
Get Live Ala Market Intelligence 👇

Explore Real-time Analytics
Airbnb Seasonality Analysis & Trends in Ala (2025)
Peak Season (August, July, December)
- Revenue averages $2,240 per month
- Occupancy rates average 43.1%
- Daily rates average $173
Shoulder Season
- Revenue averages $1,347 per month
- Occupancy maintains around 31.2%
- Daily rates hold near $164
Low Season (February, March, October)
- Revenue drops to average $637 per month
- Occupancy decreases to average 16.5%
- Daily rates adjust to average $164
Seasonality Insights for Ala
- The Airbnb seasonality in Ala shows highly seasonal trends requiring careful strategy. While the sections above show seasonal averages, it's also insightful to look at the extremes:
- During the high season, the absolute peak month showcases Ala's highest earning potential, with monthly revenues capable of climbing to $2,787, occupancy reaching a high of 57.3%, and ADRs peaking at $180.
- Conversely, the slowest single month of the year, typically falling within the low season, marks the market's lowest point. In this month, revenue might dip to $408, occupancy could drop to 8.6%, and ADRs may adjust down to $147.
- Understanding both the seasonal averages and these monthly peaks and troughs in revenue, occupancy, and ADR is crucial for maximizing your Airbnb profit potential in Ala.
Seasonal Strategies for Maximizing Profit
- Peak Season: Maximize revenue through premium pricing and potentially longer minimum stays. Ensure high availability.
- Low Season: Offer competitive pricing, special promotions (e.g., extended stay discounts), and flexible cancellation policies. Target off-season travelers like remote workers or budget-conscious guests.
- Shoulder Seasons: Implement dynamic pricing that balances peak and low rates. Target weekend travelers or specific events. Offer slightly more flexible terms than peak season.
- Regularly analyze your own performance against these Ala seasonality benchmarks and adjust your pricing and availability strategy accordingly.
Best Areas for Airbnb Investment in Ala (2025)
Exploring the top neighborhoods for short-term rentals in Ala? This section highlights key areas, outlining why they are attractive for hosts and guests, along with notable local attractions. Consider these locations based on your target guest profile and investment strategy.
| Neighborhood / Area | Why Host Here? (Target Guests & Appeal) | Key Attractions & Landmarks |
|---|---|---|
| Bolzano | The capital of the region known for its historical architecture and stunning mountainous landscape. It's a hub for tourists interested in both culture and outdoor activities, including skiing and hiking. | Walther Square, Museion, Duomo di Bolzano, Torre delle Viti, South Tyrol Museum of Archaeology |
| Merano | A picturesque town famous for its thermal spas and beautiful gardens, Merano attracts visitors looking for relaxation and wellness. | Therme Meran, Giardini di Trauttmansdorff, Merano horse racecourse, Kurhaus Meran, Passeggiata Tappeiner |
| Ortisei | Nestled in the Dolomites, Ortisei is ideal for those seeking winter sports as well as summer hiking and biking in a breathtaking natural setting. | Seceda Mountain, St. Ulrich Church, Resciesa, Museum Gherdeina, Skiing in Val Gardena |
| Riva del Garda | Located on Lake Garda, Riva del Garda offers a combination of beautiful lake views and historical sites, making it popular among outdoor and history enthusiasts alike. | Rocca di Riva, Piazza 3 Novembre, Lake Garda Cycling Path, Torre Apponale, Varone Waterfall |
| Trento | Known for its rich history and as a university city, Trento offers cultural attractions and is well-located for exploring the surrounding areas. | Buonconsiglio Castle, Piazza Duomo, Muse - Museo delle Scienze, Trento Cathedral, Palazzo delle Albere |
| Canazei | Famous for its ski resorts and access to the Sella Ronda ski area, Canazei attracts winter sports enthusiasts and summer hikers. | Sella Ronda, Belvedere Ski Area, Piz Boè, Fassa Valley, Lake Fedaia |
| Selva di Val Gardena | Another gem in the Dolomites, Selva di Val Gardena is popular among ski lovers and hikers due to its stunning landscapes and outdoor activities. | Ski Resort Val Gardena, Seceda, Gardena Pass, Natural Park Sciliar, Hiking Trails |
| Bressanone | Renowned for its historic town center and the nearby ski areas, Bressanone attracts both culture seekers and outdoor enthusiasts. | Bressanone Cathedral, Ciampinoi, Plose Mountain, Pharmacy Museum, Bressanone Christmas Market |
Understanding Airbnb License Requirements & STR Laws in Ala (2025)
While Ala, Trentino – Alto Adige/Südtirol, Italy currently shows low STR regulations, specific Airbnb license requirements might still exist or change. Always verify the latest short term rental regulations and Airbnb license requirements directly with local government authorities for Ala to ensure full compliance before hosting.
(Source: AirROI data, 2025, based on 5% licensed listings)
Top Performing Airbnb Properties in Ala (2025)
Benchmark your potential! Explore examples of top-performing Airbnb properties in Alabased on Trailing Twelve Month (TTM) revenue. Analyze their characteristics, revenue, occupancy rate, and ADR to understand what drives success in this market.

B&B Cà Ulivi ~ Full apartment
Entire Place • 2 bedrooms
Entire lodge immersed in nature
Entire Place • 5 bedrooms

B&B Ca' Ulivi Green Room~room with breakfast
Private Room • N/A
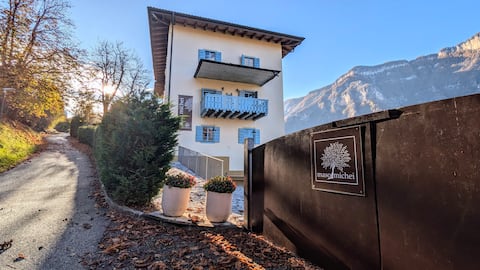
Maso Michei, nestled in the mountains & vineyards
Entire Place • 8 bedrooms

B&B Cà Ulivi ~ House under the tree
Private Room • 1 bedroom

Two-room apartment in the mountains
Entire Place • 2 bedrooms
Note: Performance varies based on location, size, amenities, seasonality, and management quality. Data reflects the past 12 months.
Top Performing Airbnb Hosts in Ala (2025)
Learn from the best! This table showcases top-performing Airbnb hosts in Ala based on the number of properties managed and estimated total revenue over the past year. Analyze their scale and performance metrics.
| Host Name | Properties | Grossing Revenue | Stay Reviews | Avg Rating |
|---|---|---|---|---|
| Francesca | 5 | $80,824 | 564 | 4.93/5.0 |
| Thomas | 1 | $32,993 | 42 | 4.90/5.0 |
| Giuseppe | 3 | $15,083 | 45 | 4.83/5.0 |
| Host #439786564 | 1 | $13,227 | 0 | Not Rated |
| Sara | 1 | $11,084 | 24 | 4.83/5.0 |
| Maria Teresia | 2 | $6,447 | 4 | 5.00/5.0 |
| Michele | 2 | $6,420 | 32 | 4.67/5.0 |
| Mariano E Liliana | 1 | $5,351 | 37 | 4.97/5.0 |
| Gianni | 3 | $4,212 | 87 | 4.81/5.0 |
Analyzing the strategies of top hosts, such as their property selection, pricing, and guest communication, can offer valuable lessons for optimizing your own Airbnb operations in Ala.
Dive Deeper: Advanced Ala STR Market Data (2025)
Ready to unlock more insights? AirROI provides access to advanced metrics and comprehensive Airbnb data for Ala. Explore detailed analytics beyond this report to refine your investment strategy, optimize pricing, and maximize your vacation rental profits.
Explore Advanced MetricsAla Short-Term Rental Market Composition (2025): Property & Room Types
Room Type Distribution
Property Type Distribution
Market Composition Insights for Ala
- The Ala Airbnb market composition is heavily skewed towards Private Room listings, which make up 52.6% of the 19 active rentals. This indicates strong guest preference for privacy and space.
- Looking at the property type distribution in Ala, Apartment/Condo properties are the most common (42.1%), reflecting the local real estate landscape.
- Houses represent a significant 36.8% portion, catering likely to families or larger groups.
Ala Airbnb Room Capacity Analysis (2025): Bedroom Distribution
Distribution of Listings by Number of Bedrooms
Room Capacity Insights for Ala
- The dominant room capacity in Ala is 2 bedrooms listings, making up 31.6% of the market. This suggests a strong demand for properties suitable for couples or solo travelers.
- Together, 2 bedrooms and 1 bedroom properties represent 57.9% of the active Airbnb listings in Ala, indicating a high concentration in these sizes.
Ala Vacation Rental Guest Capacity Trends (2025)
Distribution of Listings by Guest Capacity
Guest Capacity Insights for Ala
- The most common guest capacity trend in Ala vacation rentals is listings accommodating 2 guests (26.3%). This suggests the primary traveler segment is likely couples or solo travelers.
- Properties designed for 2 guests and 4 guests dominate the Ala STR market, accounting for 47.4% of listings.
- 15.8% of properties accommodate 6+ guests, serving the market segment for larger families or group travel in Ala.
- On average, properties in Ala are equipped to host 2.8 guests.
Ala Airbnb Booking Patterns (2025): Available vs. Booked Days
Available Days Distribution
Booked Days Distribution
Booking Pattern Insights for Ala
- The most common availability pattern in Ala falls within the 271-366 days range, representing 68.4% of listings. This suggests many properties have significant open periods on their calendars.
- Approximately 94.7% of listings show high availability (181+ days open annually), indicating potential for increased bookings or specific owner usage patterns.
- For booked days, the 1-30 days range is most frequent in Ala (36.8%), reflecting common guest stay durations or potential owner blocking patterns.
- A notable 5.3% of properties secure long booking periods (181+ days booked per year), highlighting successful long-term rental strategies or significant owner usage.
Ala Airbnb Minimum Stay Requirements Analysis
Distribution of Listings by Minimum Night Requirement
1 Night
8 listings
42.1% of total
2 Nights
3 listings
15.8% of total
7-29 Nights
2 listings
10.5% of total
30+ Nights
6 listings
31.6% of total
Key Insights
- The most prevalent minimum stay requirement in Ala is 1 Night, adopted by 42.1% of listings. This highlights the market's preference for shorter, flexible bookings.
- A significant segment (31.6%) caters to monthly stays (30+ nights) in Ala, pointing to opportunities in the extended-stay market.
Recommendations
- Align with the market by considering a 1 Night minimum stay, as 42.1% of Ala hosts use this setting.
- Explore offering discounts for stays of 30+ nights to attract the 31.6% of the market seeking extended stays.
- Adjust minimum nights based on seasonality – potentially shorter during low season and longer during peak demand periods in Ala.
Ala Airbnb Cancellation Policy Trends Analysis (2025)
Flexible
15 listings
78.9% of total
Moderate
3 listings
15.8% of total
Strict
1 listings
5.3% of total
Cancellation Policy Insights for Ala
- The prevailing Airbnb cancellation policy trend in Ala is Flexible, used by 78.9% of listings.
- The market strongly favors guest-friendly terms, with 94.7% of listings offering Flexible or Moderate policies. This suggests guests in Ala may expect booking flexibility.
- Strict cancellation policies are quite rare (5.3%), potentially making listings with this policy less competitive unless justified by high demand or property type.
Recommendations for Hosts
- Consider adopting a Flexible policy to align with the 78.9% market standard in Ala.
- Given the high prevalence of Flexible policies (78.9%), offering this can enhance booking appeal, especially during shoulder seasons.
- Using a Strict policy might deter some guests, as only 5.3% of listings use it. Evaluate if potential revenue protection outweighs possible lower booking rates.
- Regularly review your cancellation policy against competitors and market demand shifts in Ala.
Ala STR Booking Lead Time Analysis (2025)
Average Booking Lead Time by Month
Booking Lead Time Insights for Ala
- The overall average booking lead time for vacation rentals in Ala is 32 days.
- Guests book furthest in advance for stays during February (average 53 days), likely coinciding with peak travel demand or local events.
- The shortest booking windows occur for stays in November (average 9 days), indicating more last-minute travel plans during this time.
- Seasonally, Winter (42 days avg.) sees the longest lead times, while Fall (21 days avg.) has the shortest, reflecting typical travel planning cycles.
Recommendations for Hosts
- Use the overall average lead time (32 days) as a baseline for your pricing and availability strategy in Ala.
- For February stays, consider implementing length-of-stay discounts or slightly higher rates for bookings made less than 53 days out to capitalize on advance planning.
- During November, focus on last-minute booking availability and promotions, as guests book with very short notice (9 days avg.).
- Target marketing efforts for the Winter season well in advance (at least 42 days) to capture early planners.
- Monitor your own booking lead times against these Ala averages to identify opportunities for dynamic pricing adjustments.
Popular & Essential Airbnb Amenities in Ala (2025)
Amenity Prevalence
Amenity Insights for Ala
- Popular amenities like Essentials, Heating, Hair dryer are common but not universal. Offering these can provide a competitive edge.
- Warning: Wifi is not universally provided but is considered essential globally. Ensure reliable Wifi is offered.
Recommendations for Hosts
- Consider adding popular differentiators like Essentials or Heating to increase appeal.
- Highlight unique or less common amenities you offer (e.g., hot tub, dedicated workspace, EV charger) in your listing description and photos.
- Regularly check competitor amenities in Ala to stay competitive.
Ala Airbnb Guest Demographics & Profile Analysis (2025)
Guest Profile Summary for Ala
- The typical guest profile for Airbnb in Ala consists of predominantly international visitors (83%), with top international origins including Italy, typically belonging to the Post-2000s (Gen Z/Alpha) group (50%), primarily speaking English or German.
- Domestic travelers account for 17.3% of guests.
- Key international markets include Germany (34.6%) and Italy (17.3%).
- Top languages spoken are English (41.7%) followed by German (16.5%).
- A significant demographic segment is the Post-2000s (Gen Z/Alpha) group, representing 50% of guests.
Recommendations for Hosts
- Focus marketing internationally, particularly towards travelers from Italy.
- Tailor amenities and listing descriptions to appeal to the dominant Post-2000s (Gen Z/Alpha) demographic (e.g., highlight fast WiFi, smart home features, local guides).
- Highlight unique local experiences or amenities relevant to the primary guest profile.
- Consider seasonal promotions aligned with peak travel times for key origin markets.
Nearby Short-Term Rental Market Comparison
How does the Ala Airbnb market stack up against its neighbors? Compare key performance metrics like average monthly revenue, ADR, and occupancy rates in surrounding areas to understand the broader regional STR landscape.
| Market | Active Properties | Monthly Revenue | Daily Rate | Avg. Occupancy |
|---|---|---|---|---|
| Moos in Passeier - Moso in Passiria | 17 | $4,931 | $594.63 | 28% |
| Urtijëi - St. Ulrich in Gröden - Ortisei | 165 | $4,558 | $662.76 | 41% |
| Sankt Pankraz - San Pancrazio | 16 | $3,547 | $647.34 | 21% |
| Brenzone sul Garda | 21 | $3,526 | $327.85 | 43% |
| Cortina d'Ampezzo | 285 | $3,471 | $405.20 | 41% |
| Kiens - Chienes | 19 | $3,237 | $339.07 | 50% |
| Venice | 6,768 | $3,094 | $241.78 | 49% |
| Colle Santa Lucia | 20 | $2,935 | $220.91 | 44% |
| Sëlva - Wolkenstein - Selva di Val Gardena | 93 | $2,778 | $394.35 | 43% |
| Lajen - Laion | 98 | $2,725 | $544.02 | 33% |