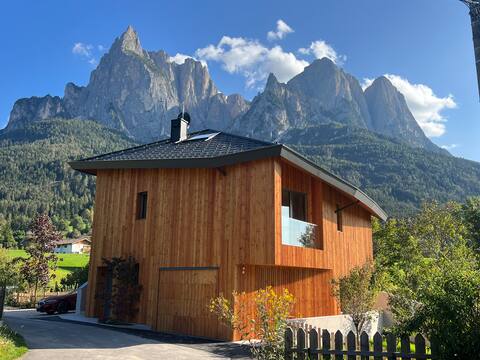
Kastelruth - Castelrotto Airbnb Market Analysis 2026: Short Term Rental Data & Vacation Rental Statistics in Trentino – Alto Adige/Südtirol, Italy
Is Airbnb profitable in Kastelruth - Castelrotto in 2026? Explore comprehensive Airbnb analytics for Kastelruth - Castelrotto, Trentino – Alto Adige/Südtirol, Italy to uncover income potential. This 2026 STR market report for Kastelruth - Castelrotto, based on AirROI data from February 2025 to January 2026, reveals key trends in the niche market of 191 active listings.
Whether you're considering an Airbnb investment in Kastelruth - Castelrotto, optimizing your existing vacation rental, or exploring rental arbitrage opportunities, understanding the Kastelruth - Castelrotto Airbnb data is crucial. Navigating the high regulation landscape is key to maximizing your short term rental income potential. Let's dive into the specifics.
Key Kastelruth - Castelrotto Airbnb Performance Metrics Overview
Monthly Airbnb Revenue Variations & Income Potential in Kastelruth - Castelrotto (2026)
Understanding the monthly revenue variations for Airbnb listings in Kastelruth - Castelrotto is key to maximizing your short term rental income potential. Seasonality significantly impacts earnings. Our analysis, based on data from the past 12 months, shows that the peak revenue month for STRs in Kastelruth - Castelrotto is typically August, while December often presents the lowest earnings, highlighting opportunities for strategic pricing adjustments during shoulder and low seasons. Explore the typical Airbnb income in Kastelruth - Castelrotto across different performance tiers:
- Best-in-class properties (Top 10%) achieve $8,294+ monthly, often utilizing dynamic pricing and superior guest experiences.
- Strong performing properties (Top 25%) earn $4,826 or more, indicating effective management and desirable locations/amenities.
- Typical properties (Median) generate around $2,927 per month, representing the average market performance.
- Entry-level properties (Bottom 25%) see earnings around $1,639, often with potential for optimization.
Average Monthly Airbnb Earnings Trend in Kastelruth - Castelrotto
Kastelruth - Castelrotto Airbnb Occupancy Rate Trends (2026)
Maximize your bookings by understanding the Kastelruth - Castelrotto STR occupancy trends. Seasonal demand shifts significantly influence how often properties are booked. Typically, Julysees the highest demand (peak season occupancy), while December experiences the lowest (low season). Effective strategies, like adjusting minimum stays or offering promotions, can boost occupancy during slower periods. Here's how different property tiers perform in Kastelruth - Castelrotto:
- Best-in-class properties (Top 10%) achieve 84%+ occupancy, indicating high desirability and potentially optimized availability.
- Strong performing properties (Top 25%) maintain 65% or higher occupancy, suggesting good market fit and guest satisfaction.
- Typical properties (Median) have an occupancy rate around 39%.
- Entry-level properties (Bottom 25%) average 17% occupancy, potentially facing higher vacancy.
Average Monthly Occupancy Rate Trend in Kastelruth - Castelrotto
Average Daily Rate (ADR) Airbnb Trends in Kastelruth - Castelrotto (2026)
Effective short term rental pricing strategy in Kastelruth - Castelrotto involves understanding monthly ADR fluctuations. The Average Daily Rate (ADR) for Airbnb in Kastelruth - Castelrotto typically peaks in January and dips lowest during April. Leveraging Airbnb dynamic pricing tools or strategies based on this seasonality can significantly boost revenue. Here's a look at the typical nightly rates achieved:
- Best-in-class properties (Top 10%) command rates of $980+ per night, often due to premium features or locations.
- Strong performing properties (Top 25%) achieve nightly rates of $567 or more.
- Typical properties (Median) charge around $259 per night.
- Entry-level properties (Bottom 25%) earn around $166 per night.
Average Daily Rate (ADR) Trend by Month in Kastelruth - Castelrotto
Get Live Kastelruth - Castelrotto Market Intelligence 👇

Explore Real-time Analytics
Airbnb Seasonality Analysis & Trends in Kastelruth - Castelrotto (2026)
Peak Season (August, July, February)
- Revenue averages $5,270 per month
- Occupancy rates average 51.0%
- Daily rates average $447
Shoulder Season
- Revenue averages $3,918 per month
- Occupancy maintains around 41.8%
- Daily rates hold near $431
Low Season (March, April, December)
- Revenue drops to average $2,937 per month
- Occupancy decreases to average 34.8%
- Daily rates adjust to average $422
Seasonality Insights for Kastelruth - Castelrotto
- The Airbnb seasonality in Kastelruth - Castelrotto shows moderate seasonality with distinct peak and low periods. While the sections above show seasonal averages, it's also insightful to look at the extremes:
- During the high season, the absolute peak month showcases Kastelruth - Castelrotto's highest earning potential, with monthly revenues capable of climbing to $5,536, occupancy reaching a high of 53.6%, and ADRs peaking at $478.
- Conversely, the slowest single month of the year, typically falling within the low season, marks the market's lowest point. In this month, revenue might dip to $2,881, occupancy could drop to 30.4%, and ADRs may adjust down to $402.
- Understanding both the seasonal averages and these monthly peaks and troughs in revenue, occupancy, and ADR is crucial for maximizing your Airbnb profit potential in Kastelruth - Castelrotto.
Seasonal Strategies for Maximizing Profit
- Peak Season: Maximize revenue through premium pricing and potentially longer minimum stays. Ensure high availability.
- Low Season: Offer competitive pricing, special promotions (e.g., extended stay discounts), and flexible cancellation policies. Target off-season travelers like remote workers or budget-conscious guests.
- Shoulder Seasons: Implement dynamic pricing that balances peak and low rates. Target weekend travelers or specific events. Offer slightly more flexible terms than peak season.
- Regularly analyze your own performance against these Kastelruth - Castelrotto seasonality benchmarks and adjust your pricing and availability strategy accordingly.
Best Areas for Airbnb Investment in Kastelruth - Castelrotto (2026)
Exploring the top neighborhoods for short-term rentals in Kastelruth - Castelrotto? This section highlights key areas, outlining why they are attractive for hosts and guests, along with notable local attractions. Consider these locations based on your target guest profile and investment strategy.
| Neighborhood / Area | Why Host Here? (Target Guests & Appeal) | Key Attractions & Landmarks |
|---|---|---|
| Kastelruth Village | The charming village at the foot of the Sciliar mountain, known for its picturesque streets and authentic South Tyrolean culture. It attracts tourists looking for traditional alpine experiences and access to hiking trails. | Sciliar Natural Park, Kastelruth's St. Peter and Paul Church, historic center with shops and restaurants, Winter sports activities, local festivals |
| Alpe di Siusi | A stunning high-altitude plateau that offers breathtaking views and a plethora of outdoor activities year-round. It's a paradise for nature lovers and adventure seekers, making it a top choice for vacation rentals. | Cable cars to the peaks, Hiking trails, Skiing and snowboarding, Alpe di Siusi Nature Park, picturesque alpine meadows |
| Ortisei | A beautiful town in Val Gardena known for its woodcarving tradition and as a gateway to the Dolomites. It is particularly attractive for families and outdoor enthusiasts, with numerous rental options available. | Museum Gherdeina, Seceda cable car, Val Gardena ski area, local artisan shops, fine dining restaurants |
| Selva di Val Gardena | A popular destination for skiing and summer hiking, it offers a mix of luxury and authentic mountain experiences. Perfect for travelers looking for both relaxation and adventure activities. | Sella Ronda ski circuit, Paragliding spots, Guided hiking tours, Scenic viewpoints, Shopping and dining options |
| St. Ulrich | A picturesque village in Val Gardena, known for its beautiful landscapes and access to various outdoor activities. It draws tourists for its cultural events and local traditions. | St. Ulrich church, Wood carving tradition, Val Gardena museum, Local cuisine, Access to hiking and ski trails |
| Laranza | A small yet charming hamlet located close to Kastelruth, perfect for a quiet retreat. Attracts visitors who want a peaceful stay surrounded by nature and traditional Tyrolean hospitality. | Scenic hiking trails, Traditional farms, Stunning mountain views, Local delicacies, Winter sports in nearby areas |
| Tiers | A serene village nestled at the foot of the Rosengarten, offering a tranquil location for nature lovers. Ideal for vacation rentals catering to serene getaways and hiking enthusiasts. | Rosengarten Nature Park, Local hiking trails, Tranquil alpine lakes, Cultural heritage sites, Traditional Tyrolean inns |
| Val di Fassa | Famous for its ski resorts and breathtaking mountain panoramas. It offers numerous Airbnb opportunities for visitors looking to explore the Dolomites and engage in winter sports. | Val di Fassa ski area, Catinaccio/Rosengarten, Summer hiking routes, Lively après-ski culture, Scenic mountain villages |
Understanding Airbnb License Requirements & STR Laws in Kastelruth - Castelrotto (2026)
Yes, Kastelruth - Castelrotto, Trentino – Alto Adige/Südtirol, Italy enforces high STR regulations. Obtaining a license and ensuring compliance is almost certainly required according to current 2026 STR laws. Always verify the latest short term rental regulations and Airbnb license requirements directly with local government authorities for Kastelruth - Castelrotto to ensure full compliance before hosting.
(Source: AirROI data, 2026, based on 95% licensed listings)
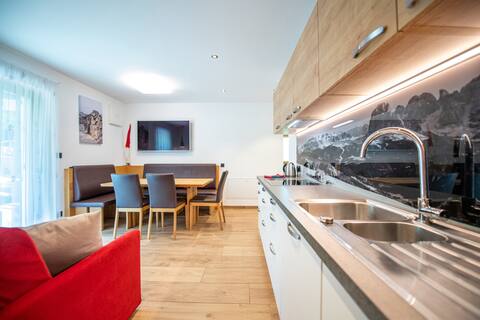
Top Performing Airbnb Properties in Kastelruth - Castelrotto (2026)
Benchmark your potential! Explore examples of top-performing Airbnb properties in Kastelruth - Castelrottobased on Trailing Twelve Month (TTM) revenue. Analyze their characteristics, revenue, occupancy rate, and ADR to understand what drives success in this market.
The Baules Alpine Lodge
Entire Place • 5 bedrooms

Pradell / The log cabin in the Dolomites 01
Private Room • 2 bedrooms

195b Apartments LaBar
Entire Place • 2 bedrooms

Apartments Central Home 142a
Entire Place • 2 bedrooms

iFlat | Chalet Carole Ortisei
Entire Place • 2 bedrooms
Apartments Cesa Ploner 103b
Entire Place • 3 bedrooms
Note: Performance varies based on location, size, amenities, seasonality, and management quality. Data reflects the past 12 months.
Top Performing Airbnb Hosts in Kastelruth - Castelrotto (2026)
Learn from the best! This table showcases top-performing Airbnb hosts in Kastelruth - Castelrotto based on the number of properties managed and estimated total revenue over the past year. Analyze their scale and performance metrics.
| Host Name | Properties | Grossing Revenue | Stay Reviews | Avg Rating |
|---|---|---|---|---|
| MUSE.Holiday | 28 | $1,209,723 | 358 | 4.52/5.0 |
| Martin | 1 | $330,459 | 32 | 4.88/5.0 |
| Thomas | 10 | $292,502 | 678 | 4.95/5.0 |
| David | 5 | $195,092 | 114 | 4.99/5.0 |
| Holidu | 6 | $192,438 | 228 | 4.97/5.0 |
| Davide | 5 | $186,631 | 127 | 4.98/5.0 |
| Holidu | 5 | $178,186 | 121 | 4.94/5.0 |
| Holidu | 4 | $154,863 | 132 | 4.94/5.0 |
| Holidu | 3 | $153,306 | 35 | 4.78/5.0 |
| Pedescin | 5 | $139,333 | 37 | 4.91/5.0 |
Analyzing the strategies of top hosts, such as their property selection, pricing, and guest communication, can offer valuable lessons for optimizing your own Airbnb operations in Kastelruth - Castelrotto.
Dive Deeper: Advanced Kastelruth - Castelrotto STR Market Data (2026)
Ready to unlock more insights? AirROI provides access to advanced metrics and comprehensive Airbnb data for Kastelruth - Castelrotto. Explore detailed analytics beyond this report to refine your investment strategy, optimize pricing, and maximize your vacation rental profits.
Explore Advanced MetricsKastelruth - Castelrotto Short-Term Rental Market Composition (2026): Property & Room Types
Room Type Distribution
Property Type Distribution
Market Composition Insights for Kastelruth - Castelrotto
- The Kastelruth - Castelrotto Airbnb market composition is heavily skewed towards Entire Home/Apt listings, which make up 91.1% of the 191 active rentals. This indicates strong guest preference for privacy and space.
- Looking at the property type distribution in Kastelruth - Castelrotto, Apartment/Condo properties are the most common (81.7%), reflecting the local real estate landscape.
- Smaller segments like hotel/boutique, outdoor/unique (combined 6.8%) offer potential for unique stay experiences.
Kastelruth - Castelrotto Airbnb Room Capacity Analysis (2026): Bedroom Distribution
Distribution of Listings by Number of Bedrooms
Room Capacity Insights for Kastelruth - Castelrotto
- The dominant room capacity in Kastelruth - Castelrotto is 1 bedroom listings, making up 44.5% of the market. This suggests a strong demand for properties suitable for couples or solo travelers.
- Together, 1 bedroom and 2 bedrooms properties represent 86.9% of the active Airbnb listings in Kastelruth - Castelrotto, indicating a high concentration in these sizes.
Kastelruth - Castelrotto Vacation Rental Guest Capacity Trends (2026)
Distribution of Listings by Guest Capacity
Guest Capacity Insights for Kastelruth - Castelrotto
- The most common guest capacity trend in Kastelruth - Castelrotto vacation rentals is listings accommodating 4 guests (43.5%). This suggests the primary traveler segment is likely small families or groups.
- Properties designed for 4 guests and 2 guests dominate the Kastelruth - Castelrotto STR market, accounting for 60.3% of listings.
- 16.8% of properties accommodate 6+ guests, serving the market segment for larger families or group travel in Kastelruth - Castelrotto.
- On average, properties in Kastelruth - Castelrotto are equipped to host 4.0 guests.
Kastelruth - Castelrotto Airbnb Booking Patterns (2026): Available vs. Booked Days
Available Days Distribution
Booked Days Distribution
Booking Pattern Insights for Kastelruth - Castelrotto
- The most common availability pattern in Kastelruth - Castelrotto falls within the 271-366 days range, representing 55.5% of listings. This suggests many properties have significant open periods on their calendars.
- Approximately 77.5% of listings show high availability (181+ days open annually), indicating potential for increased bookings or specific owner usage patterns.
- For booked days, the 31-90 days range is most frequent in Kastelruth - Castelrotto (28.3%), reflecting common guest stay durations or potential owner blocking patterns.
- A notable 23.5% of properties secure long booking periods (181+ days booked per year), highlighting successful long-term rental strategies or significant owner usage.
Kastelruth - Castelrotto Airbnb Minimum Stay Requirements Analysis
Distribution of Listings by Minimum Night Requirement
1 Night
37 listings
19.4% of total
2 Nights
6 listings
3.1% of total
3 Nights
3 listings
1.6% of total
4-6 Nights
63 listings
33% of total
7-29 Nights
14 listings
7.3% of total
30+ Nights
68 listings
35.6% of total
Key Insights
- The most prevalent minimum stay requirement in Kastelruth - Castelrotto is 30+ Nights, adopted by 35.6% of listings. This highlights the market's preference for longer commitments.
- A significant segment (35.6%) caters to monthly stays (30+ nights) in Kastelruth - Castelrotto, pointing to opportunities in the extended-stay market.
Recommendations
- Align with the market by considering a 30+ Nights minimum stay, as 35.6% of Kastelruth - Castelrotto hosts use this setting.
- If feasible, allowing 1-night stays, especially midweek or during low season, could capture last-minute bookings, as only 19.4% currently do.
- Explore offering discounts for stays of 30+ nights to attract the 35.6% of the market seeking extended stays.
- Adjust minimum nights based on seasonality – potentially shorter during low season and longer during peak demand periods in Kastelruth - Castelrotto.
Kastelruth - Castelrotto Airbnb Cancellation Policy Trends Analysis (2026)
Limited
4 listings
2.1% of total
Super Strict 30 Days
17 listings
8.9% of total
Super Strict 60 Days
37 listings
19.4% of total
Flexible
13 listings
6.8% of total
Moderate
34 listings
17.8% of total
Firm
70 listings
36.6% of total
Strict
16 listings
8.4% of total
Cancellation Policy Insights for Kastelruth - Castelrotto
- The prevailing Airbnb cancellation policy trend in Kastelruth - Castelrotto is Firm, used by 36.6% of listings.
- There's a relatively balanced mix between guest-friendly (24.6%) and stricter (45.0%) policies, offering choices for different guest needs.
- Strict cancellation policies are quite rare (8.4%), potentially making listings with this policy less competitive unless justified by high demand or property type.
Recommendations for Hosts
- Consider adopting a Firm policy to align with the 36.6% market standard in Kastelruth - Castelrotto.
- Using a Strict policy might deter some guests, as only 8.4% of listings use it. Evaluate if potential revenue protection outweighs possible lower booking rates.
- Regularly review your cancellation policy against competitors and market demand shifts in Kastelruth - Castelrotto.
Kastelruth - Castelrotto STR Booking Lead Time Analysis (2026)
Average Booking Lead Time by Month
Booking Lead Time Insights for Kastelruth - Castelrotto
- The overall average booking lead time for vacation rentals in Kastelruth - Castelrotto is 92 days.
- Guests book furthest in advance for stays during August (average 134 days), likely coinciding with peak travel demand or local events.
- The shortest booking windows occur for stays in April (average 65 days), indicating more last-minute travel plans during this time.
- Seasonally, Summer (108 days avg.) sees the longest lead times, while Spring (72 days avg.) has the shortest, reflecting typical travel planning cycles.
Recommendations for Hosts
- Use the overall average lead time (92 days) as a baseline for your pricing and availability strategy in Kastelruth - Castelrotto.
- For August stays, consider implementing length-of-stay discounts or slightly higher rates for bookings made less than 134 days out to capitalize on advance planning.
- Target marketing efforts for the Summer season well in advance (at least 108 days) to capture early planners.
- Monitor your own booking lead times against these Kastelruth - Castelrotto averages to identify opportunities for dynamic pricing adjustments.
Popular & Essential Airbnb Amenities in Kastelruth - Castelrotto (2026)
Amenity Prevalence
Amenity Insights for Kastelruth - Castelrotto
- Essential amenities in Kastelruth - Castelrotto that guests expect include: Heating, TV, Wifi, Free parking on premises. Lacking these (any) could significantly impact bookings.
- Popular amenities like Kitchen, Essentials, Dishes and silverware are common but not universal. Offering these can provide a competitive edge.
Recommendations for Hosts
- Ensure your listing includes all essential amenities for Kastelruth - Castelrotto: Heating, TV, Wifi, Free parking on premises.
- Prioritize adding missing essentials: Heating, TV, Wifi, Free parking on premises.
- Consider adding popular differentiators like Kitchen or Essentials to increase appeal.
- Highlight unique or less common amenities you offer (e.g., hot tub, dedicated workspace, EV charger) in your listing description and photos.
- Regularly check competitor amenities in Kastelruth - Castelrotto to stay competitive.
Kastelruth - Castelrotto Airbnb Guest Demographics & Profile Analysis (2026)
Guest Profile Summary for Kastelruth - Castelrotto
- The typical guest profile for Airbnb in Kastelruth - Castelrotto consists of predominantly international visitors (93%), with top international origins including Germany, typically belonging to the Post-2000s (Gen Z/Alpha) group (50%), primarily speaking English or German.
- Domestic travelers account for 7.2% of guests.
- Key international markets include United States (23.3%) and Germany (13.4%).
- Top languages spoken are English (47.8%) followed by German (11.5%).
- A significant demographic segment is the Post-2000s (Gen Z/Alpha) group, representing 50% of guests.
Recommendations for Hosts
- Focus marketing internationally, particularly towards travelers from Germany.
- Tailor amenities and listing descriptions to appeal to the dominant Post-2000s (Gen Z/Alpha) demographic (e.g., highlight fast WiFi, smart home features, local guides).
- Highlight unique local experiences or amenities relevant to the primary guest profile.
- Consider seasonal promotions aligned with peak travel times for key origin markets.
Nearby Short-Term Rental Market Comparison
How does the Kastelruth - Castelrotto Airbnb market stack up against its neighbors? Compare key performance metrics like average monthly revenue, ADR, and occupancy rates in surrounding areas to understand the broader regional STR landscape.
| Market | Active Properties | Monthly Revenue | Daily Rate | Avg. Occupancy |
|---|---|---|---|---|
| Scheffau am Wilden Kaiser | 12 | $6,669 | $906.83 | 30% |
| Sankt Pankraz - San Pancrazio | 12 | $6,528 | $633.65 | 29% |
| Balderschwang | 10 | $5,253 | $304.03 | 58% |
| Urtijëi - St. Ulrich in Gröden - Ortisei | 172 | $5,054 | $718.33 | 41% |
| Kiens - Chienes | 17 | $3,715 | $377.77 | 48% |
| Cortina d'Ampezzo | 309 | $3,646 | $474.12 | 40% |
| Going am Wilden Kaiser | 27 | $3,596 | $406.50 | 37% |
| Kramsach | 12 | $3,573 | $272.32 | 48% |
| Bayrischzell | 41 | $3,550 | $389.91 | 33% |
| Krimml | 53 | $3,544 | $359.14 | 41% |