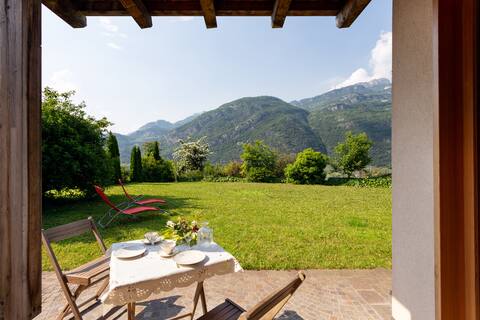
Mori Airbnb Market Analysis 2026: Short Term Rental Data & Vacation Rental Statistics in Trentino – Alto Adige/Südtirol, Italy
Is Airbnb profitable in Mori in 2026? Explore comprehensive Airbnb analytics for Mori, Trentino – Alto Adige/Südtirol, Italy to uncover income potential. This 2026 STR market report for Mori, based on AirROI data from August 2024 to July 2025, reveals key trends in the niche market of 18 active listings.
Whether you're considering an Airbnb investment in Mori, optimizing your existing vacation rental, or exploring rental arbitrage opportunities, understanding the Mori Airbnb data is crucial. Leveraging the low regulation environment is key to maximizing your short term rental income potential. Let's dive into the specifics.
Key Mori Airbnb Performance Metrics Overview
Monthly Airbnb Revenue Variations & Income Potential in Mori (2026)
Understanding the monthly revenue variations for Airbnb listings in Mori is key to maximizing your short term rental income potential. Seasonality significantly impacts earnings. Our analysis, based on data from the past 12 months, shows that the peak revenue month for STRs in Mori is typically August, while March often presents the lowest earnings, highlighting opportunities for strategic pricing adjustments during shoulder and low seasons. Explore the typical Airbnb income in Mori across different performance tiers:
- Best-in-class properties (Top 10%) achieve $2,933+ monthly, often utilizing dynamic pricing and superior guest experiences.
- Strong performing properties (Top 25%) earn $2,171 or more, indicating effective management and desirable locations/amenities.
- Typical properties (Median) generate around $1,154 per month, representing the average market performance.
- Entry-level properties (Bottom 25%) see earnings around $614, often with potential for optimization.
Average Monthly Airbnb Earnings Trend in Mori
Mori Airbnb Occupancy Rate Trends (2026)
Maximize your bookings by understanding the Mori STR occupancy trends. Seasonal demand shifts significantly influence how often properties are booked. Typically, Augustsees the highest demand (peak season occupancy), while November experiences the lowest (low season). Effective strategies, like adjusting minimum stays or offering promotions, can boost occupancy during slower periods. Here's how different property tiers perform in Mori:
- Best-in-class properties (Top 10%) achieve 76%+ occupancy, indicating high desirability and potentially optimized availability.
- Strong performing properties (Top 25%) maintain 58% or higher occupancy, suggesting good market fit and guest satisfaction.
- Typical properties (Median) have an occupancy rate around 32%.
- Entry-level properties (Bottom 25%) average 16% occupancy, potentially facing higher vacancy.
Average Monthly Occupancy Rate Trend in Mori
Average Daily Rate (ADR) Airbnb Trends in Mori (2026)
Effective short term rental pricing strategy in Mori involves understanding monthly ADR fluctuations. The Average Daily Rate (ADR) for Airbnb in Mori typically peaks in July and dips lowest during October. Leveraging Airbnb dynamic pricing tools or strategies based on this seasonality can significantly boost revenue. Here's a look at the typical nightly rates achieved:
- Best-in-class properties (Top 10%) command rates of $233+ per night, often due to premium features or locations.
- Strong performing properties (Top 25%) achieve nightly rates of $151 or more.
- Typical properties (Median) charge around $109 per night.
- Entry-level properties (Bottom 25%) earn around $87 per night.
Average Daily Rate (ADR) Trend by Month in Mori
Get Live Mori Market Intelligence 👇

Explore Real-time Analytics
Airbnb Seasonality Analysis & Trends in Mori (2025)
Peak Season (August, January, December)
- Revenue averages $2,007 per month
- Occupancy rates average 49.6%
- Daily rates average $122
Shoulder Season
- Revenue averages $1,410 per month
- Occupancy maintains around 37.3%
- Daily rates hold near $137
Low Season (February, March, October)
- Revenue drops to average $946 per month
- Occupancy decreases to average 30.3%
- Daily rates adjust to average $126
Seasonality Insights for Mori
- The Airbnb seasonality in Mori shows highly seasonal trends requiring careful strategy. While the sections above show seasonal averages, it's also insightful to look at the extremes:
- During the high season, the absolute peak month showcases Mori's highest earning potential, with monthly revenues capable of climbing to $2,386, occupancy reaching a high of 56.0%, and ADRs peaking at $151.
- Conversely, the slowest single month of the year, typically falling within the low season, marks the market's lowest point. In this month, revenue might dip to $711, occupancy could drop to 22.0%, and ADRs may adjust down to $120.
- Understanding both the seasonal averages and these monthly peaks and troughs in revenue, occupancy, and ADR is crucial for maximizing your Airbnb profit potential in Mori.
Seasonal Strategies for Maximizing Profit
- Peak Season: Maximize revenue through premium pricing and potentially longer minimum stays. Ensure high availability.
- Low Season: Offer competitive pricing, special promotions (e.g., extended stay discounts), and flexible cancellation policies. Target off-season travelers like remote workers or budget-conscious guests.
- Shoulder Seasons: Implement dynamic pricing that balances peak and low rates. Target weekend travelers or specific events. Offer slightly more flexible terms than peak season.
- Regularly analyze your own performance against these Mori seasonality benchmarks and adjust your pricing and availability strategy accordingly.
Best Areas for Airbnb Investment in Mori (2026)
Exploring the top neighborhoods for short-term rentals in Mori? This section highlights key areas, outlining why they are attractive for hosts and guests, along with notable local attractions. Consider these locations based on your target guest profile and investment strategy.
| Neighborhood / Area | Why Host Here? (Target Guests & Appeal) | Key Attractions & Landmarks |
|---|---|---|
| Ortisei | Charming village in the heart of the Dolomites, perfect for skiing and hiking. Attracts outdoor enthusiasts and families looking for a scenic getaway. | Seceda, Gardena Pass, Museum Gherdeina, St. Ulrich Parish Church, Ski slopes, Hiking trails |
| Canazei | Famous for its proximity to the Sella Ronda ski tour, this town is bustling with tourists year-round. Ideal for winter sports and summer hiking. | Sella Ronda, Fedaia Lake, Cable cars, Alpine skiing, Mountain biking, Hiking paths |
| Bolzano | The capital of South Tyrol, known for its blend of Italian and German culture. Great for visitors interested in history, architecture, and food. | South Tyrol Museum of Archaeology, Walther Square, Bolzano's Christmas market, Renon Cable Car, Messner Mountain Museum |
| Merano | Famous for its spa culture and beautiful gardens. Popular among wellness tourists and those looking for a relaxing retreat. | Therme Merano, Trauttmansdorff Castle Gardens, Merano's historic center, Market square, Hiking trails in the surrounding mountains |
| Riva del Garda | Located on the shores of Lake Garda, known for its stunning views and outdoor activities. A hotspot for water sports enthusiasts. | Lake Garda, Water sports, Sanctuary of Santa Maria del Carob, Rocca di Riva, Hiking paths around the lake |
| Toblach (Dobbiaco) | A gateway to the Dolomites, Toblach is well-suited for nature lovers and those who appreciate tranquility and outdoor activities. | Lake Toblacher, Drau cycle path, Drei Zinnen (Three Peaks), Hiking and biking trails, Skiing in winter |
| Selva di Val Gardena | A picturesque alpine village with access to the stunning Val Gardena ski area. Attracts both winter sports and summer hiking enthusiasts. | Ski slopes, Val Gardena hiking trails, Puez-Odle Natural Park, Rustic alpine lodges, Cable cars |
| Lana | A small, idyllic town near Merano, known for its apple orchards and wine. Offers a peaceful escape with access to many outdoor activities. | Apple orchards, Wine routes, Hiking trails, Mountain biking, Merano's thermal baths nearby |
Understanding Airbnb License Requirements & STR Laws in Mori (2026)
While Mori, Trentino – Alto Adige/Südtirol, Italy currently shows low STR regulations, specific Airbnb license requirements might still exist or change. Always verify the latest short term rental regulations and Airbnb license requirements directly with local government authorities for Mori to ensure full compliance before hosting.
(Source: AirROI data, 2026, finding no licensed listings among those analyzed)
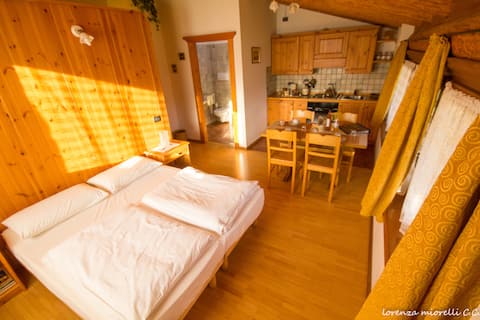
Top Performing Airbnb Properties in Mori (2026)
Benchmark your potential! Explore examples of top-performing Airbnb properties in Moribased on Trailing Twelve Month (TTM) revenue. Analyze their characteristics, revenue, occupancy rate, and ADR to understand what drives success in this market.
Apartment in a detached house
Entire Place • 2 bedrooms
A Casa
Entire Place • 2 bedrooms
Eco-lodge near Lake Garda
Private Room • N/A
At Aunt's House
Entire Place • 1 bedroom
Rustic, Holiday home in the green
Entire Place • 3 bedrooms
Villa Sidonia
Entire Place • 2 bedrooms
Note: Performance varies based on location, size, amenities, seasonality, and management quality. Data reflects the past 12 months.
Top Performing Airbnb Hosts in Mori (2026)
Learn from the best! This table showcases top-performing Airbnb hosts in Mori based on the number of properties managed and estimated total revenue over the past year. Analyze their scale and performance metrics.
| Host Name | Properties | Grossing Revenue | Stay Reviews | Avg Rating |
|---|---|---|---|---|
| Vincenza | 1 | $28,830 | 74 | 4.88/5.0 |
| Virna | 1 | $23,326 | 78 | 5.00/5.0 |
| Katia | 1 | $23,243 | 106 | 4.92/5.0 |
| Denis | 2 | $22,947 | 145 | 4.86/5.0 |
| Massimo | 4 | $19,241 | 15 | 5.00/5.0 |
| Annalisa | 1 | $16,918 | 11 | 5.00/5.0 |
| Francesco | 1 | $15,867 | 74 | 4.85/5.0 |
| Lia | 2 | $14,450 | 3 | Not Rated |
| Filippo | 1 | $8,059 | 16 | 4.94/5.0 |
| Mara | 2 | $4,789 | 47 | 4.89/5.0 |
Analyzing the strategies of top hosts, such as their property selection, pricing, and guest communication, can offer valuable lessons for optimizing your own Airbnb operations in Mori.
Dive Deeper: Advanced Mori STR Market Data (2026)
Ready to unlock more insights? AirROI provides access to advanced metrics and comprehensive Airbnb data for Mori. Explore detailed analytics beyond this report to refine your investment strategy, optimize pricing, and maximize your vacation rental profits.
Explore Advanced MetricsMori Short-Term Rental Market Composition (2026): Property & Room Types
Room Type Distribution
Property Type Distribution
Market Composition Insights for Mori
- The Mori Airbnb market composition is heavily skewed towards Entire Home/Apt listings, which make up 50% of the 18 active rentals. This indicates strong guest preference for privacy and space.
- However, a notable 50% share for Private Rooms suggests opportunities for budget-conscious travelers or hosts renting out spare rooms.
- Looking at the property type distribution in Mori, Apartment/Condo properties are the most common (61.1%), reflecting the local real estate landscape.
- The presence of 33.3% Hotel/Boutique listings indicates integration with traditional hospitality.
Mori Airbnb Room Capacity Analysis (2026): Bedroom Distribution
Distribution of Listings by Number of Bedrooms
Room Capacity Insights for Mori
- The dominant room capacity in Mori is 2 bedrooms listings, making up 33.3% of the market. This suggests a strong demand for properties suitable for couples or solo travelers.
- Together, 2 bedrooms and 3 bedrooms properties represent 44.4% of the active Airbnb listings in Mori, indicating a high concentration in these sizes.
Mori Vacation Rental Guest Capacity Trends (2026)
Distribution of Listings by Guest Capacity
Guest Capacity Insights for Mori
- The most common guest capacity trend in Mori vacation rentals is listings accommodating 6 guests (27.8%). This suggests the primary traveler segment is likely larger groups.
- Properties designed for 6 guests and 2 guests dominate the Mori STR market, accounting for 38.9% of listings.
- 27.8% of properties accommodate 6+ guests, serving the market segment for larger families or group travel in Mori.
- On average, properties in Mori are equipped to host 2.6 guests.
Mori Airbnb Booking Patterns (2026): Available vs. Booked Days
Available Days Distribution
Booked Days Distribution
Booking Pattern Insights for Mori
- The most common availability pattern in Mori falls within the 271-366 days range, representing 66.7% of listings. This suggests many properties have significant open periods on their calendars.
- Approximately 77.8% of listings show high availability (181+ days open annually), indicating potential for increased bookings or specific owner usage patterns.
- For booked days, the 1-30 days range is most frequent in Mori (38.9%), reflecting common guest stay durations or potential owner blocking patterns.
- A notable 22.3% of properties secure long booking periods (181+ days booked per year), highlighting successful long-term rental strategies or significant owner usage.
Mori Airbnb Minimum Stay Requirements Analysis
Distribution of Listings by Minimum Night Requirement
1 Night
5 listings
27.8% of total
2 Nights
5 listings
27.8% of total
3 Nights
1 listings
5.6% of total
7-29 Nights
1 listings
5.6% of total
30+ Nights
6 listings
33.3% of total
Key Insights
- The most prevalent minimum stay requirement in Mori is 30+ Nights, adopted by 33.3% of listings. This highlights the market's preference for longer commitments.
- A significant segment (33.3%) caters to monthly stays (30+ nights) in Mori, pointing to opportunities in the extended-stay market.
Recommendations
- Align with the market by considering a 30+ Nights minimum stay, as 33.3% of Mori hosts use this setting.
- If feasible, allowing 1-night stays, especially midweek or during low season, could capture last-minute bookings, as only 27.8% currently do.
- Explore offering discounts for stays of 30+ nights to attract the 33.3% of the market seeking extended stays.
- Adjust minimum nights based on seasonality – potentially shorter during low season and longer during peak demand periods in Mori.
Mori Airbnb Cancellation Policy Trends Analysis (2026)
Super Strict 30 Days
1 listings
5.6% of total
Flexible
5 listings
27.8% of total
Moderate
9 listings
50% of total
Strict
3 listings
16.7% of total
Cancellation Policy Insights for Mori
- The prevailing Airbnb cancellation policy trend in Mori is Moderate, used by 50% of listings.
- The market strongly favors guest-friendly terms, with 77.8% of listings offering Flexible or Moderate policies. This suggests guests in Mori may expect booking flexibility.
Recommendations for Hosts
- Consider adopting a Moderate policy to align with the 50% market standard in Mori.
- Regularly review your cancellation policy against competitors and market demand shifts in Mori.
Mori STR Booking Lead Time Analysis (2026)
Average Booking Lead Time by Month
Booking Lead Time Insights for Mori
- The overall average booking lead time for vacation rentals in Mori is 64 days.
- Guests book furthest in advance for stays during July (average 85 days), likely coinciding with peak travel demand or local events.
- The shortest booking windows occur for stays in March (average 8 days), indicating more last-minute travel plans during this time.
- Seasonally, Summer (80 days avg.) sees the longest lead times, while Spring (37 days avg.) has the shortest, reflecting typical travel planning cycles.
Recommendations for Hosts
- Use the overall average lead time (64 days) as a baseline for your pricing and availability strategy in Mori.
- For July stays, consider implementing length-of-stay discounts or slightly higher rates for bookings made less than 85 days out to capitalize on advance planning.
- During March, focus on last-minute booking availability and promotions, as guests book with very short notice (8 days avg.).
- Target marketing efforts for the Summer season well in advance (at least 80 days) to capture early planners.
- Monitor your own booking lead times against these Mori averages to identify opportunities for dynamic pricing adjustments.
Popular & Essential Airbnb Amenities in Mori (2026)
Amenity Prevalence
Amenity Insights for Mori
- Essential amenities in Mori that guests expect include: Hot water. Lacking these (this) could significantly impact bookings.
- Popular amenities like Hangers, Wifi, Heating are common but not universal. Offering these can provide a competitive edge.
- Warning: Wifi is not universally provided but is considered essential globally. Ensure reliable Wifi is offered.
Recommendations for Hosts
- Ensure your listing includes all essential amenities for Mori: Hot water.
- Consider adding popular differentiators like Hangers or Wifi to increase appeal.
- Highlight unique or less common amenities you offer (e.g., hot tub, dedicated workspace, EV charger) in your listing description and photos.
- Regularly check competitor amenities in Mori to stay competitive.
Mori Airbnb Guest Demographics & Profile Analysis (2026)
Guest Profile Summary for Mori
- The typical guest profile for Airbnb in Mori consists of predominantly international visitors (74%), with top international origins including Italy, typically belonging to the Post-2000s (Gen Z/Alpha) group (50%), primarily speaking English or German.
- Domestic travelers account for 26.4% of guests.
- Key international markets include Germany (35.8%) and Italy (26.4%).
- Top languages spoken are English (39.5%) followed by German (21%).
- A significant demographic segment is the Post-2000s (Gen Z/Alpha) group, representing 50% of guests.
Recommendations for Hosts
- Focus marketing internationally, particularly towards travelers from Italy.
- Tailor amenities and listing descriptions to appeal to the dominant Post-2000s (Gen Z/Alpha) demographic (e.g., highlight fast WiFi, smart home features, local guides).
- Highlight unique local experiences or amenities relevant to the primary guest profile.
- Consider seasonal promotions aligned with peak travel times for key origin markets.
Nearby Short-Term Rental Market Comparison
How does the Mori Airbnb market stack up against its neighbors? Compare key performance metrics like average monthly revenue, ADR, and occupancy rates in surrounding areas to understand the broader regional STR landscape.
| Market | Active Properties | Monthly Revenue | Daily Rate | Avg. Occupancy |
|---|---|---|---|---|
| Moos in Passeier - Moso in Passiria | 17 | $4,931 | $594.63 | 28% |
| Urtijëi - St. Ulrich in Gröden - Ortisei | 165 | $4,558 | $662.76 | 41% |
| Laglio | 62 | $4,308 | $523.82 | 42% |
| Sala Comacina | 71 | $3,968 | $436.18 | 46% |
| Sankt Pankraz - San Pancrazio | 16 | $3,547 | $647.34 | 21% |
| Brenzone sul Garda | 21 | $3,526 | $327.85 | 43% |
| Carate Urio | 71 | $3,457 | $371.25 | 42% |
| Varenna | 219 | $3,394 | $283.46 | 53% |
| Portofino | 74 | $3,321 | $499.07 | 39% |
| Sankt Moritz | 241 | $3,257 | $402.90 | 39% |