Amelia Airbnb Market Analysis 2026: Short Term Rental Data & Vacation Rental Statistics in Umbria, Italy
Is Airbnb profitable in Amelia in 2026? Explore comprehensive Airbnb analytics for Amelia, Umbria, Italy to uncover income potential. This 2026 STR market report for Amelia, based on AirROI data from February 2025 to January 2026, reveals key trends in the niche market of 86 active listings.
Whether you're considering an Airbnb investment in Amelia, optimizing your existing vacation rental, or exploring rental arbitrage opportunities, understanding the Amelia Airbnb data is crucial. Navigating the high regulation landscape is key to maximizing your short term rental income potential. Let's dive into the specifics.
Key Amelia Airbnb Performance Metrics Overview
Monthly Airbnb Revenue Variations & Income Potential in Amelia (2026)
Understanding the monthly revenue variations for Airbnb listings in Amelia is key to maximizing your short term rental income potential. Seasonality significantly impacts earnings. Our analysis, based on data from the past 12 months, shows that the peak revenue month for STRs in Amelia is typically August, while January often presents the lowest earnings, highlighting opportunities for strategic pricing adjustments during shoulder and low seasons. Explore the typical Airbnb income in Amelia across different performance tiers:
- Best-in-class properties (Top 10%) achieve $5,357+ monthly, often utilizing dynamic pricing and superior guest experiences.
- Strong performing properties (Top 25%) earn $2,798 or more, indicating effective management and desirable locations/amenities.
- Typical properties (Median) generate around $909 per month, representing the average market performance.
- Entry-level properties (Bottom 25%) see earnings around $323, often with potential for optimization.
Average Monthly Airbnb Earnings Trend in Amelia
Amelia Airbnb Occupancy Rate Trends (2026)
Maximize your bookings by understanding the Amelia STR occupancy trends. Seasonal demand shifts significantly influence how often properties are booked. Typically, Augustsees the highest demand (peak season occupancy), while January experiences the lowest (low season). Effective strategies, like adjusting minimum stays or offering promotions, can boost occupancy during slower periods. Here's how different property tiers perform in Amelia:
- Best-in-class properties (Top 10%) achieve 50%+ occupancy, indicating high desirability and potentially optimized availability.
- Strong performing properties (Top 25%) maintain 36% or higher occupancy, suggesting good market fit and guest satisfaction.
- Typical properties (Median) have an occupancy rate around 19%.
- Entry-level properties (Bottom 25%) average 7% occupancy, potentially facing higher vacancy.
Average Monthly Occupancy Rate Trend in Amelia
Average Daily Rate (ADR) Airbnb Trends in Amelia (2026)
Effective short term rental pricing strategy in Amelia involves understanding monthly ADR fluctuations. The Average Daily Rate (ADR) for Airbnb in Amelia typically peaks in August and dips lowest during February. Leveraging Airbnb dynamic pricing tools or strategies based on this seasonality can significantly boost revenue. Here's a look at the typical nightly rates achieved:
- Best-in-class properties (Top 10%) command rates of $533+ per night, often due to premium features or locations.
- Strong performing properties (Top 25%) achieve nightly rates of $326 or more.
- Typical properties (Median) charge around $144 per night.
- Entry-level properties (Bottom 25%) earn around $88 per night.
Average Daily Rate (ADR) Trend by Month in Amelia
Get Live Amelia Market Intelligence 👇

Explore Real-time Analytics
Airbnb Seasonality Analysis & Trends in Amelia (2026)
Peak Season (August, July, September)
- Revenue averages $3,702 per month
- Occupancy rates average 40.0%
- Daily rates average $254
Shoulder Season
- Revenue averages $1,802 per month
- Occupancy maintains around 21.2%
- Daily rates hold near $246
Low Season (January, February, December)
- Revenue drops to average $921 per month
- Occupancy decreases to average 13.8%
- Daily rates adjust to average $247
Seasonality Insights for Amelia
- The Airbnb seasonality in Amelia shows highly seasonal trends requiring careful strategy. While the sections above show seasonal averages, it's also insightful to look at the extremes:
- During the high season, the absolute peak month showcases Amelia's highest earning potential, with monthly revenues capable of climbing to $4,620, occupancy reaching a high of 43.6%, and ADRs peaking at $256.
- Conversely, the slowest single month of the year, typically falling within the low season, marks the market's lowest point. In this month, revenue might dip to $701, occupancy could drop to 9.8%, and ADRs may adjust down to $242.
- Understanding both the seasonal averages and these monthly peaks and troughs in revenue, occupancy, and ADR is crucial for maximizing your Airbnb profit potential in Amelia.
Seasonal Strategies for Maximizing Profit
- Peak Season: Maximize revenue through premium pricing and potentially longer minimum stays. Ensure high availability.
- Low Season: Offer competitive pricing, special promotions (e.g., extended stay discounts), and flexible cancellation policies. Target off-season travelers like remote workers or budget-conscious guests.
- Shoulder Seasons: Implement dynamic pricing that balances peak and low rates. Target weekend travelers or specific events. Offer slightly more flexible terms than peak season.
- Regularly analyze your own performance against these Amelia seasonality benchmarks and adjust your pricing and availability strategy accordingly.
Best Areas for Airbnb Investment in Amelia (2026)
Exploring the top neighborhoods for short-term rentals in Amelia? This section highlights key areas, outlining why they are attractive for hosts and guests, along with notable local attractions. Consider these locations based on your target guest profile and investment strategy.
| Neighborhood / Area | Why Host Here? (Target Guests & Appeal) | Key Attractions & Landmarks |
|---|---|---|
| Perugia | The capital of Umbria, known for its historic architecture and vibrant cultural scene. A hub for tourists exploring the region with many attractions and events throughout the year. | Piazza IV Novembre, Rocca Paolina, Umbria Jazz Festival, Perugia National Gallery of Umbria, Etruscan Well |
| Assisi | Famous for its religious significance and stunning architecture, Assisi attracts visitors for its history and serene atmosphere. A perfect spot for guests seeking a spiritual retreat. | Basilica of Saint Francis, Papal Basilica of Saint Mary of the Angels, Eremo delle Carceri, Monte Subasio, Assisi's medieval streets |
| Spoleto | Known for its historic sites and annual music festival, Spoleto offers a picturesque setting and cultural richness, appealing to travelers interested in art and history. | Rocca Albornoziana, Spoleto Cathedral, Ponte delle Torri, Festival dei Due Mondi, Teatro Nuovo Giordano |
| Orvieto | Perched on a hilltop, Orvieto is famous for its stunning cathedral and underground tunnels. A sought-after location for tourists who appreciate history and breathtaking views. | Orvieto Cathedral, St. Patrick's Well, Orvieto Underground, Torre del Moro, Palazzo del Popolo |
| Todi | A medieval town that offers a charming atmosphere and scenic landscapes. Todi is popular among travelers looking for a quaint getaway with rich history. | Piazza del Popolo, Cathedral of Todi, Tempio di Santa Maria della Consolazione, Giardini Comunali, Etruscan Ruins |
| Gubbio | Known for its rich history and medieval architecture, Gubbio captures the essence of Umbria with its charming streets and festivals, appealing to culture enthusiasts. | Piazza della Signoria, Gubbio's Roman Theater, Palazzo dei Consoli, Funivia Colle Eletto, Festa dei Ceri |
| Città di Castello | Home to beautiful Renaissance art and a vibrant local community, Città di Castello attracts visitors for its galleries and cultural experiences. | Pomario di Città di Castello, Museo di Sanseverino, Cattedrale di San Florido, Palazzo Vitelli alla Cannoniera, Historical center |
| Lake Trasimeno | An idyllic lake area known for its scenic beauty and outdoor activities, making it an attractive destination for those seeking relaxation and nature. | Isola Maggiore, Castiglione del Lago, Lakeside beaches, Tramonti sul Lago, Birdwatching sites |
Understanding Airbnb License Requirements & STR Laws in Amelia (2026)
Yes, Amelia, Umbria, Italy enforces high STR regulations. Obtaining a license and ensuring compliance is almost certainly required according to current 2026 STR laws. Always verify the latest short term rental regulations and Airbnb license requirements directly with local government authorities for Amelia to ensure full compliance before hosting.
(Source: AirROI data, 2026, based on 88% licensed listings)
Top Performing Airbnb Properties in Amelia (2026)
Benchmark your potential! Explore examples of top-performing Airbnb properties in Ameliabased on Trailing Twelve Month (TTM) revenue. Analyze their characteristics, revenue, occupancy rate, and ADR to understand what drives success in this market.
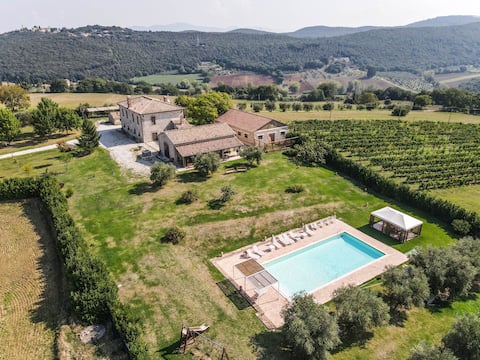
Detached villa with private pool 2km from village.
Entire Place • 5 bedrooms
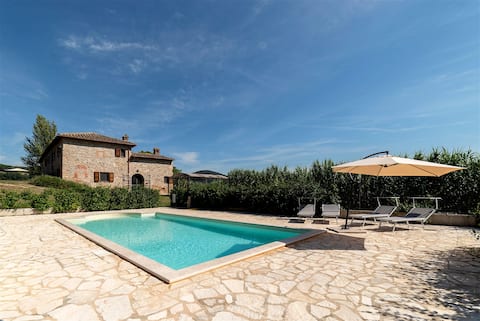
Traditional Umbria Stone House with private pool
Entire Place • 8 bedrooms
Lovely home in Amelia with kitchen
Entire Place • 3 bedrooms
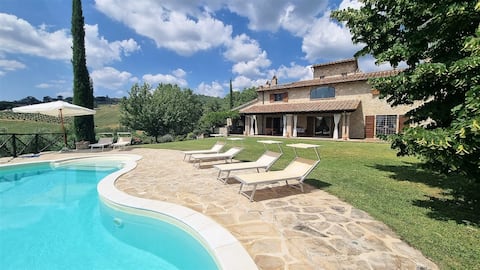
Getaway to Umbria, the Scarsine farmhouse
Entire Place • 5 bedrooms
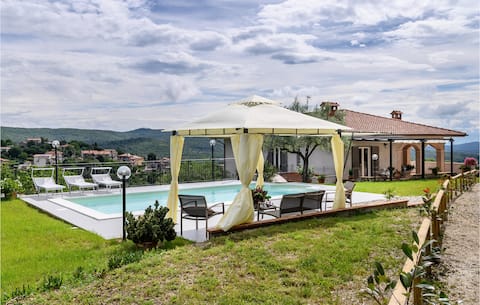
Villa Miranda - Umbria holiday home
Entire Place • 3 bedrooms

Getaway to Umbria, Casale Piccino
Entire Place • 6 bedrooms
Note: Performance varies based on location, size, amenities, seasonality, and management quality. Data reflects the past 12 months.
Top Performing Airbnb Hosts in Amelia (2026)
Learn from the best! This table showcases top-performing Airbnb hosts in Amelia based on the number of properties managed and estimated total revenue over the past year. Analyze their scale and performance metrics.
| Host Name | Properties | Grossing Revenue | Stay Reviews | Avg Rating |
|---|---|---|---|---|
| Guido Paul | 9 | $274,233 | 75 | 4.86/5.0 |
| Scappo In Umbria | 11 | $149,000 | 84 | 4.72/5.0 |
| Ginevra | 1 | $66,789 | 6 | 5.00/5.0 |
| Novasol | 1 | $61,747 | 11 | 4.73/5.0 |
| Leonardo | 1 | $59,585 | 36 | 4.86/5.0 |
| Charlotte | 1 | $59,041 | 22 | 4.95/5.0 |
| Leonardo | 1 | $58,800 | 25 | 5.00/5.0 |
| Annalodovica | 3 | $57,843 | 10 | 5.00/5.0 |
| Andrea | 1 | $49,213 | 4 | 5.00/5.0 |
| Margherita | 1 | $40,331 | 54 | 4.94/5.0 |
Analyzing the strategies of top hosts, such as their property selection, pricing, and guest communication, can offer valuable lessons for optimizing your own Airbnb operations in Amelia.
Dive Deeper: Advanced Amelia STR Market Data (2026)
Ready to unlock more insights? AirROI provides access to advanced metrics and comprehensive Airbnb data for Amelia. Explore detailed analytics beyond this report to refine your investment strategy, optimize pricing, and maximize your vacation rental profits.
Explore Advanced MetricsAmelia Short-Term Rental Market Composition (2026): Property & Room Types
Room Type Distribution
Property Type Distribution
Market Composition Insights for Amelia
- The Amelia Airbnb market composition is heavily skewed towards Entire Home/Apt listings, which make up 93% of the 86 active rentals. This indicates strong guest preference for privacy and space.
- Looking at the property type distribution in Amelia, House properties are the most common (65.1%), reflecting the local real estate landscape.
- Houses represent a significant 65.1% portion, catering likely to families or larger groups.
- Smaller segments like hotel/boutique (combined 3.5%) offer potential for unique stay experiences.
Amelia Airbnb Room Capacity Analysis (2026): Bedroom Distribution
Distribution of Listings by Number of Bedrooms
Room Capacity Insights for Amelia
- The dominant room capacity in Amelia is 1 bedroom listings, making up 23.3% of the market. This suggests a strong demand for properties suitable for couples or solo travelers.
- Together, 1 bedroom and 2 bedrooms properties represent 44.2% of the active Airbnb listings in Amelia, indicating a high concentration in these sizes.
- A significant 48.8% of listings offer 3+ bedrooms, catering to larger groups and families seeking more space in Amelia.
Amelia Vacation Rental Guest Capacity Trends (2026)
Distribution of Listings by Guest Capacity
Guest Capacity Insights for Amelia
- The most common guest capacity trend in Amelia vacation rentals is listings accommodating 8+ guests (37.2%). This suggests the primary traveler segment is likely larger groups.
- Properties designed for 8+ guests and 4 guests dominate the Amelia STR market, accounting for 55.8% of listings.
- 51.1% of properties accommodate 6+ guests, serving the market segment for larger families or group travel in Amelia.
- On average, properties in Amelia are equipped to host 5.3 guests.
Amelia Airbnb Booking Patterns (2026): Available vs. Booked Days
Available Days Distribution
Booked Days Distribution
Booking Pattern Insights for Amelia
- The most common availability pattern in Amelia falls within the 271-366 days range, representing 77.9% of listings. This suggests many properties have significant open periods on their calendars.
- Approximately 96.5% of listings show high availability (181+ days open annually), indicating potential for increased bookings or specific owner usage patterns.
- For booked days, the 1-30 days range is most frequent in Amelia (43%), reflecting common guest stay durations or potential owner blocking patterns.
- A notable 3.5% of properties secure long booking periods (181+ days booked per year), highlighting successful long-term rental strategies or significant owner usage.
Amelia Airbnb Minimum Stay Requirements Analysis
Distribution of Listings by Minimum Night Requirement
1 Night
14 listings
16.3% of total
2 Nights
11 listings
12.8% of total
3 Nights
4 listings
4.7% of total
4-6 Nights
13 listings
15.1% of total
7-29 Nights
11 listings
12.8% of total
30+ Nights
33 listings
38.4% of total
Key Insights
- The most prevalent minimum stay requirement in Amelia is 30+ Nights, adopted by 38.4% of listings. This highlights the market's preference for longer commitments.
- A significant segment (38.4%) caters to monthly stays (30+ nights) in Amelia, pointing to opportunities in the extended-stay market.
Recommendations
- Align with the market by considering a 30+ Nights minimum stay, as 38.4% of Amelia hosts use this setting.
- If feasible, allowing 1-night stays, especially midweek or during low season, could capture last-minute bookings, as only 16.3% currently do.
- Explore offering discounts for stays of 30+ nights to attract the 38.4% of the market seeking extended stays.
- Adjust minimum nights based on seasonality – potentially shorter during low season and longer during peak demand periods in Amelia.
Amelia Airbnb Cancellation Policy Trends Analysis (2026)
Super Strict 60 Days
6 listings
7% of total
Super Strict 30 Days
2 listings
2.3% of total
Flexible
25 listings
29.1% of total
Moderate
15 listings
17.4% of total
Firm
28 listings
32.6% of total
Strict
10 listings
11.6% of total
Cancellation Policy Insights for Amelia
- The prevailing Airbnb cancellation policy trend in Amelia is Firm, used by 32.6% of listings.
- There's a relatively balanced mix between guest-friendly (46.5%) and stricter (44.2%) policies, offering choices for different guest needs.
Recommendations for Hosts
- Consider adopting a Firm policy to align with the 32.6% market standard in Amelia.
- Using a Strict policy might deter some guests, as only 11.6% of listings use it. Evaluate if potential revenue protection outweighs possible lower booking rates.
- Regularly review your cancellation policy against competitors and market demand shifts in Amelia.
Amelia STR Booking Lead Time Analysis (2026)
Average Booking Lead Time by Month
Booking Lead Time Insights for Amelia
- The overall average booking lead time for vacation rentals in Amelia is 39 days.
- Guests book furthest in advance for stays during August (average 74 days), likely coinciding with peak travel demand or local events.
- The shortest booking windows occur for stays in January (average 18 days), indicating more last-minute travel plans during this time.
- Seasonally, Summer (55 days avg.) sees the longest lead times, while Winter (25 days avg.) has the shortest, reflecting typical travel planning cycles.
Recommendations for Hosts
- Use the overall average lead time (39 days) as a baseline for your pricing and availability strategy in Amelia.
- For August stays, consider implementing length-of-stay discounts or slightly higher rates for bookings made less than 74 days out to capitalize on advance planning.
- Target marketing efforts for the Summer season well in advance (at least 55 days) to capture early planners.
- Monitor your own booking lead times against these Amelia averages to identify opportunities for dynamic pricing adjustments.
Popular & Essential Airbnb Amenities in Amelia (2026)
Amenity Prevalence
Amenity Insights for Amelia
- Essential amenities in Amelia that guests expect include: Kitchen. Lacking these (this) could significantly impact bookings.
- Popular amenities like Heating, Hair dryer, Hot water are common but not universal. Offering these can provide a competitive edge.
- Warning: Wifi is not universally provided but is considered essential globally. Ensure reliable Wifi is offered.
Recommendations for Hosts
- Ensure your listing includes all essential amenities for Amelia: Kitchen.
- Prioritize adding missing essentials: Kitchen.
- Consider adding popular differentiators like Heating or Hair dryer to increase appeal.
- Highlight unique or less common amenities you offer (e.g., hot tub, dedicated workspace, EV charger) in your listing description and photos.
- Regularly check competitor amenities in Amelia to stay competitive.
Amelia Airbnb Guest Demographics & Profile Analysis (2026)
Guest Profile Summary for Amelia
- The typical guest profile for Airbnb in Amelia consists of a mix of domestic (42%) and international guests, with top international origins including United Kingdom, typically belonging to the Post-2000s (Gen Z/Alpha) group (50%), primarily speaking English or Italian.
- Domestic travelers account for 41.8% of guests.
- Key international markets include Italy (41.8%) and United Kingdom (14.7%).
- Top languages spoken are English (38.8%) followed by Italian (21.3%).
- A significant demographic segment is the Post-2000s (Gen Z/Alpha) group, representing 50% of guests.
Recommendations for Hosts
- Balance marketing efforts between domestic and international channels based on the guest mix.
- Tailor amenities and listing descriptions to appeal to the dominant Post-2000s (Gen Z/Alpha) demographic (e.g., highlight fast WiFi, smart home features, local guides).
- Highlight unique local experiences or amenities relevant to the primary guest profile.
- Consider seasonal promotions aligned with peak travel times for key origin markets.
Nearby Short-Term Rental Market Comparison
How does the Amelia Airbnb market stack up against its neighbors? Compare key performance metrics like average monthly revenue, ADR, and occupancy rates in surrounding areas to understand the broader regional STR landscape.
| Market | Active Properties | Monthly Revenue | Daily Rate | Avg. Occupancy |
|---|---|---|---|---|
| Tignano | 12 | $4,160 | $366.92 | 45% |
| Celleno | 13 | $4,041 | $594.80 | 28% |
| Marciano della Chiana | 17 | $3,823 | $545.25 | 35% |
| Buonconvento | 60 | $3,186 | $440.58 | 43% |
| Collevecchio | 14 | $3,140 | $334.97 | 40% |
| Radda in Chianti | 94 | $3,098 | $361.57 | 39% |
| Palombara Sabina | 15 | $2,914 | $309.11 | 38% |
| Impruneta | 146 | $2,887 | $297.45 | 40% |
| Rome | 26,470 | $2,817 | $217.07 | 50% |
| Lastra a Signa | 96 | $2,760 | $311.91 | 43% |