Massa Martana Airbnb Market Analysis 2026: Short Term Rental Data & Vacation Rental Statistics in Umbria, Italy
Is Airbnb profitable in Massa Martana in 2026? Explore comprehensive Airbnb analytics for Massa Martana, Umbria, Italy to uncover income potential. This 2026 STR market report for Massa Martana, based on AirROI data from February 2025 to January 2026, reveals key trends in the niche market of 26 active listings.
Whether you're considering an Airbnb investment in Massa Martana, optimizing your existing vacation rental, or exploring rental arbitrage opportunities, understanding the Massa Martana Airbnb data is crucial. Navigating the high regulation landscape is key to maximizing your short term rental income potential. Let's dive into the specifics.
Key Massa Martana Airbnb Performance Metrics Overview
Monthly Airbnb Revenue Variations & Income Potential in Massa Martana (2026)
Understanding the monthly revenue variations for Airbnb listings in Massa Martana is key to maximizing your short term rental income potential. Seasonality significantly impacts earnings. Our analysis, based on data from the past 12 months, shows that the peak revenue month for STRs in Massa Martana is typically August, while February often presents the lowest earnings, highlighting opportunities for strategic pricing adjustments during shoulder and low seasons. Explore the typical Airbnb income in Massa Martana across different performance tiers:
- Best-in-class properties (Top 10%) achieve $7,782+ monthly, often utilizing dynamic pricing and superior guest experiences.
- Strong performing properties (Top 25%) earn $4,381 or more, indicating effective management and desirable locations/amenities.
- Typical properties (Median) generate around $1,562 per month, representing the average market performance.
- Entry-level properties (Bottom 25%) see earnings around $604, often with potential for optimization.
Average Monthly Airbnb Earnings Trend in Massa Martana
Massa Martana Airbnb Occupancy Rate Trends (2026)
Maximize your bookings by understanding the Massa Martana STR occupancy trends. Seasonal demand shifts significantly influence how often properties are booked. Typically, Augustsees the highest demand (peak season occupancy), while May experiences the lowest (low season). Effective strategies, like adjusting minimum stays or offering promotions, can boost occupancy during slower periods. Here's how different property tiers perform in Massa Martana:
- Best-in-class properties (Top 10%) achieve 63%+ occupancy, indicating high desirability and potentially optimized availability.
- Strong performing properties (Top 25%) maintain 46% or higher occupancy, suggesting good market fit and guest satisfaction.
- Typical properties (Median) have an occupancy rate around 28%.
- Entry-level properties (Bottom 25%) average 16% occupancy, potentially facing higher vacancy.
Average Monthly Occupancy Rate Trend in Massa Martana
Average Daily Rate (ADR) Airbnb Trends in Massa Martana (2026)
Effective short term rental pricing strategy in Massa Martana involves understanding monthly ADR fluctuations. The Average Daily Rate (ADR) for Airbnb in Massa Martana typically peaks in September and dips lowest during March. Leveraging Airbnb dynamic pricing tools or strategies based on this seasonality can significantly boost revenue. Here's a look at the typical nightly rates achieved:
- Best-in-class properties (Top 10%) command rates of $583+ per night, often due to premium features or locations.
- Strong performing properties (Top 25%) achieve nightly rates of $338 or more.
- Typical properties (Median) charge around $129 per night.
- Entry-level properties (Bottom 25%) earn around $87 per night.
Average Daily Rate (ADR) Trend by Month in Massa Martana
Get Live Massa Martana Market Intelligence 👇

Explore Real-time Analytics
Airbnb Seasonality Analysis & Trends in Massa Martana (2026)
Peak Season (August, July, September)
- Revenue averages $6,646 per month
- Occupancy rates average 52.7%
- Daily rates average $275
Shoulder Season
- Revenue averages $2,558 per month
- Occupancy maintains around 29.8%
- Daily rates hold near $246
Low Season (January, February, May)
- Revenue drops to average $1,034 per month
- Occupancy decreases to average 20.4%
- Daily rates adjust to average $239
Seasonality Insights for Massa Martana
- The Airbnb seasonality in Massa Martana shows highly seasonal trends requiring careful strategy. While the sections above show seasonal averages, it's also insightful to look at the extremes:
- During the high season, the absolute peak month showcases Massa Martana's highest earning potential, with monthly revenues capable of climbing to $8,473, occupancy reaching a high of 69.1%, and ADRs peaking at $315.
- Conversely, the slowest single month of the year, typically falling within the low season, marks the market's lowest point. In this month, revenue might dip to $762, occupancy could drop to 19.4%, and ADRs may adjust down to $223.
- Understanding both the seasonal averages and these monthly peaks and troughs in revenue, occupancy, and ADR is crucial for maximizing your Airbnb profit potential in Massa Martana.
Seasonal Strategies for Maximizing Profit
- Peak Season: Maximize revenue through premium pricing and potentially longer minimum stays. Ensure high availability.
- Low Season: Offer competitive pricing, special promotions (e.g., extended stay discounts), and flexible cancellation policies. Target off-season travelers like remote workers or budget-conscious guests.
- Shoulder Seasons: Implement dynamic pricing that balances peak and low rates. Target weekend travelers or specific events. Offer slightly more flexible terms than peak season.
- Regularly analyze your own performance against these Massa Martana seasonality benchmarks and adjust your pricing and availability strategy accordingly.
Best Areas for Airbnb Investment in Massa Martana (2026)
Exploring the top neighborhoods for short-term rentals in Massa Martana? This section highlights key areas, outlining why they are attractive for hosts and guests, along with notable local attractions. Consider these locations based on your target guest profile and investment strategy.
| Neighborhood / Area | Why Host Here? (Target Guests & Appeal) | Key Attractions & Landmarks |
|---|---|---|
| Massa Martana Centro | The historical center of Massa Martana offers charming streets, ancient ruins, and a sense of Italian heritage, making it appealing for tourists seeking authentic experiences. | San Bartolomeo Church, Rocca di Massa Martana, Local restaurants, Historic buildings, Scenic views |
| Via di San Lorenzo | A quiet street that offers a scenic and peaceful environment while still being close to the town's main amenities and attractions. | Local cafes, Walking pathways, Nature views, Traditional markets |
| Parco Fluviale del Tevere | A beautiful natural park along the Tiber River, perfect for outdoor enthusiasts and families looking for recreational activities and nature experiences. | Walking and biking trails, Picnic spots, Wildlife watching, River activities |
| Collevalenza | Famous for the Sanctuary of Collevalenza, this area attracts pilgrims and visitors seeking a spiritual experience in a serene setting. | Sanctuary of Collevalenza, Charming countryside, Peaceful atmosphere |
| Monte Maggiore | Known for its stunning panoramic views and hiking opportunities, Monte Maggiore is perfect for nature lovers and adventure seekers. | Hiking paths, Amazing overlooks, Natural scenery |
| Borgo di Massa Martana | This small village within Massa Martana is quaint and picturesque, offering a tranquil stay with a rich sense of local culture. | Traditional architecture, Local festivals, Community events |
| Todi | Nearby Todi is a beautiful Etruscan town known for its Renaissance architecture, perfect for tourists wanting to explore historic sites. | Piazza del Popolo, Tempio di Santa Maria della Consolazione, Ancient walls, Art galleries, Cultural events |
| Spoleto | A larger town nearby known for its historical significance and festivals, attracting a diverse range of visitors. | Ponte delle Torri, Spoleto Cathedral, Festival dei Due Mondi, Roman ruins, Art and culture |
Understanding Airbnb License Requirements & STR Laws in Massa Martana (2026)
Yes, Massa Martana, Umbria, Italy enforces high STR regulations. Obtaining a license and ensuring compliance is almost certainly required according to current 2026 STR laws. Always verify the latest short term rental regulations and Airbnb license requirements directly with local government authorities for Massa Martana to ensure full compliance before hosting.
(Source: AirROI data, 2026, based on 88% licensed listings)
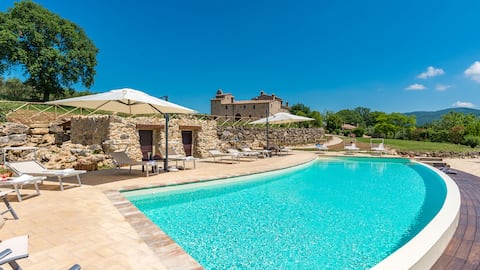
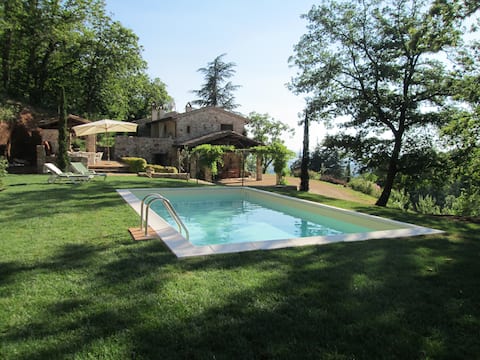
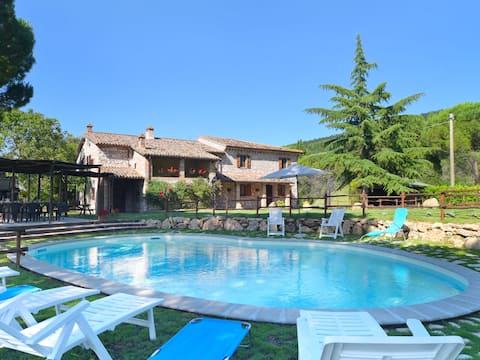
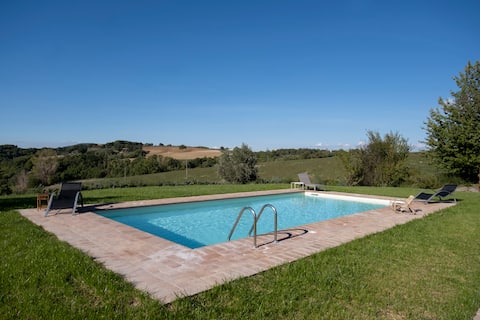
Top Performing Airbnb Properties in Massa Martana (2026)
Benchmark your potential! Explore examples of top-performing Airbnb properties in Massa Martanabased on Trailing Twelve Month (TTM) revenue. Analyze their characteristics, revenue, occupancy rate, and ADR to understand what drives success in this market.
Santa Illuminata 20, Emma Villas
Entire Place • 10 bedrooms

Todi Luxury casale with view : Casa Martana
Entire Place • 5 bedrooms
Casale del Gallo in Todi, Umbria
Entire Place • 5 bedrooms
Vepres by Interhome
Entire Place • 4 bedrooms
Umbria Todi Private Pool Amazing View and Starlink
Entire Place • 4 bedrooms
Villa Vocabolo Casamonti
Entire Place • 4 bedrooms
Note: Performance varies based on location, size, amenities, seasonality, and management quality. Data reflects the past 12 months.
Top Performing Airbnb Hosts in Massa Martana (2026)
Learn from the best! This table showcases top-performing Airbnb hosts in Massa Martana based on the number of properties managed and estimated total revenue over the past year. Analyze their scale and performance metrics.
| Host Name | Properties | Grossing Revenue | Stay Reviews | Avg Rating |
|---|---|---|---|---|
| Emma | 2 | $154,289 | 3 | Not Rated |
| Eralda | 1 | $94,715 | 20 | 4.90/5.0 |
| Alessandra - Interhome | 2 | $90,262 | 19 | 4.73/5.0 |
| Patrizia | 1 | $74,778 | 72 | 4.92/5.0 |
| Giovanni | 1 | $45,968 | 32 | 4.88/5.0 |
| Luana | 1 | $44,152 | 6 | 4.50/5.0 |
| Limor | 1 | $40,305 | 16 | 4.75/5.0 |
| Elisabetta | 1 | $34,648 | 201 | 4.95/5.0 |
| Annalisa | 1 | $30,994 | 16 | 4.94/5.0 |
| Marco | 1 | $21,036 | 24 | 4.92/5.0 |
Analyzing the strategies of top hosts, such as their property selection, pricing, and guest communication, can offer valuable lessons for optimizing your own Airbnb operations in Massa Martana.
Dive Deeper: Advanced Massa Martana STR Market Data (2026)
Ready to unlock more insights? AirROI provides access to advanced metrics and comprehensive Airbnb data for Massa Martana. Explore detailed analytics beyond this report to refine your investment strategy, optimize pricing, and maximize your vacation rental profits.
Explore Advanced MetricsMassa Martana Short-Term Rental Market Composition (2026): Property & Room Types
Room Type Distribution
Property Type Distribution
Market Composition Insights for Massa Martana
- The Massa Martana Airbnb market composition is heavily skewed towards Entire Home/Apt listings, which make up 100% of the 26 active rentals. This indicates strong guest preference for privacy and space.
- Looking at the property type distribution in Massa Martana, House properties are the most common (69.2%), reflecting the local real estate landscape.
- Houses represent a significant 69.2% portion, catering likely to families or larger groups.
- Smaller segments like outdoor/unique (combined 3.8%) offer potential for unique stay experiences.
Massa Martana Airbnb Room Capacity Analysis (2026): Bedroom Distribution
Distribution of Listings by Number of Bedrooms
Room Capacity Insights for Massa Martana
- The dominant room capacity in Massa Martana is 4 bedrooms listings, making up 26.9% of the market. This suggests a strong demand for properties suitable for families or small groups.
- Together, 4 bedrooms and 5+ bedrooms properties represent 50.0% of the active Airbnb listings in Massa Martana, indicating a high concentration in these sizes.
- A significant 57.7% of listings offer 3+ bedrooms, catering to larger groups and families seeking more space in Massa Martana.
Massa Martana Vacation Rental Guest Capacity Trends (2026)
Distribution of Listings by Guest Capacity
Guest Capacity Insights for Massa Martana
- The most common guest capacity trend in Massa Martana vacation rentals is listings accommodating 8+ guests (50%). This suggests the primary traveler segment is likely larger groups.
- Properties designed for 8+ guests and 5 guests dominate the Massa Martana STR market, accounting for 65.4% of listings.
- 57.6% of properties accommodate 6+ guests, serving the market segment for larger families or group travel in Massa Martana.
- On average, properties in Massa Martana are equipped to host 6.1 guests.
Massa Martana Airbnb Booking Patterns (2026): Available vs. Booked Days
Available Days Distribution
Booked Days Distribution
Booking Pattern Insights for Massa Martana
- The most common availability pattern in Massa Martana falls within the 271-366 days range, representing 69.2% of listings. This suggests many properties have significant open periods on their calendars.
- Approximately 92.3% of listings show high availability (181+ days open annually), indicating potential for increased bookings or specific owner usage patterns.
- For booked days, the 31-90 days range is most frequent in Massa Martana (57.7%), reflecting common guest stay durations or potential owner blocking patterns.
- A notable 7.7% of properties secure long booking periods (181+ days booked per year), highlighting successful long-term rental strategies or significant owner usage.
Massa Martana Airbnb Minimum Stay Requirements Analysis
Distribution of Listings by Minimum Night Requirement
1 Night
2 listings
7.7% of total
2 Nights
9 listings
34.6% of total
3 Nights
3 listings
11.5% of total
4-6 Nights
3 listings
11.5% of total
30+ Nights
9 listings
34.6% of total
Key Insights
- The most prevalent minimum stay requirement in Massa Martana is 2 Nights, adopted by 34.6% of listings. This highlights the market's preference for shorter, flexible bookings.
- A significant segment (34.6%) caters to monthly stays (30+ nights) in Massa Martana, pointing to opportunities in the extended-stay market.
Recommendations
- Align with the market by considering a 2 Nights minimum stay, as 34.6% of Massa Martana hosts use this setting.
- If feasible, allowing 1-night stays, especially midweek or during low season, could capture last-minute bookings, as only 7.7% currently do.
- A 2-night minimum appears standard (34.6%). Consider this for weekends or peak periods.
- Explore offering discounts for stays of 30+ nights to attract the 34.6% of the market seeking extended stays.
- Adjust minimum nights based on seasonality – potentially shorter during low season and longer during peak demand periods in Massa Martana.
Massa Martana Airbnb Cancellation Policy Trends Analysis (2026)
Super Strict 60 Days
1 listings
3.8% of total
Flexible
1 listings
3.8% of total
Moderate
15 listings
57.7% of total
Firm
9 listings
34.6% of total
Cancellation Policy Insights for Massa Martana
- The prevailing Airbnb cancellation policy trend in Massa Martana is Moderate, used by 57.7% of listings.
- There's a relatively balanced mix between guest-friendly (61.5%) and stricter (34.6%) policies, offering choices for different guest needs.
Recommendations for Hosts
- Consider adopting a Moderate policy to align with the 57.7% market standard in Massa Martana.
- Regularly review your cancellation policy against competitors and market demand shifts in Massa Martana.
Massa Martana STR Booking Lead Time Analysis (2026)
Average Booking Lead Time by Month
Booking Lead Time Insights for Massa Martana
- The overall average booking lead time for vacation rentals in Massa Martana is 54 days.
- Guests book furthest in advance for stays during August (average 90 days), likely coinciding with peak travel demand or local events.
- The shortest booking windows occur for stays in February (average 3 days), indicating more last-minute travel plans during this time.
- Seasonally, Summer (79 days avg.) sees the longest lead times, while Winter (17 days avg.) has the shortest, reflecting typical travel planning cycles.
Recommendations for Hosts
- Use the overall average lead time (54 days) as a baseline for your pricing and availability strategy in Massa Martana.
- For August stays, consider implementing length-of-stay discounts or slightly higher rates for bookings made less than 90 days out to capitalize on advance planning.
- During February, focus on last-minute booking availability and promotions, as guests book with very short notice (3 days avg.).
- Target marketing efforts for the Summer season well in advance (at least 79 days) to capture early planners.
- Monitor your own booking lead times against these Massa Martana averages to identify opportunities for dynamic pricing adjustments.
Popular & Essential Airbnb Amenities in Massa Martana (2026)
Amenity Prevalence
Amenity Insights for Massa Martana
- Essential amenities in Massa Martana that guests expect include: Kitchen, Wifi. Lacking these (any) could significantly impact bookings.
- Popular amenities like Washer, Stove, Heating are common but not universal. Offering these can provide a competitive edge.
Recommendations for Hosts
- Ensure your listing includes all essential amenities for Massa Martana: Kitchen, Wifi.
- Prioritize adding missing essentials: Wifi.
- Consider adding popular differentiators like Washer or Stove to increase appeal.
- Highlight unique or less common amenities you offer (e.g., hot tub, dedicated workspace, EV charger) in your listing description and photos.
- Regularly check competitor amenities in Massa Martana to stay competitive.
Massa Martana Airbnb Guest Demographics & Profile Analysis (2026)
Guest Profile Summary for Massa Martana
- The typical guest profile for Airbnb in Massa Martana consists of a mix of domestic (38%) and international guests, with top international origins including United States, typically belonging to the Post-2000s (Gen Z/Alpha) group (50%), primarily speaking English or Italian.
- Domestic travelers account for 37.5% of guests.
- Key international markets include Italy (37.5%) and United States (17%).
- Top languages spoken are English (41.1%) followed by Italian (21.1%).
- A significant demographic segment is the Post-2000s (Gen Z/Alpha) group, representing 50% of guests.
Recommendations for Hosts
- Focus marketing internationally, particularly towards travelers from United States.
- Tailor amenities and listing descriptions to appeal to the dominant Post-2000s (Gen Z/Alpha) demographic (e.g., highlight fast WiFi, smart home features, local guides).
- Highlight unique local experiences or amenities relevant to the primary guest profile.
- Consider seasonal promotions aligned with peak travel times for key origin markets.
Nearby Short-Term Rental Market Comparison
How does the Massa Martana Airbnb market stack up against its neighbors? Compare key performance metrics like average monthly revenue, ADR, and occupancy rates in surrounding areas to understand the broader regional STR landscape.
| Market | Active Properties | Monthly Revenue | Daily Rate | Avg. Occupancy |
|---|---|---|---|---|
| Tignano | 12 | $4,160 | $366.92 | 45% |
| Celleno | 13 | $4,041 | $594.80 | 28% |
| Marciano della Chiana | 17 | $3,823 | $545.25 | 35% |
| Buonconvento | 60 | $3,186 | $440.58 | 43% |
| Collevecchio | 14 | $3,140 | $334.97 | 40% |
| Radda in Chianti | 94 | $3,098 | $361.57 | 39% |
| Palombara Sabina | 15 | $2,914 | $309.11 | 38% |
| Impruneta | 146 | $2,887 | $297.45 | 40% |
| Rome | 26,470 | $2,817 | $217.07 | 50% |
| Lastra a Signa | 96 | $2,760 | $311.91 | 43% |