Paciano Airbnb Market Analysis 2026: Short Term Rental Data & Vacation Rental Statistics in Umbria, Italy
Is Airbnb profitable in Paciano in 2026? Explore comprehensive Airbnb analytics for Paciano, Umbria, Italy to uncover income potential. This 2026 STR market report for Paciano, based on AirROI data from February 2025 to January 2026, reveals key trends in the niche market of 64 active listings.
Whether you're considering an Airbnb investment in Paciano, optimizing your existing vacation rental, or exploring rental arbitrage opportunities, understanding the Paciano Airbnb data is crucial. Navigating the high regulation landscape is key to maximizing your short term rental income potential. Let's dive into the specifics.
Key Paciano Airbnb Performance Metrics Overview
Monthly Airbnb Revenue Variations & Income Potential in Paciano (2026)
Understanding the monthly revenue variations for Airbnb listings in Paciano is key to maximizing your short term rental income potential. Seasonality significantly impacts earnings. Our analysis, based on data from the past 12 months, shows that the peak revenue month for STRs in Paciano is typically August, while January often presents the lowest earnings, highlighting opportunities for strategic pricing adjustments during shoulder and low seasons. Explore the typical Airbnb income in Paciano across different performance tiers:
- Best-in-class properties (Top 10%) achieve $7,498+ monthly, often utilizing dynamic pricing and superior guest experiences.
- Strong performing properties (Top 25%) earn $3,456 or more, indicating effective management and desirable locations/amenities.
- Typical properties (Median) generate around $1,641 per month, representing the average market performance.
- Entry-level properties (Bottom 25%) see earnings around $606, often with potential for optimization.
Average Monthly Airbnb Earnings Trend in Paciano
Paciano Airbnb Occupancy Rate Trends (2026)
Maximize your bookings by understanding the Paciano STR occupancy trends. Seasonal demand shifts significantly influence how often properties are booked. Typically, Augustsees the highest demand (peak season occupancy), while January experiences the lowest (low season). Effective strategies, like adjusting minimum stays or offering promotions, can boost occupancy during slower periods. Here's how different property tiers perform in Paciano:
- Best-in-class properties (Top 10%) achieve 60%+ occupancy, indicating high desirability and potentially optimized availability.
- Strong performing properties (Top 25%) maintain 37% or higher occupancy, suggesting good market fit and guest satisfaction.
- Typical properties (Median) have an occupancy rate around 20%.
- Entry-level properties (Bottom 25%) average 10% occupancy, potentially facing higher vacancy.
Average Monthly Occupancy Rate Trend in Paciano
Average Daily Rate (ADR) Airbnb Trends in Paciano (2026)
Effective short term rental pricing strategy in Paciano involves understanding monthly ADR fluctuations. The Average Daily Rate (ADR) for Airbnb in Paciano typically peaks in August and dips lowest during February. Leveraging Airbnb dynamic pricing tools or strategies based on this seasonality can significantly boost revenue. Here's a look at the typical nightly rates achieved:
- Best-in-class properties (Top 10%) command rates of $799+ per night, often due to premium features or locations.
- Strong performing properties (Top 25%) achieve nightly rates of $388 or more.
- Typical properties (Median) charge around $180 per night.
- Entry-level properties (Bottom 25%) earn around $125 per night.
Average Daily Rate (ADR) Trend by Month in Paciano
Get Live Paciano Market Intelligence 👇

Explore Real-time Analytics
Airbnb Seasonality Analysis & Trends in Paciano (2026)
Peak Season (August, July, June)
- Revenue averages $4,667 per month
- Occupancy rates average 39.5%
- Daily rates average $328
Shoulder Season
- Revenue averages $2,495 per month
- Occupancy maintains around 24.1%
- Daily rates hold near $311
Low Season (January, November, December)
- Revenue drops to average $1,111 per month
- Occupancy decreases to average 16.0%
- Daily rates adjust to average $308
Seasonality Insights for Paciano
- The Airbnb seasonality in Paciano shows highly seasonal trends requiring careful strategy. While the sections above show seasonal averages, it's also insightful to look at the extremes:
- During the high season, the absolute peak month showcases Paciano's highest earning potential, with monthly revenues capable of climbing to $5,887, occupancy reaching a high of 50.8%, and ADRs peaking at $332.
- Conversely, the slowest single month of the year, typically falling within the low season, marks the market's lowest point. In this month, revenue might dip to $907, occupancy could drop to 12.7%, and ADRs may adjust down to $303.
- Understanding both the seasonal averages and these monthly peaks and troughs in revenue, occupancy, and ADR is crucial for maximizing your Airbnb profit potential in Paciano.
Seasonal Strategies for Maximizing Profit
- Peak Season: Maximize revenue through premium pricing and potentially longer minimum stays. Ensure high availability.
- Low Season: Offer competitive pricing, special promotions (e.g., extended stay discounts), and flexible cancellation policies. Target off-season travelers like remote workers or budget-conscious guests.
- Shoulder Seasons: Implement dynamic pricing that balances peak and low rates. Target weekend travelers or specific events. Offer slightly more flexible terms than peak season.
- Regularly analyze your own performance against these Paciano seasonality benchmarks and adjust your pricing and availability strategy accordingly.
Best Areas for Airbnb Investment in Paciano (2026)
Exploring the top neighborhoods for short-term rentals in Paciano? This section highlights key areas, outlining why they are attractive for hosts and guests, along with notable local attractions. Consider these locations based on your target guest profile and investment strategy.
| Neighborhood / Area | Why Host Here? (Target Guests & Appeal) | Key Attractions & Landmarks |
|---|---|---|
| Centro Storico | The historic center of Paciano, filled with charming medieval architecture and rich history. Ideal for tourists interested in experiencing authentic Italian culture and nearby attractions. | Piazza della Repubblica, Church of San Giuseppe, Palazzo del Podestà, Local artisan shops, Panoramic views of Lake Trasimeno |
| Lake Trasimeno | A beautiful lake with various waterfront activities, perfect for families and nature lovers. The surrounding landscape offers a tranquil escape and scenic views. | Beaches around Lake Trasimeno, Boat tours, Nature trails, Restaurants with lake views, Bird watching |
| Poggiofiorito | A scenic area known for its vineyards and olive groves, ideal for agriturismo stays and attracting wine enthusiasts and those looking for rural experiences. | Wine tasting tours, Olive oil farms, Scenic countryside views, Walking and biking trails, Agricultural festivals |
| Castiglione del Lago | A nearby charming town with medieval architecture and a stunning lakeside promenade. Offers a mix of history and leisure activities. | Fortress of Castiglione del Lago, Lakefront parks, Local markets, Tradiitonal restaurants, Art galleries |
| Tavernelle | A small village with a welcoming atmosphere, providing easy access to both urban amenities and rural landscapes. Suitable for families and peaceful retreats. | Weekly markets, Local cuisine, Surrounding hiking trails, Community events, Cultural festivals |
| Città della Pieve | A picturesque town famous for its Renaissance art and historical significance. Attractive for cultural tourism and art lovers. | Cattedrale di Città della Pieve, Museo diocesano, Local art galleries, Historic architecture, Annual festivals |
| Umbertide | A lively town with a rich historical background and access to various cultural sites. Offers a mix of local life and touristic attractions. | Castello di Umbertide, Local restaurants, Art galleries, Craft shops, Historical landmarks |
| Montepulciano (nearby) | Famous for its wine, this nearby hill town attracts tourists who enjoy wine tours and stunning panoramic views of the Tuscan and Umbrian landscape. | Vino Nobile di Montepulciano wineries, Historic center, Piazza Grande, Santa Maria delle Grazie, Local vineyards |
Understanding Airbnb License Requirements & STR Laws in Paciano (2026)
Yes, Paciano, Umbria, Italy enforces high STR regulations. Obtaining a license and ensuring compliance is almost certainly required according to current 2026 STR laws. Always verify the latest short term rental regulations and Airbnb license requirements directly with local government authorities for Paciano to ensure full compliance before hosting.
(Source: AirROI data, 2026, based on 81% licensed listings)
Top Performing Airbnb Properties in Paciano (2026)
Benchmark your potential! Explore examples of top-performing Airbnb properties in Pacianobased on Trailing Twelve Month (TTM) revenue. Analyze their characteristics, revenue, occupancy rate, and ADR to understand what drives success in this market.
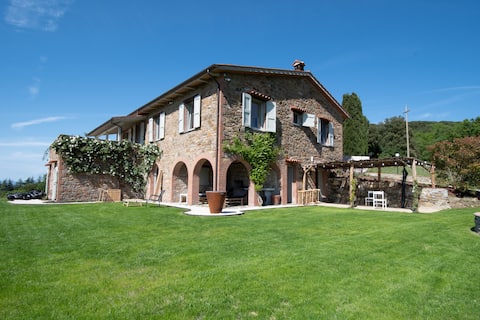
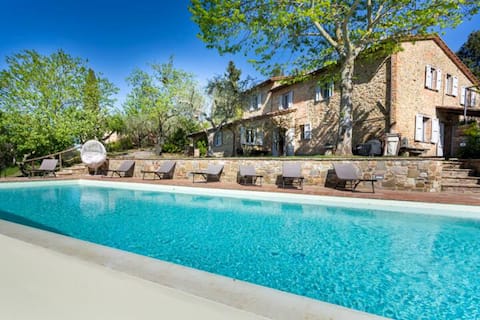
Villa Lidia Umbria, la Dolce Vita at its Best!
Entire Place • 4 bedrooms
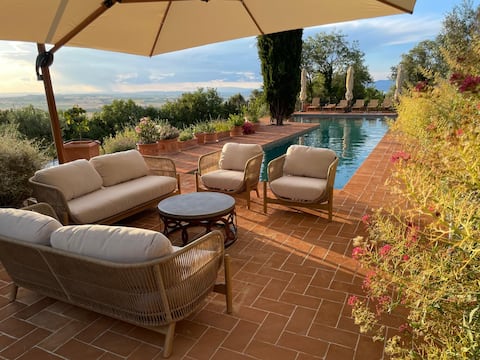
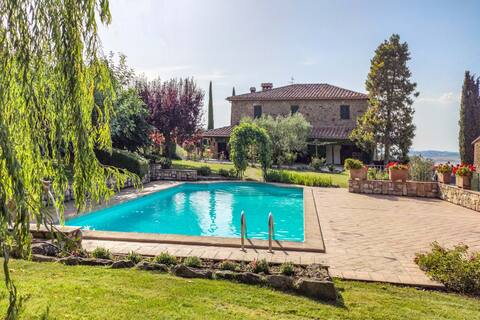
Luxurious Villa near village, 5 Bathrooms, Aircon
Entire Place • 5 bedrooms
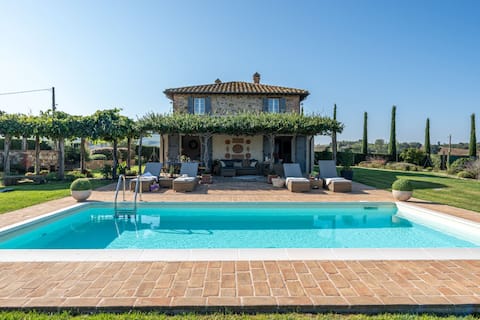
Sunflower Farmhouse
Entire Place • 4 bedrooms
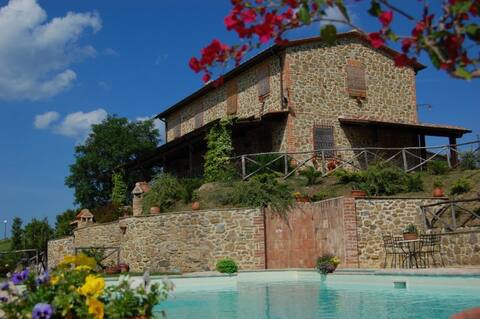
Villa in Paciano 20+ guests
Private Room • N/A
Fontecicerum LuxVilla with pool Fontanaro Property
Entire Place • 5 bedrooms
Villa Fortuna with Hot-Tub and pool near Tuscany
Entire Place • 4 bedrooms
Note: Performance varies based on location, size, amenities, seasonality, and management quality. Data reflects the past 12 months.
Top Performing Airbnb Hosts in Paciano (2026)
Learn from the best! This table showcases top-performing Airbnb hosts in Paciano based on the number of properties managed and estimated total revenue over the past year. Analyze their scale and performance metrics.
| Host Name | Properties | Grossing Revenue | Stay Reviews | Avg Rating |
|---|---|---|---|---|
| Lucia | 10 | $243,067 | 27 | 5.00/5.0 |
| Great Stays | 2 | $127,875 | 11 | 5.00/5.0 |
| Marleen | 3 | $121,811 | 14 | 5.00/5.0 |
| Luca | 5 | $109,301 | 111 | 4.76/5.0 |
| Roelof | 1 | $94,789 | 11 | 5.00/5.0 |
| Mario | 2 | $72,940 | 7 | 5.00/5.0 |
| Emma | 3 | $66,427 | 5 | Not Rated |
| Ilario | 13 | $64,225 | 179 | 4.83/5.0 |
| Sofia | 1 | $55,899 | 50 | 4.98/5.0 |
| Saskia | 3 | $44,980 | 27 | 4.84/5.0 |
Analyzing the strategies of top hosts, such as their property selection, pricing, and guest communication, can offer valuable lessons for optimizing your own Airbnb operations in Paciano.
Dive Deeper: Advanced Paciano STR Market Data (2026)
Ready to unlock more insights? AirROI provides access to advanced metrics and comprehensive Airbnb data for Paciano. Explore detailed analytics beyond this report to refine your investment strategy, optimize pricing, and maximize your vacation rental profits.
Explore Advanced MetricsPaciano Short-Term Rental Market Composition (2026): Property & Room Types
Room Type Distribution
Property Type Distribution
Market Composition Insights for Paciano
- The Paciano Airbnb market composition is heavily skewed towards Entire Home/Apt listings, which make up 85.9% of the 64 active rentals. This indicates strong guest preference for privacy and space.
- Looking at the property type distribution in Paciano, House properties are the most common (45.3%), reflecting the local real estate landscape.
- Houses represent a significant 45.3% portion, catering likely to families or larger groups.
Paciano Airbnb Room Capacity Analysis (2026): Bedroom Distribution
Distribution of Listings by Number of Bedrooms
Room Capacity Insights for Paciano
- The dominant room capacity in Paciano is 2 bedrooms listings, making up 34.4% of the market. This suggests a strong demand for properties suitable for couples or solo travelers.
- Together, 2 bedrooms and 1 bedroom properties represent 59.4% of the active Airbnb listings in Paciano, indicating a high concentration in these sizes.
- A significant 29.6% of listings offer 3+ bedrooms, catering to larger groups and families seeking more space in Paciano.
Paciano Vacation Rental Guest Capacity Trends (2026)
Distribution of Listings by Guest Capacity
Guest Capacity Insights for Paciano
- The most common guest capacity trend in Paciano vacation rentals is listings accommodating 4 guests (26.6%). This suggests the primary traveler segment is likely small families or groups.
- Properties designed for 4 guests and 8+ guests dominate the Paciano STR market, accounting for 50.0% of listings.
- 35.9% of properties accommodate 6+ guests, serving the market segment for larger families or group travel in Paciano.
- On average, properties in Paciano are equipped to host 4.7 guests.
Paciano Airbnb Booking Patterns (2026): Available vs. Booked Days
Available Days Distribution
Booked Days Distribution
Booking Pattern Insights for Paciano
- The most common availability pattern in Paciano falls within the 271-366 days range, representing 82.8% of listings. This suggests many properties have significant open periods on their calendars.
- Approximately 100.0% of listings show high availability (181+ days open annually), indicating potential for increased bookings or specific owner usage patterns.
- For booked days, the 31-90 days range is most frequent in Paciano (46.9%), reflecting common guest stay durations or potential owner blocking patterns.
Paciano Airbnb Minimum Stay Requirements Analysis
Distribution of Listings by Minimum Night Requirement
1 Night
3 listings
4.7% of total
2 Nights
5 listings
7.8% of total
3 Nights
9 listings
14.1% of total
4-6 Nights
8 listings
12.5% of total
7-29 Nights
2 listings
3.1% of total
30+ Nights
37 listings
57.8% of total
Key Insights
- The most prevalent minimum stay requirement in Paciano is 30+ Nights, adopted by 57.8% of listings. This highlights the market's preference for longer commitments.
- Very short stays (1-2 nights) are less common (12.5%), suggesting hosts prefer slightly longer bookings to optimize turnover.
- A significant segment (57.8%) caters to monthly stays (30+ nights) in Paciano, pointing to opportunities in the extended-stay market.
Recommendations
- Align with the market by considering a 30+ Nights minimum stay, as 57.8% of Paciano hosts use this setting.
- If feasible, allowing 1-night stays, especially midweek or during low season, could capture last-minute bookings, as only 4.7% currently do.
- Explore offering discounts for stays of 30+ nights to attract the 57.8% of the market seeking extended stays.
- Adjust minimum nights based on seasonality – potentially shorter during low season and longer during peak demand periods in Paciano.
Paciano Airbnb Cancellation Policy Trends Analysis (2026)
Super Strict 30 Days
15 listings
23.4% of total
Super Strict 60 Days
1 listings
1.6% of total
Flexible
7 listings
10.9% of total
Moderate
10 listings
15.6% of total
Firm
21 listings
32.8% of total
Strict
10 listings
15.6% of total
Cancellation Policy Insights for Paciano
- The prevailing Airbnb cancellation policy trend in Paciano is Firm, used by 32.8% of listings.
- There's a relatively balanced mix between guest-friendly (26.5%) and stricter (48.4%) policies, offering choices for different guest needs.
Recommendations for Hosts
- Consider adopting a Firm policy to align with the 32.8% market standard in Paciano.
- Regularly review your cancellation policy against competitors and market demand shifts in Paciano.
Paciano STR Booking Lead Time Analysis (2026)
Average Booking Lead Time by Month
Booking Lead Time Insights for Paciano
- The overall average booking lead time for vacation rentals in Paciano is 75 days.
- Guests book furthest in advance for stays during June (average 96 days), likely coinciding with peak travel demand or local events.
- The shortest booking windows occur for stays in February (average 4 days), indicating more last-minute travel plans during this time.
- Seasonally, Summer (88 days avg.) sees the longest lead times, while Winter (43 days avg.) has the shortest, reflecting typical travel planning cycles.
Recommendations for Hosts
- Use the overall average lead time (75 days) as a baseline for your pricing and availability strategy in Paciano.
- For June stays, consider implementing length-of-stay discounts or slightly higher rates for bookings made less than 96 days out to capitalize on advance planning.
- During February, focus on last-minute booking availability and promotions, as guests book with very short notice (4 days avg.).
- Target marketing efforts for the Summer season well in advance (at least 88 days) to capture early planners.
- Monitor your own booking lead times against these Paciano averages to identify opportunities for dynamic pricing adjustments.
Popular & Essential Airbnb Amenities in Paciano (2026)
Amenity Prevalence
Amenity Insights for Paciano
- Essential amenities in Paciano that guests expect include: Wifi, Kitchen, Heating. Lacking these (any) could significantly impact bookings.
- Popular amenities like Hot water, Cooking basics, Hangers are common but not universal. Offering these can provide a competitive edge.
Recommendations for Hosts
- Ensure your listing includes all essential amenities for Paciano: Wifi, Kitchen, Heating.
- Prioritize adding missing essentials: Wifi, Kitchen, Heating.
- Consider adding popular differentiators like Hot water or Cooking basics to increase appeal.
- Highlight unique or less common amenities you offer (e.g., hot tub, dedicated workspace, EV charger) in your listing description and photos.
- Regularly check competitor amenities in Paciano to stay competitive.
Paciano Airbnb Guest Demographics & Profile Analysis (2026)
Guest Profile Summary for Paciano
- The typical guest profile for Airbnb in Paciano consists of predominantly international visitors (84%), with top international origins including United Kingdom, typically belonging to the Post-2000s (Gen Z/Alpha) group (50%), primarily speaking English or Italian.
- Domestic travelers account for 16.4% of guests.
- Key international markets include Italy (16.4%) and United Kingdom (15.1%).
- Top languages spoken are English (39%) followed by Italian (13.4%).
- A significant demographic segment is the Post-2000s (Gen Z/Alpha) group, representing 50% of guests.
Recommendations for Hosts
- Focus marketing internationally, particularly towards travelers from United Kingdom.
- Tailor amenities and listing descriptions to appeal to the dominant Post-2000s (Gen Z/Alpha) demographic (e.g., highlight fast WiFi, smart home features, local guides).
- Highlight unique local experiences or amenities relevant to the primary guest profile.
- Consider seasonal promotions aligned with peak travel times for key origin markets.
Nearby Short-Term Rental Market Comparison
How does the Paciano Airbnb market stack up against its neighbors? Compare key performance metrics like average monthly revenue, ADR, and occupancy rates in surrounding areas to understand the broader regional STR landscape.
| Market | Active Properties | Monthly Revenue | Daily Rate | Avg. Occupancy |
|---|---|---|---|---|
| Tignano | 12 | $4,160 | $366.92 | 45% |
| Celleno | 13 | $4,041 | $594.80 | 28% |
| Marciano della Chiana | 17 | $3,823 | $545.25 | 35% |
| Buonconvento | 60 | $3,186 | $440.58 | 43% |
| Collevecchio | 14 | $3,140 | $334.97 | 40% |
| Radda in Chianti | 94 | $3,098 | $361.57 | 39% |
| Palombara Sabina | 15 | $2,914 | $309.11 | 38% |
| Impruneta | 146 | $2,887 | $297.45 | 40% |
| Lastra a Signa | 96 | $2,760 | $311.91 | 43% |
| Florence | 10,496 | $2,755 | $225.30 | 49% |