Albignasego Airbnb Market Analysis 2026: Short Term Rental Data & Vacation Rental Statistics in Veneto, Italy
Is Airbnb profitable in Albignasego in 2026? Explore comprehensive Airbnb analytics for Albignasego, Veneto, Italy to uncover income potential. This 2026 STR market report for Albignasego, based on AirROI data from February 2025 to January 2026, reveals key trends in the niche market of 23 active listings.
Whether you're considering an Airbnb investment in Albignasego, optimizing your existing vacation rental, or exploring rental arbitrage opportunities, understanding the Albignasego Airbnb data is crucial. Navigating the high regulation landscape is key to maximizing your short term rental income potential. Let's dive into the specifics.
Key Albignasego Airbnb Performance Metrics Overview
Monthly Airbnb Revenue Variations & Income Potential in Albignasego (2026)
Understanding the monthly revenue variations for Airbnb listings in Albignasego is key to maximizing your short term rental income potential. Seasonality significantly impacts earnings. Our analysis, based on data from the past 12 months, shows that the peak revenue month for STRs in Albignasego is typically December, while January often presents the lowest earnings, highlighting opportunities for strategic pricing adjustments during shoulder and low seasons. Explore the typical Airbnb income in Albignasego across different performance tiers:
- Best-in-class properties (Top 10%) achieve $2,897+ monthly, often utilizing dynamic pricing and superior guest experiences.
- Strong performing properties (Top 25%) earn $1,606 or more, indicating effective management and desirable locations/amenities.
- Typical properties (Median) generate around $866 per month, representing the average market performance.
- Entry-level properties (Bottom 25%) see earnings around $484, often with potential for optimization.
Average Monthly Airbnb Earnings Trend in Albignasego
Albignasego Airbnb Occupancy Rate Trends (2026)
Maximize your bookings by understanding the Albignasego STR occupancy trends. Seasonal demand shifts significantly influence how often properties are booked. Typically, Augustsees the highest demand (peak season occupancy), while January experiences the lowest (low season). Effective strategies, like adjusting minimum stays or offering promotions, can boost occupancy during slower periods. Here's how different property tiers perform in Albignasego:
- Best-in-class properties (Top 10%) achieve 73%+ occupancy, indicating high desirability and potentially optimized availability.
- Strong performing properties (Top 25%) maintain 47% or higher occupancy, suggesting good market fit and guest satisfaction.
- Typical properties (Median) have an occupancy rate around 27%.
- Entry-level properties (Bottom 25%) average 16% occupancy, potentially facing higher vacancy.
Average Monthly Occupancy Rate Trend in Albignasego
Average Daily Rate (ADR) Airbnb Trends in Albignasego (2026)
Effective short term rental pricing strategy in Albignasego involves understanding monthly ADR fluctuations. The Average Daily Rate (ADR) for Airbnb in Albignasego typically peaks in August and dips lowest during February. Leveraging Airbnb dynamic pricing tools or strategies based on this seasonality can significantly boost revenue. Here's a look at the typical nightly rates achieved:
- Best-in-class properties (Top 10%) command rates of $235+ per night, often due to premium features or locations.
- Strong performing properties (Top 25%) achieve nightly rates of $116 or more.
- Typical properties (Median) charge around $90 per night.
- Entry-level properties (Bottom 25%) earn around $46 per night.
Average Daily Rate (ADR) Trend by Month in Albignasego
Get Live Albignasego Market Intelligence 👇

Explore Real-time Analytics
Airbnb Seasonality Analysis & Trends in Albignasego (2026)
Peak Season (December, August, September)
- Revenue averages $1,899 per month
- Occupancy rates average 43.7%
- Daily rates average $109
Shoulder Season
- Revenue averages $1,156 per month
- Occupancy maintains around 32.2%
- Daily rates hold near $105
Low Season (January, February, November)
- Revenue drops to average $866 per month
- Occupancy decreases to average 27.6%
- Daily rates adjust to average $103
Seasonality Insights for Albignasego
- The Airbnb seasonality in Albignasego shows highly seasonal trends requiring careful strategy. While the sections above show seasonal averages, it's also insightful to look at the extremes:
- During the high season, the absolute peak month showcases Albignasego's highest earning potential, with monthly revenues capable of climbing to $1,972, occupancy reaching a high of 49.8%, and ADRs peaking at $109.
- Conversely, the slowest single month of the year, typically falling within the low season, marks the market's lowest point. In this month, revenue might dip to $816, occupancy could drop to 18.7%, and ADRs may adjust down to $99.
- Understanding both the seasonal averages and these monthly peaks and troughs in revenue, occupancy, and ADR is crucial for maximizing your Airbnb profit potential in Albignasego.
Seasonal Strategies for Maximizing Profit
- Peak Season: Maximize revenue through premium pricing and potentially longer minimum stays. Ensure high availability.
- Low Season: Offer competitive pricing, special promotions (e.g., extended stay discounts), and flexible cancellation policies. Target off-season travelers like remote workers or budget-conscious guests.
- Shoulder Seasons: Implement dynamic pricing that balances peak and low rates. Target weekend travelers or specific events. Offer slightly more flexible terms than peak season.
- Regularly analyze your own performance against these Albignasego seasonality benchmarks and adjust your pricing and availability strategy accordingly.
Best Areas for Airbnb Investment in Albignasego (2026)
Exploring the top neighborhoods for short-term rentals in Albignasego? This section highlights key areas, outlining why they are attractive for hosts and guests, along with notable local attractions. Consider these locations based on your target guest profile and investment strategy.
| Neighborhood / Area | Why Host Here? (Target Guests & Appeal) | Key Attractions & Landmarks |
|---|---|---|
| Centro di Albignasego | The central area of Albignasego offers easy access to shops, restaurants, and public transport, making it a convenient location for visitors looking to explore the wider Veneto region. | Piazza della Libertà, Chiesa di San Lorenzo, Local markets, Nearby parks, Restaurants and cafes |
| Area di Galzignano | Galzignano is known for its thermal springs and spas, attracting wellness tourists and those looking for relaxation, making it an ideal spot for unique Airbnb experiences. | Termal Center of Galzignano, Golf Club Padova, Biodiversity Parks, Vineyards, Hiking trails |
| Montegrotto Terme | A charming village nearby known for its spa facilities and rich natural resources, popular among those seeking a rejuvenating getaway. | Montegrotto Terme Spa, Historical Roman Ruins, Parco Regionale dei Colli Euganei, Natural hot springs, Wellness centers |
| Agna | A small quaint town near Albignasego perfect for visitors looking for a peaceful rural experience and proximity to nature and history. | Local museums, Historic churches, Countryside views, Traditional restaurants, Cycling paths |
| Abano Terme | Famous for its thermal baths, Abano Terme attracts visitors looking for health and wellness retreats, making it a prime area for hosting short-term rentals. | Thermal baths and spas, Parks and gardens, Cultural events, Historic city center, Wellness treatments |
| Villa Contarini | Close to Albignasego, Villa Contarini offers stunning architecture and gardens attracting history enthusiasts and tourists interested in local culture. | Villa Contarini, Historical gardens, Cultural activities, Museum exhibitions, Seasonal events |
| Padova City Center | Only a short distance away, the vibrant center of Padova is rich in history and culture, making it an attractive destination for tourists. | Basilica di Sant'Antonio, Prato della Valle, University of Padova, Historic markets, Art galleries |
| Colli Euganei | A great destination for nature lovers, this hilly region is perfect for outdoor activities and wine tasting, appealing to active travelers. | Hiking trails, Vineyards and wineries, Natural parks, Scenic views, Local cuisine |
Understanding Airbnb License Requirements & STR Laws in Albignasego (2026)
Yes, Albignasego, Veneto, Italy enforces high STR regulations. Obtaining a license and ensuring compliance is almost certainly required according to current 2026 STR laws. Always verify the latest short term rental regulations and Airbnb license requirements directly with local government authorities for Albignasego to ensure full compliance before hosting.
(Source: AirROI data, 2026, based on 100% licensed listings)
Top Performing Airbnb Properties in Albignasego (2026)
Benchmark your potential! Explore examples of top-performing Airbnb properties in Albignasegobased on Trailing Twelve Month (TTM) revenue. Analyze their characteristics, revenue, occupancy rate, and ADR to understand what drives success in this market.

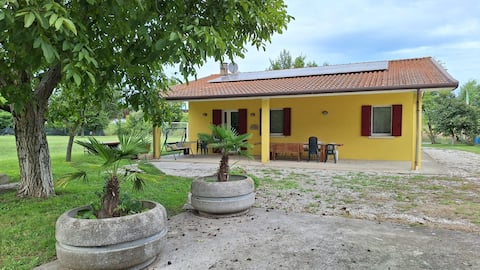
3 Bedrooms, vast Outdoors and Free multi Car Park
Entire Place • 3 bedrooms

Martina's Rooms Apartment
Entire Place • 3 bedrooms
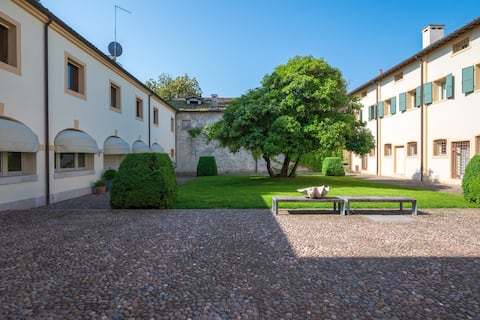
Casa Elda and Gino among the hornbeams
Entire Place • 3 bedrooms
3BR Home + Garden & Free Parking for 3+ Cars
Entire Place • 3 bedrooms
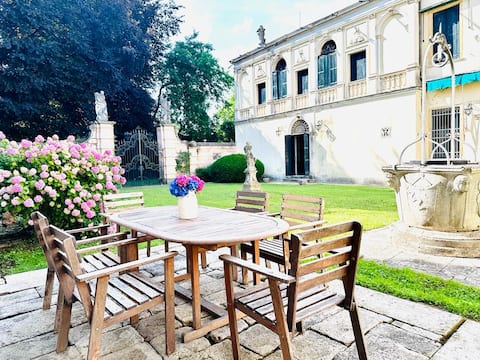
Elegant & Superior Scuderia Villa Molin
Entire Place • 3 bedrooms

Apartment on the outskirts of Padua
Entire Place • 2 bedrooms
Note: Performance varies based on location, size, amenities, seasonality, and management quality. Data reflects the past 12 months.
Top Performing Airbnb Hosts in Albignasego (2026)
Learn from the best! This table showcases top-performing Airbnb hosts in Albignasego based on the number of properties managed and estimated total revenue over the past year. Analyze their scale and performance metrics.
| Host Name | Properties | Grossing Revenue | Stay Reviews | Avg Rating |
|---|---|---|---|---|
| Manfredo | 2 | $56,128 | 29 | 4.33/5.0 |
| Bread And Butter Rooms | 6 | $31,084 | 65 | 4.98/5.0 |
| Jessica | 1 | $22,684 | 1 | Not Rated |
| Daniele | 1 | $16,719 | 41 | 4.93/5.0 |
| GuestHost - Welcome To Veneto | 1 | $16,655 | 15 | 4.73/5.0 |
| Michela | 1 | $15,582 | 70 | 4.90/5.0 |
| Loris | 3 | $14,335 | 46 | 4.49/5.0 |
| Annunziata | 1 | $9,291 | 27 | 4.70/5.0 |
| Ilaria | 1 | $9,033 | 28 | 4.86/5.0 |
| Loris | 1 | $8,940 | 14 | 5.00/5.0 |
Analyzing the strategies of top hosts, such as their property selection, pricing, and guest communication, can offer valuable lessons for optimizing your own Airbnb operations in Albignasego.
Dive Deeper: Advanced Albignasego STR Market Data (2026)
Ready to unlock more insights? AirROI provides access to advanced metrics and comprehensive Airbnb data for Albignasego. Explore detailed analytics beyond this report to refine your investment strategy, optimize pricing, and maximize your vacation rental profits.
Explore Advanced MetricsAlbignasego Short-Term Rental Market Composition (2026): Property & Room Types
Room Type Distribution
Property Type Distribution
Market Composition Insights for Albignasego
- The Albignasego Airbnb market composition is heavily skewed towards Entire Home/Apt listings, which make up 78.3% of the 23 active rentals. This indicates strong guest preference for privacy and space.
- Looking at the property type distribution in Albignasego, Apartment/Condo properties are the most common (47.8%), reflecting the local real estate landscape.
- Houses represent a significant 47.8% portion, catering likely to families or larger groups.
- Smaller segments like outdoor/unique (combined 4.3%) offer potential for unique stay experiences.
Albignasego Airbnb Room Capacity Analysis (2026): Bedroom Distribution
Distribution of Listings by Number of Bedrooms
Room Capacity Insights for Albignasego
- The dominant room capacity in Albignasego is 3 bedrooms listings, making up 21.7% of the market. This suggests a strong demand for properties suitable for families or small groups.
- Together, 3 bedrooms and 2 bedrooms properties represent 39.1% of the active Airbnb listings in Albignasego, indicating a high concentration in these sizes.
- A significant 21.7% of listings offer 3+ bedrooms, catering to larger groups and families seeking more space in Albignasego.
Albignasego Vacation Rental Guest Capacity Trends (2026)
Distribution of Listings by Guest Capacity
Guest Capacity Insights for Albignasego
- The most common guest capacity trend in Albignasego vacation rentals is listings accommodating 6 guests (26.1%). This suggests the primary traveler segment is likely larger groups.
- Properties designed for 6 guests and 4 guests dominate the Albignasego STR market, accounting for 47.8% of listings.
- 26.1% of properties accommodate 6+ guests, serving the market segment for larger families or group travel in Albignasego.
- On average, properties in Albignasego are equipped to host 2.4 guests.
Albignasego Airbnb Booking Patterns (2026): Available vs. Booked Days
Available Days Distribution
Booked Days Distribution
Booking Pattern Insights for Albignasego
- The most common availability pattern in Albignasego falls within the 271-366 days range, representing 56.5% of listings. This suggests many properties have significant open periods on their calendars.
- Approximately 95.6% of listings show high availability (181+ days open annually), indicating potential for increased bookings or specific owner usage patterns.
- For booked days, the 91-180 days range is most frequent in Albignasego (39.1%), reflecting common guest stay durations or potential owner blocking patterns.
- A notable 4.3% of properties secure long booking periods (181+ days booked per year), highlighting successful long-term rental strategies or significant owner usage.
Albignasego Airbnb Minimum Stay Requirements Analysis
Distribution of Listings by Minimum Night Requirement
1 Night
7 listings
30.4% of total
2 Nights
3 listings
13% of total
3 Nights
4 listings
17.4% of total
4-6 Nights
1 listings
4.3% of total
7-29 Nights
1 listings
4.3% of total
30+ Nights
7 listings
30.4% of total
Key Insights
- The most prevalent minimum stay requirement in Albignasego is 1 Night, adopted by 30.4% of listings. This highlights the market's preference for shorter, flexible bookings.
- A significant segment (30.4%) caters to monthly stays (30+ nights) in Albignasego, pointing to opportunities in the extended-stay market.
Recommendations
- Align with the market by considering a 1 Night minimum stay, as 30.4% of Albignasego hosts use this setting.
- Explore offering discounts for stays of 30+ nights to attract the 30.4% of the market seeking extended stays.
- Adjust minimum nights based on seasonality – potentially shorter during low season and longer during peak demand periods in Albignasego.
Albignasego Airbnb Cancellation Policy Trends Analysis (2026)
Limited
1 listings
4.3% of total
Flexible
11 listings
47.8% of total
Moderate
7 listings
30.4% of total
Firm
4 listings
17.4% of total
Cancellation Policy Insights for Albignasego
- The prevailing Airbnb cancellation policy trend in Albignasego is Flexible, used by 47.8% of listings.
- The market strongly favors guest-friendly terms, with 78.2% of listings offering Flexible or Moderate policies. This suggests guests in Albignasego may expect booking flexibility.
Recommendations for Hosts
- Consider adopting a Flexible policy to align with the 47.8% market standard in Albignasego.
- Regularly review your cancellation policy against competitors and market demand shifts in Albignasego.
Albignasego STR Booking Lead Time Analysis (2026)
Average Booking Lead Time by Month
Booking Lead Time Insights for Albignasego
- The overall average booking lead time for vacation rentals in Albignasego is 48 days.
- Guests book furthest in advance for stays during May (average 89 days), likely coinciding with peak travel demand or local events.
- The shortest booking windows occur for stays in October (average 34 days), indicating more last-minute travel plans during this time.
- Seasonally, Summer (75 days avg.) sees the longest lead times, while Fall (46 days avg.) has the shortest, reflecting typical travel planning cycles.
Recommendations for Hosts
- Use the overall average lead time (48 days) as a baseline for your pricing and availability strategy in Albignasego.
- For May stays, consider implementing length-of-stay discounts or slightly higher rates for bookings made less than 89 days out to capitalize on advance planning.
- Target marketing efforts for the Summer season well in advance (at least 75 days) to capture early planners.
- Monitor your own booking lead times against these Albignasego averages to identify opportunities for dynamic pricing adjustments.
Popular & Essential Airbnb Amenities in Albignasego (2026)
Amenity Prevalence
Amenity Insights for Albignasego
- Essential amenities in Albignasego that guests expect include: TV, Heating. Lacking these (any) could significantly impact bookings.
- Popular amenities like Hair dryer, Air conditioning, Wifi are common but not universal. Offering these can provide a competitive edge.
- Warning: Wifi is not universally provided but is considered essential globally. Ensure reliable Wifi is offered.
Recommendations for Hosts
- Ensure your listing includes all essential amenities for Albignasego: TV, Heating.
- Prioritize adding missing essentials: TV, Heating.
- Consider adding popular differentiators like Hair dryer or Air conditioning to increase appeal.
- Highlight unique or less common amenities you offer (e.g., hot tub, dedicated workspace, EV charger) in your listing description and photos.
- Regularly check competitor amenities in Albignasego to stay competitive.
Albignasego Airbnb Guest Demographics & Profile Analysis (2026)
Guest Profile Summary for Albignasego
- The typical guest profile for Airbnb in Albignasego consists of a mix of domestic (46%) and international guests, with top international origins including United States, typically belonging to the Post-2000s (Gen Z/Alpha) group (50%), primarily speaking English or Italian.
- Domestic travelers account for 46.4% of guests.
- Key international markets include Italy (46.4%) and United States (14.3%).
- Top languages spoken are English (37%) followed by Italian (26.1%).
- A significant demographic segment is the Post-2000s (Gen Z/Alpha) group, representing 50% of guests.
Recommendations for Hosts
- Balance marketing efforts between domestic and international channels based on the guest mix.
- Tailor amenities and listing descriptions to appeal to the dominant Post-2000s (Gen Z/Alpha) demographic (e.g., highlight fast WiFi, smart home features, local guides).
- Highlight unique local experiences or amenities relevant to the primary guest profile.
- Consider seasonal promotions aligned with peak travel times for key origin markets.
Nearby Short-Term Rental Market Comparison
How does the Albignasego Airbnb market stack up against its neighbors? Compare key performance metrics like average monthly revenue, ADR, and occupancy rates in surrounding areas to understand the broader regional STR landscape.
| Market | Active Properties | Monthly Revenue | Daily Rate | Avg. Occupancy |
|---|---|---|---|---|
| Sankt Pankraz - San Pancrazio | 12 | $6,528 | $633.65 | 29% |
| Urtijëi - St. Ulrich in Gröden - Ortisei | 172 | $5,054 | $718.33 | 41% |
| Kiens - Chienes | 17 | $3,715 | $377.77 | 48% |
| Cortina d'Ampezzo | 309 | $3,646 | $474.12 | 40% |
| Moos in Passeier - Moso in Passiria | 20 | $3,504 | $547.30 | 23% |
| Colle Santa Lucia | 21 | $3,353 | $248.56 | 46% |
| Lajen - Laion | 96 | $3,338 | $548.27 | 36% |
| Merano | 28 | $3,288 | $309.99 | 46% |
| Santa Cristina Gherdëina - St. Christina in Gröden - Santa Cristina Valgardena | 102 | $3,264 | $408.62 | 41% |
| Großkirchheim | 12 | $3,022 | $273.94 | 39% |