Arabba Airbnb Market Analysis 2026: Short Term Rental Data & Vacation Rental Statistics in Veneto, Italy
Is Airbnb profitable in Arabba in 2026? Explore comprehensive Airbnb analytics for Arabba, Veneto, Italy to uncover income potential. This 2026 STR market report for Arabba, based on AirROI data from February 2025 to January 2026, reveals key trends in the niche market of 22 active listings.
Whether you're considering an Airbnb investment in Arabba, optimizing your existing vacation rental, or exploring rental arbitrage opportunities, understanding the Arabba Airbnb data is crucial. Navigating the high regulation landscape is key to maximizing your short term rental income potential. Let's dive into the specifics.
Key Arabba Airbnb Performance Metrics Overview
Monthly Airbnb Revenue Variations & Income Potential in Arabba (2026)
Understanding the monthly revenue variations for Airbnb listings in Arabba is key to maximizing your short term rental income potential. Seasonality significantly impacts earnings. Our analysis, based on data from the past 12 months, shows that the peak revenue month for STRs in Arabba is typically December, while November often presents the lowest earnings, highlighting opportunities for strategic pricing adjustments during shoulder and low seasons. Explore the typical Airbnb income in Arabba across different performance tiers:
- Best-in-class properties (Top 10%) achieve $8,624+ monthly, often utilizing dynamic pricing and superior guest experiences.
- Strong performing properties (Top 25%) earn $4,427 or more, indicating effective management and desirable locations/amenities.
- Typical properties (Median) generate around $2,682 per month, representing the average market performance.
- Entry-level properties (Bottom 25%) see earnings around $1,150, often with potential for optimization.
Average Monthly Airbnb Earnings Trend in Arabba
Arabba Airbnb Occupancy Rate Trends (2026)
Maximize your bookings by understanding the Arabba STR occupancy trends. Seasonal demand shifts significantly influence how often properties are booked. Typically, Augustsees the highest demand (peak season occupancy), while November experiences the lowest (low season). Effective strategies, like adjusting minimum stays or offering promotions, can boost occupancy during slower periods. Here's how different property tiers perform in Arabba:
- Best-in-class properties (Top 10%) achieve 71%+ occupancy, indicating high desirability and potentially optimized availability.
- Strong performing properties (Top 25%) maintain 52% or higher occupancy, suggesting good market fit and guest satisfaction.
- Typical properties (Median) have an occupancy rate around 35%.
- Entry-level properties (Bottom 25%) average 17% occupancy, potentially facing higher vacancy.
Average Monthly Occupancy Rate Trend in Arabba
Average Daily Rate (ADR) Airbnb Trends in Arabba (2026)
Effective short term rental pricing strategy in Arabba involves understanding monthly ADR fluctuations. The Average Daily Rate (ADR) for Airbnb in Arabba typically peaks in January and dips lowest during October. Leveraging Airbnb dynamic pricing tools or strategies based on this seasonality can significantly boost revenue. Here's a look at the typical nightly rates achieved:
- Best-in-class properties (Top 10%) command rates of $745+ per night, often due to premium features or locations.
- Strong performing properties (Top 25%) achieve nightly rates of $340 or more.
- Typical properties (Median) charge around $219 per night.
- Entry-level properties (Bottom 25%) earn around $169 per night.
Average Daily Rate (ADR) Trend by Month in Arabba
Get Live Arabba Market Intelligence 👇

Explore Real-time Analytics
Airbnb Seasonality Analysis & Trends in Arabba (2026)
Peak Season (December, January, August)
- Revenue averages $6,641 per month
- Occupancy rates average 45.7%
- Daily rates average $583
Shoulder Season
- Revenue averages $3,052 per month
- Occupancy maintains around 42.0%
- Daily rates hold near $548
Low Season (May, October, November)
- Revenue drops to average $1,070 per month
- Occupancy decreases to average 19.4%
- Daily rates adjust to average $489
Seasonality Insights for Arabba
- The Airbnb seasonality in Arabba shows highly seasonal trends requiring careful strategy. While the sections above show seasonal averages, it's also insightful to look at the extremes:
- During the high season, the absolute peak month showcases Arabba's highest earning potential, with monthly revenues capable of climbing to $9,729, occupancy reaching a high of 62.6%, and ADRs peaking at $612.
- Conversely, the slowest single month of the year, typically falling within the low season, marks the market's lowest point. In this month, revenue might dip to $352, occupancy could drop to 6.1%, and ADRs may adjust down to $446.
- Understanding both the seasonal averages and these monthly peaks and troughs in revenue, occupancy, and ADR is crucial for maximizing your Airbnb profit potential in Arabba.
Seasonal Strategies for Maximizing Profit
- Peak Season: Maximize revenue through premium pricing and potentially longer minimum stays. Ensure high availability.
- Low Season: Offer competitive pricing, special promotions (e.g., extended stay discounts), and flexible cancellation policies. Target off-season travelers like remote workers or budget-conscious guests.
- Shoulder Seasons: Implement dynamic pricing that balances peak and low rates. Target weekend travelers or specific events. Offer slightly more flexible terms than peak season.
- Regularly analyze your own performance against these Arabba seasonality benchmarks and adjust your pricing and availability strategy accordingly.
Best Areas for Airbnb Investment in Arabba (2026)
Exploring the top neighborhoods for short-term rentals in Arabba? This section highlights key areas, outlining why they are attractive for hosts and guests, along with notable local attractions. Consider these locations based on your target guest profile and investment strategy.
| Neighborhood / Area | Why Host Here? (Target Guests & Appeal) | Key Attractions & Landmarks |
|---|---|---|
| Pieve di Livinallongo | A charming village offering stunning views of the Dolomites. Ideal for those seeking a peaceful retreat close to nature, and a great base for skiing and hiking enthusiasts. | Passo Pordoi, Passo di Fedaia, Monte Civetta, Alta Badia, Dolomiti Superski, Ossuario di Pieve di Livinallongo |
| Arabba | Known for its proximity to the Sella Ronda ski circuit, Arabba attracts winter sports lovers. A perfect location for ski enthusiasts and adventure seekers all year round. | Sella Ronda, Arabba-Marmolada ski area, Col di Ransc, Fedaia Lake, Piz Boè, Local ski schools |
| Livinallongo del Col di Lana | A beautiful area surrounded by mountains, popular for hiking and skiing. Its historical significance and scenic landscapes make it an attractive destination. | Col di Lana, Marmolada, Fedaia Pass, Bivio Altavista, Possibility of hiking trails, WWI historical sites |
| Alleghe | A picturesque town located by a lake, ideal for both summer and winter activities. Offers a variety of outdoor sports and beautiful views. | Lake Alleghe, Alleghe Ski Resort, Local hiking trails, Baite e Rifugi, Restaurants with local cuisine, Winter sports accessibility |
| Selva di Cadore | A tranquil mountain village known for ski resorts and spectacular hiking routes. Perfect for families and nature lovers looking to explore the Dolomites. | Pelmo Mountain, Local ski areas, Hiking routes, Civetta Ski Resort, Cultural heritage sites, History of the Cadore region |
| Cortina d'Ampezzo | Famous for its winter Olympic legacy, offers upscale amenities and a vibrant social scene. An attractive spot for tourists looking for luxury and adventure in the Dolomites. | Cinque Torri, Cortina Ski Resort, Lake Misurina, Shopping and dining experience, Local festivals, Cultural events |
| Ponzano Veneto | A quieter locale near Belluno, offering a unique experience of rural life while still being close to attractions. Ideal for those seeking an authentic Italian experience. | Local vineyards, Countryside hikes, Historic churches, Natural parks, Culinary tours, Proximity to larger cities |
| Falcade | Known for its friendly atmosphere and accessibility to ski lifts, it’s excellent for winter sports and a cozy getaway for families and groups. | Falcade Ski Resort, Local festivals, Scenic viewpoints, Hiking and biking trails, Miniature train rides, Winter sports events |
Understanding Airbnb License Requirements & STR Laws in Arabba (2026)
Yes, Arabba, Veneto, Italy enforces high STR regulations. Obtaining a license and ensuring compliance is almost certainly required according to current 2026 STR laws. Always verify the latest short term rental regulations and Airbnb license requirements directly with local government authorities for Arabba to ensure full compliance before hosting.
(Source: AirROI data, 2026, based on 86% licensed listings)
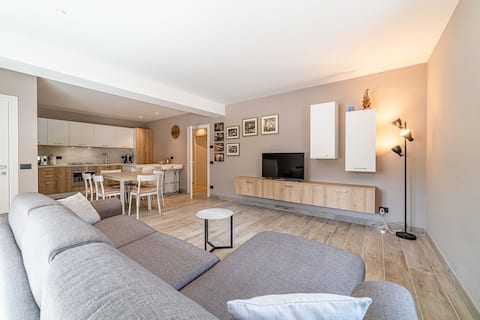
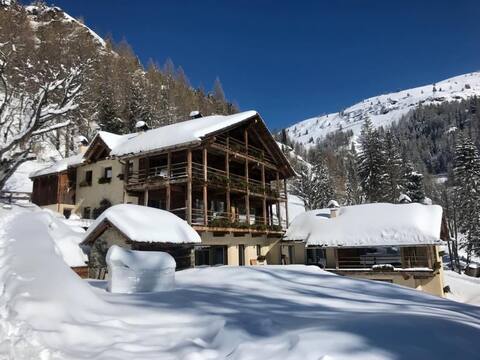
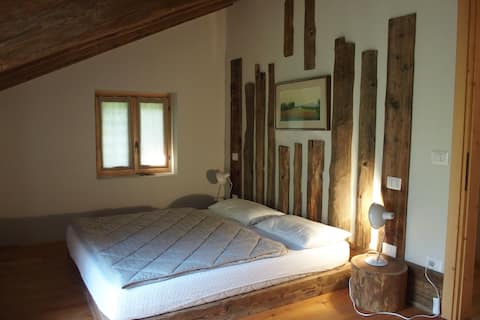
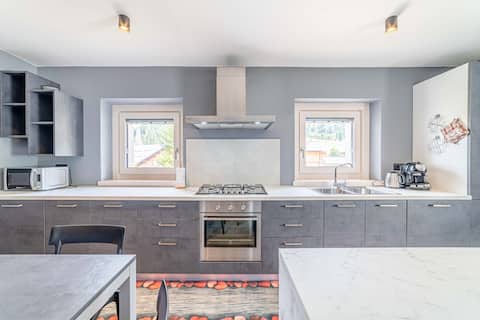
Top Performing Airbnb Properties in Arabba (2026)
Benchmark your potential! Explore examples of top-performing Airbnb properties in Arabbabased on Trailing Twelve Month (TTM) revenue. Analyze their characteristics, revenue, occupancy rate, and ADR to understand what drives success in this market.
Burz, Blizzard apartments Dolomiti ski in/out
Entire Place • 2 bedrooms

Fantastic three-room apartment in an ancient farmhouse
Entire Place • 2 bedrooms
Maso - Dolomiti Luxury Chalet
Entire Place • 4 bedrooms

Maso + Masetto - Dolomites Luxury Chalet
Entire Place • 8 bedrooms
THE HOUSE IN THE WOODS 4
Entire Place • 2 bedrooms
Bec de roces, Blizzard apartments Dolomiti view
Entire Place • 2 bedrooms
Note: Performance varies based on location, size, amenities, seasonality, and management quality. Data reflects the past 12 months.
Top Performing Airbnb Hosts in Arabba (2026)
Learn from the best! This table showcases top-performing Airbnb hosts in Arabba based on the number of properties managed and estimated total revenue over the past year. Analyze their scale and performance metrics.
| Host Name | Properties | Grossing Revenue | Stay Reviews | Avg Rating |
|---|---|---|---|---|
| Yuri | 4 | $156,406 | 41 | 4.95/5.0 |
| G Rent Spa | 2 | $106,457 | 2 | Not Rated |
| Antica Dimora | 1 | $66,029 | 39 | 4.82/5.0 |
| Sandro | 2 | $59,892 | 133 | 4.77/5.0 |
| Rosvitta | 2 | $36,499 | 64 | 4.79/5.0 |
| Lucia | 1 | $33,451 | 22 | 4.55/5.0 |
| Walter Luigi | 1 | $33,285 | 15 | 5.00/5.0 |
| Christina | 1 | $26,620 | 60 | 4.88/5.0 |
| Helen | 3 | $23,471 | 152 | 4.87/5.0 |
| Paolo | 1 | $22,038 | 37 | 4.97/5.0 |
Analyzing the strategies of top hosts, such as their property selection, pricing, and guest communication, can offer valuable lessons for optimizing your own Airbnb operations in Arabba.
Dive Deeper: Advanced Arabba STR Market Data (2026)
Ready to unlock more insights? AirROI provides access to advanced metrics and comprehensive Airbnb data for Arabba. Explore detailed analytics beyond this report to refine your investment strategy, optimize pricing, and maximize your vacation rental profits.
Explore Advanced MetricsArabba Short-Term Rental Market Composition (2026): Property & Room Types
Room Type Distribution
Property Type Distribution
Market Composition Insights for Arabba
- The Arabba Airbnb market composition is heavily skewed towards Entire Home/Apt listings, which make up 90.9% of the 22 active rentals. This indicates strong guest preference for privacy and space.
- Looking at the property type distribution in Arabba, Apartment/Condo properties are the most common (77.3%), reflecting the local real estate landscape.
- The presence of 9.1% Hotel/Boutique listings indicates integration with traditional hospitality.
- Smaller segments like outdoor/unique (combined 4.5%) offer potential for unique stay experiences.
Arabba Airbnb Room Capacity Analysis (2026): Bedroom Distribution
Distribution of Listings by Number of Bedrooms
Room Capacity Insights for Arabba
- The dominant room capacity in Arabba is 2 bedrooms listings, making up 50% of the market. This suggests a strong demand for properties suitable for couples or solo travelers.
- Together, 2 bedrooms and 1 bedroom properties represent 77.3% of the active Airbnb listings in Arabba, indicating a high concentration in these sizes.
Arabba Vacation Rental Guest Capacity Trends (2026)
Distribution of Listings by Guest Capacity
Guest Capacity Insights for Arabba
- The most common guest capacity trend in Arabba vacation rentals is listings accommodating 4 guests (54.5%). This suggests the primary traveler segment is likely small families or groups.
- Properties designed for 4 guests and 8+ guests dominate the Arabba STR market, accounting for 68.1% of listings.
- 22.7% of properties accommodate 6+ guests, serving the market segment for larger families or group travel in Arabba.
- On average, properties in Arabba are equipped to host 4.2 guests.
Arabba Airbnb Booking Patterns (2026): Available vs. Booked Days
Available Days Distribution
Booked Days Distribution
Booking Pattern Insights for Arabba
- The most common availability pattern in Arabba falls within the 181-270 days range, representing 45.5% of listings. This suggests many properties have significant open periods on their calendars.
- Approximately 91.0% of listings show high availability (181+ days open annually), indicating potential for increased bookings or specific owner usage patterns.
- For booked days, the 91-180 days range is most frequent in Arabba (45.5%), reflecting common guest stay durations or potential owner blocking patterns.
- A notable 9.1% of properties secure long booking periods (181+ days booked per year), highlighting successful long-term rental strategies or significant owner usage.
Arabba Airbnb Minimum Stay Requirements Analysis
Distribution of Listings by Minimum Night Requirement
1 Night
2 listings
9.1% of total
3 Nights
1 listings
4.5% of total
4-6 Nights
2 listings
9.1% of total
7-29 Nights
2 listings
9.1% of total
30+ Nights
15 listings
68.2% of total
Key Insights
- The most prevalent minimum stay requirement in Arabba is 30+ Nights, adopted by 68.2% of listings. This highlights the market's preference for longer commitments.
- Very short stays (1-2 nights) are less common (9.1%), suggesting hosts prefer slightly longer bookings to optimize turnover.
- A significant segment (68.2%) caters to monthly stays (30+ nights) in Arabba, pointing to opportunities in the extended-stay market.
Recommendations
- Align with the market by considering a 30+ Nights minimum stay, as 68.2% of Arabba hosts use this setting.
- If feasible, allowing 1-night stays, especially midweek or during low season, could capture last-minute bookings, as only 9.1% currently do.
- Explore offering discounts for stays of 30+ nights to attract the 68.2% of the market seeking extended stays.
- Adjust minimum nights based on seasonality – potentially shorter during low season and longer during peak demand periods in Arabba.
Arabba Airbnb Cancellation Policy Trends Analysis (2026)
Super Strict 60 Days
2 listings
9.1% of total
Super Strict 30 Days
1 listings
4.5% of total
Limited
1 listings
4.5% of total
Moderate
5 listings
22.7% of total
Firm
12 listings
54.5% of total
Strict
1 listings
4.5% of total
Cancellation Policy Insights for Arabba
- The prevailing Airbnb cancellation policy trend in Arabba is Firm, used by 54.5% of listings.
- A majority (59.0%) of hosts in Arabba utilize Firm or Strict policies, indicating a market where hosts prioritize booking security.
- Strict cancellation policies are quite rare (4.5%), potentially making listings with this policy less competitive unless justified by high demand or property type.
Recommendations for Hosts
- Consider adopting a Firm policy to align with the 54.5% market standard in Arabba.
- Using a Strict policy might deter some guests, as only 4.5% of listings use it. Evaluate if potential revenue protection outweighs possible lower booking rates.
- Regularly review your cancellation policy against competitors and market demand shifts in Arabba.
Arabba STR Booking Lead Time Analysis (2026)
Average Booking Lead Time by Month
Booking Lead Time Insights for Arabba
- The overall average booking lead time for vacation rentals in Arabba is 74 days.
- Guests book furthest in advance for stays during January (average 127 days), likely coinciding with peak travel demand or local events.
- The shortest booking windows occur for stays in November (average 7 days), indicating more last-minute travel plans during this time.
- Seasonally, Winter (119 days avg.) sees the longest lead times, while Fall (40 days avg.) has the shortest, reflecting typical travel planning cycles.
Recommendations for Hosts
- Use the overall average lead time (74 days) as a baseline for your pricing and availability strategy in Arabba.
- For January stays, consider implementing length-of-stay discounts or slightly higher rates for bookings made less than 127 days out to capitalize on advance planning.
- During November, focus on last-minute booking availability and promotions, as guests book with very short notice (7 days avg.).
- Target marketing efforts for the Winter season well in advance (at least 119 days) to capture early planners.
- Monitor your own booking lead times against these Arabba averages to identify opportunities for dynamic pricing adjustments.
Popular & Essential Airbnb Amenities in Arabba (2026)
Amenity Prevalence
Amenity Insights for Arabba
- Essential amenities in Arabba that guests expect include: Hair dryer, Wifi, Heating, Free parking on premises. Lacking these (any) could significantly impact bookings.
- Popular amenities like TV, Essentials, Kitchen are common but not universal. Offering these can provide a competitive edge.
Recommendations for Hosts
- Ensure your listing includes all essential amenities for Arabba: Hair dryer, Wifi, Heating, Free parking on premises.
- Prioritize adding missing essentials: Heating, Free parking on premises.
- Consider adding popular differentiators like TV or Essentials to increase appeal.
- Highlight unique or less common amenities you offer (e.g., hot tub, dedicated workspace, EV charger) in your listing description and photos.
- Regularly check competitor amenities in Arabba to stay competitive.
Arabba Airbnb Guest Demographics & Profile Analysis (2026)
Guest Profile Summary for Arabba
- The typical guest profile for Airbnb in Arabba consists of predominantly international visitors (77%), with top international origins including Germany, typically belonging to the Post-2000s (Gen Z/Alpha) group (50%), primarily speaking English or Spanish.
- Domestic travelers account for 23.0% of guests.
- Key international markets include Italy (23%) and Germany (13%).
- Top languages spoken are English (39.1%) followed by Spanish (13.6%).
- A significant demographic segment is the Post-2000s (Gen Z/Alpha) group, representing 50% of guests.
Recommendations for Hosts
- Focus marketing internationally, particularly towards travelers from Germany.
- Tailor amenities and listing descriptions to appeal to the dominant Post-2000s (Gen Z/Alpha) demographic (e.g., highlight fast WiFi, smart home features, local guides).
- Highlight unique local experiences or amenities relevant to the primary guest profile.
- Consider seasonal promotions aligned with peak travel times for key origin markets.
Nearby Short-Term Rental Market Comparison
How does the Arabba Airbnb market stack up against its neighbors? Compare key performance metrics like average monthly revenue, ADR, and occupancy rates in surrounding areas to understand the broader regional STR landscape.
| Market | Active Properties | Monthly Revenue | Daily Rate | Avg. Occupancy |
|---|---|---|---|---|
| Scheffau am Wilden Kaiser | 12 | $6,669 | $906.83 | 30% |
| Sankt Pankraz - San Pancrazio | 12 | $6,528 | $633.65 | 29% |
| Balderschwang | 10 | $5,253 | $304.03 | 58% |
| Urtijëi - St. Ulrich in Gröden - Ortisei | 172 | $5,054 | $718.33 | 41% |
| Kiens - Chienes | 17 | $3,715 | $377.77 | 48% |
| Cortina d'Ampezzo | 309 | $3,646 | $474.12 | 40% |
| Going am Wilden Kaiser | 27 | $3,596 | $406.50 | 37% |
| Kramsach | 12 | $3,573 | $272.32 | 48% |
| Bayrischzell | 41 | $3,550 | $389.91 | 33% |
| Krimml | 53 | $3,544 | $359.14 | 41% |