Arcugnano Airbnb Market Analysis 2026: Short Term Rental Data & Vacation Rental Statistics in Veneto, Italy
Is Airbnb profitable in Arcugnano in 2026? Explore comprehensive Airbnb analytics for Arcugnano, Veneto, Italy to uncover income potential. This 2026 STR market report for Arcugnano, based on AirROI data from February 2025 to January 2026, reveals key trends in the niche market of 22 active listings.
Whether you're considering an Airbnb investment in Arcugnano, optimizing your existing vacation rental, or exploring rental arbitrage opportunities, understanding the Arcugnano Airbnb data is crucial. Navigating the high regulation landscape is key to maximizing your short term rental income potential. Let's dive into the specifics.
Key Arcugnano Airbnb Performance Metrics Overview
Monthly Airbnb Revenue Variations & Income Potential in Arcugnano (2026)
Understanding the monthly revenue variations for Airbnb listings in Arcugnano is key to maximizing your short term rental income potential. Seasonality significantly impacts earnings. Our analysis, based on data from the past 12 months, shows that the peak revenue month for STRs in Arcugnano is typically January, while February often presents the lowest earnings, highlighting opportunities for strategic pricing adjustments during shoulder and low seasons. Explore the typical Airbnb income in Arcugnano across different performance tiers:
- Best-in-class properties (Top 10%) achieve $5,144+ monthly, often utilizing dynamic pricing and superior guest experiences.
- Strong performing properties (Top 25%) earn $2,968 or more, indicating effective management and desirable locations/amenities.
- Typical properties (Median) generate around $1,540 per month, representing the average market performance.
- Entry-level properties (Bottom 25%) see earnings around $675, often with potential for optimization.
Average Monthly Airbnb Earnings Trend in Arcugnano
Arcugnano Airbnb Occupancy Rate Trends (2026)
Maximize your bookings by understanding the Arcugnano STR occupancy trends. Seasonal demand shifts significantly influence how often properties are booked. Typically, Augustsees the highest demand (peak season occupancy), while February experiences the lowest (low season). Effective strategies, like adjusting minimum stays or offering promotions, can boost occupancy during slower periods. Here's how different property tiers perform in Arcugnano:
- Best-in-class properties (Top 10%) achieve 76%+ occupancy, indicating high desirability and potentially optimized availability.
- Strong performing properties (Top 25%) maintain 53% or higher occupancy, suggesting good market fit and guest satisfaction.
- Typical properties (Median) have an occupancy rate around 37%.
- Entry-level properties (Bottom 25%) average 14% occupancy, potentially facing higher vacancy.
Average Monthly Occupancy Rate Trend in Arcugnano
Average Daily Rate (ADR) Airbnb Trends in Arcugnano (2026)
Effective short term rental pricing strategy in Arcugnano involves understanding monthly ADR fluctuations. The Average Daily Rate (ADR) for Airbnb in Arcugnano typically peaks in January and dips lowest during November. Leveraging Airbnb dynamic pricing tools or strategies based on this seasonality can significantly boost revenue. Here's a look at the typical nightly rates achieved:
- Best-in-class properties (Top 10%) command rates of $335+ per night, often due to premium features or locations.
- Strong performing properties (Top 25%) achieve nightly rates of $185 or more.
- Typical properties (Median) charge around $129 per night.
- Entry-level properties (Bottom 25%) earn around $86 per night.
Average Daily Rate (ADR) Trend by Month in Arcugnano
Get Live Arcugnano Market Intelligence 👇

Explore Real-time Analytics
Airbnb Seasonality Analysis & Trends in Arcugnano (2026)
Peak Season (January, July, October)
- Revenue averages $3,032 per month
- Occupancy rates average 43.3%
- Daily rates average $184
Shoulder Season
- Revenue averages $2,096 per month
- Occupancy maintains around 39.1%
- Daily rates hold near $178
Low Season (February, March, November)
- Revenue drops to average $1,368 per month
- Occupancy decreases to average 32.9%
- Daily rates adjust to average $169
Seasonality Insights for Arcugnano
- The Airbnb seasonality in Arcugnano shows highly seasonal trends requiring careful strategy. While the sections above show seasonal averages, it's also insightful to look at the extremes:
- During the high season, the absolute peak month showcases Arcugnano's highest earning potential, with monthly revenues capable of climbing to $3,481, occupancy reaching a high of 49.9%, and ADRs peaking at $200.
- Conversely, the slowest single month of the year, typically falling within the low season, marks the market's lowest point. In this month, revenue might dip to $910, occupancy could drop to 26.8%, and ADRs may adjust down to $166.
- Understanding both the seasonal averages and these monthly peaks and troughs in revenue, occupancy, and ADR is crucial for maximizing your Airbnb profit potential in Arcugnano.
Seasonal Strategies for Maximizing Profit
- Peak Season: Maximize revenue through premium pricing and potentially longer minimum stays. Ensure high availability.
- Low Season: Offer competitive pricing, special promotions (e.g., extended stay discounts), and flexible cancellation policies. Target off-season travelers like remote workers or budget-conscious guests.
- Shoulder Seasons: Implement dynamic pricing that balances peak and low rates. Target weekend travelers or specific events. Offer slightly more flexible terms than peak season.
- Regularly analyze your own performance against these Arcugnano seasonality benchmarks and adjust your pricing and availability strategy accordingly.
Best Areas for Airbnb Investment in Arcugnano (2026)
Exploring the top neighborhoods for short-term rentals in Arcugnano? This section highlights key areas, outlining why they are attractive for hosts and guests, along with notable local attractions. Consider these locations based on your target guest profile and investment strategy.
| Neighborhood / Area | Why Host Here? (Target Guests & Appeal) | Key Attractions & Landmarks |
|---|---|---|
| Monte Berico | Historical and picturesque district known for its beautiful views over Vicenza. Attracts visitors interested in art, culture, and outdoor activities. | Basilica di Monte Berico, Parco Querini, Villa La Rotonda, Teatro Olimpico, Piazza dei Signori |
| Centro Storico | The historic center of Vicenza, filled with Renaissance architecture, shops, and restaurants. Ideal for tourists exploring the city's rich history. | Palladio's Basilica, Piazza dei Signori, Teatro Olimpico, Palazzo Chiericati, Museum of Palazzo Ducale |
| Breganze | Close proximity to wine country and natural landscapes, perfect for those looking to relax in nature and enjoy local wines. Popular for agritourism. | Vineyards, Breganze Wine Festival, Local Trattorias, Hiking Trails, Scenic Routes |
| Arcugnano Centro | A charming municipality with quaint streets and local culture, attracting travelers looking for a more tranquil and authentic experience. | Local Cafés, Parks, Artisan Shops |
| Torri di Quartesolo | A growing suburb of Vicenza with modern amenities and close to transport links, appealing to families and business travelers. | Shopping Malls, Parks, Cafés |
| Costabissara | A peaceful rural area offering a retreat from city life, with the allure of countryside charm and outdoor activities. | Nature Trails, Local Farms, Traditional Italian Food |
| Longare | Known for scenic vistas and a tranquil atmosphere, ideal for outdoor enthusiasts and travelers wanting direct access to nature. | Hiking Paths, Countryside Views, Local Wineries |
| San Vito di Leguzzano | Emphasizing local culture and community, this area is great for visitors interested in regional festivals and traditions. | Cultural Events, Local Markets, Historical Sites |
Understanding Airbnb License Requirements & STR Laws in Arcugnano (2026)
Yes, Arcugnano, Veneto, Italy enforces high STR regulations. Obtaining a license and ensuring compliance is almost certainly required according to current 2026 STR laws. Always verify the latest short term rental regulations and Airbnb license requirements directly with local government authorities for Arcugnano to ensure full compliance before hosting.
(Source: AirROI data, 2026, based on 73% licensed listings)
Top Performing Airbnb Properties in Arcugnano (2026)
Benchmark your potential! Explore examples of top-performing Airbnb properties in Arcugnanobased on Trailing Twelve Month (TTM) revenue. Analyze their characteristics, revenue, occupancy rate, and ADR to understand what drives success in this market.

Loggia overlooking the lake
Entire Place • 2 bedrooms

Independent cottage "Il Bagolaro"
Entire Place • 1 bedroom
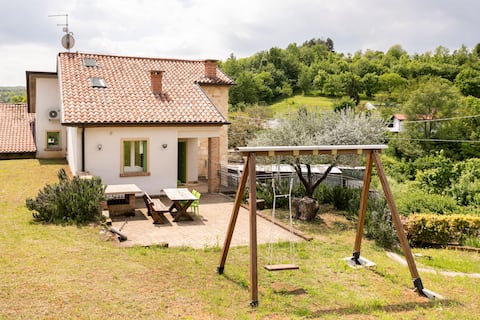
Pietra e Ulivi Country House
Entire Place • 3 bedrooms

Apartment in rustic Il Bagolaro for 4 to 6 people.
Entire Place • 3 bedrooms

Il Trifoglio 15pp w/pool CIN: lT024006B4U4264US9
Entire Place • 6 bedrooms
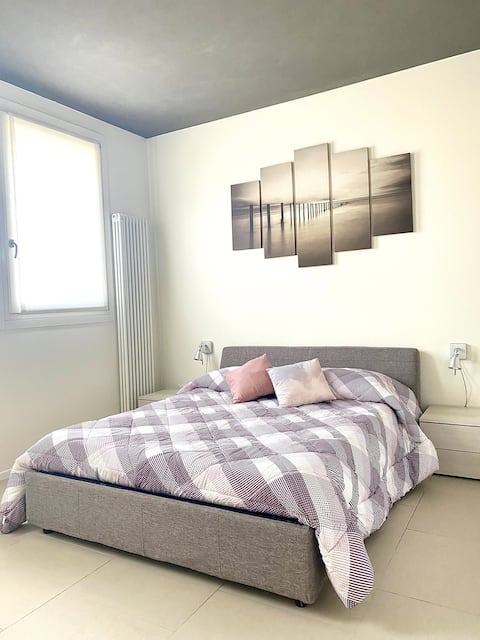
Residenza Sant'Agostino (entire apartment)
Entire Place • 1 bedroom
Note: Performance varies based on location, size, amenities, seasonality, and management quality. Data reflects the past 12 months.
Top Performing Airbnb Hosts in Arcugnano (2026)
Learn from the best! This table showcases top-performing Airbnb hosts in Arcugnano based on the number of properties managed and estimated total revenue over the past year. Analyze their scale and performance metrics.
| Host Name | Properties | Grossing Revenue | Stay Reviews | Avg Rating |
|---|---|---|---|---|
| Novasol | 1 | $61,216 | 42 | 4.86/5.0 |
| Anna | 2 | $59,673 | 129 | 4.92/5.0 |
| Maria Luisa | 5 | $47,489 | 34 | 4.75/5.0 |
| Erica | 1 | $33,288 | 43 | 4.98/5.0 |
| Silvia | 2 | $25,226 | 41 | 4.95/5.0 |
| Stefano | 1 | $19,639 | 28 | 4.64/5.0 |
| Massimo | 1 | $8,117 | 3 | 5.00/5.0 |
| Maria | 1 | $7,565 | 36 | 4.69/5.0 |
| Tutui | 1 | $5,302 | 1 | Not Rated |
| Valeria | 1 | $2,765 | 6 | 4.83/5.0 |
Analyzing the strategies of top hosts, such as their property selection, pricing, and guest communication, can offer valuable lessons for optimizing your own Airbnb operations in Arcugnano.
Dive Deeper: Advanced Arcugnano STR Market Data (2026)
Ready to unlock more insights? AirROI provides access to advanced metrics and comprehensive Airbnb data for Arcugnano. Explore detailed analytics beyond this report to refine your investment strategy, optimize pricing, and maximize your vacation rental profits.
Explore Advanced MetricsArcugnano Short-Term Rental Market Composition (2026): Property & Room Types
Room Type Distribution
Property Type Distribution
Market Composition Insights for Arcugnano
- The Arcugnano Airbnb market composition is heavily skewed towards Entire Home/Apt listings, which make up 77.3% of the 22 active rentals. This indicates strong guest preference for privacy and space.
- Looking at the property type distribution in Arcugnano, House properties are the most common (54.5%), reflecting the local real estate landscape.
- Houses represent a significant 54.5% portion, catering likely to families or larger groups.
- The presence of 18.2% Hotel/Boutique listings indicates integration with traditional hospitality.
- Smaller segments like others (combined 4.5%) offer potential for unique stay experiences.
Arcugnano Airbnb Room Capacity Analysis (2026): Bedroom Distribution
Distribution of Listings by Number of Bedrooms
Room Capacity Insights for Arcugnano
- The dominant room capacity in Arcugnano is 2 bedrooms listings, making up 31.8% of the market. This suggests a strong demand for properties suitable for couples or solo travelers.
- Together, 2 bedrooms and 1 bedroom properties represent 54.5% of the active Airbnb listings in Arcugnano, indicating a high concentration in these sizes.
- A significant 36.3% of listings offer 3+ bedrooms, catering to larger groups and families seeking more space in Arcugnano.
Arcugnano Vacation Rental Guest Capacity Trends (2026)
Distribution of Listings by Guest Capacity
Guest Capacity Insights for Arcugnano
- The most common guest capacity trend in Arcugnano vacation rentals is listings accommodating 6 guests (31.8%). This suggests the primary traveler segment is likely larger groups.
- Properties designed for 6 guests and 4 guests dominate the Arcugnano STR market, accounting for 59.1% of listings.
- 40.9% of properties accommodate 6+ guests, serving the market segment for larger families or group travel in Arcugnano.
- On average, properties in Arcugnano are equipped to host 4.2 guests.
Arcugnano Airbnb Booking Patterns (2026): Available vs. Booked Days
Available Days Distribution
Booked Days Distribution
Booking Pattern Insights for Arcugnano
- The most common availability pattern in Arcugnano falls within the 271-366 days range, representing 72.7% of listings. This suggests many properties have significant open periods on their calendars.
- Approximately 86.3% of listings show high availability (181+ days open annually), indicating potential for increased bookings or specific owner usage patterns.
- For booked days, the 1-30 days range is most frequent in Arcugnano (50%), reflecting common guest stay durations or potential owner blocking patterns.
- A notable 18.2% of properties secure long booking periods (181+ days booked per year), highlighting successful long-term rental strategies or significant owner usage.
Arcugnano Airbnb Minimum Stay Requirements Analysis
Distribution of Listings by Minimum Night Requirement
1 Night
4 listings
18.2% of total
2 Nights
5 listings
22.7% of total
3 Nights
1 listings
4.5% of total
4-6 Nights
3 listings
13.6% of total
7-29 Nights
1 listings
4.5% of total
30+ Nights
8 listings
36.4% of total
Key Insights
- The most prevalent minimum stay requirement in Arcugnano is 30+ Nights, adopted by 36.4% of listings. This highlights the market's preference for longer commitments.
- A significant segment (36.4%) caters to monthly stays (30+ nights) in Arcugnano, pointing to opportunities in the extended-stay market.
Recommendations
- Align with the market by considering a 30+ Nights minimum stay, as 36.4% of Arcugnano hosts use this setting.
- If feasible, allowing 1-night stays, especially midweek or during low season, could capture last-minute bookings, as only 18.2% currently do.
- Explore offering discounts for stays of 30+ nights to attract the 36.4% of the market seeking extended stays.
- Adjust minimum nights based on seasonality – potentially shorter during low season and longer during peak demand periods in Arcugnano.
Arcugnano Airbnb Cancellation Policy Trends Analysis (2026)
Super Strict 60 Days
5 listings
22.7% of total
Flexible
8 listings
36.4% of total
Moderate
7 listings
31.8% of total
Firm
1 listings
4.5% of total
Strict
1 listings
4.5% of total
Cancellation Policy Insights for Arcugnano
- The prevailing Airbnb cancellation policy trend in Arcugnano is Flexible, used by 36.4% of listings.
- There's a relatively balanced mix between guest-friendly (68.2%) and stricter (9.0%) policies, offering choices for different guest needs.
- Strict cancellation policies are quite rare (4.5%), potentially making listings with this policy less competitive unless justified by high demand or property type.
Recommendations for Hosts
- Consider adopting a Flexible policy to align with the 36.4% market standard in Arcugnano.
- Using a Strict policy might deter some guests, as only 4.5% of listings use it. Evaluate if potential revenue protection outweighs possible lower booking rates.
- Regularly review your cancellation policy against competitors and market demand shifts in Arcugnano.
Arcugnano STR Booking Lead Time Analysis (2026)
Average Booking Lead Time by Month
Booking Lead Time Insights for Arcugnano
- The overall average booking lead time for vacation rentals in Arcugnano is 58 days.
- Guests book furthest in advance for stays during September (average 107 days), likely coinciding with peak travel demand or local events.
- The shortest booking windows occur for stays in December (average 11 days), indicating more last-minute travel plans during this time.
- Seasonally, Summer (57 days avg.) sees the longest lead times, while Winter (49 days avg.) has the shortest, reflecting typical travel planning cycles.
Recommendations for Hosts
- Use the overall average lead time (58 days) as a baseline for your pricing and availability strategy in Arcugnano.
- For September stays, consider implementing length-of-stay discounts or slightly higher rates for bookings made less than 107 days out to capitalize on advance planning.
- During December, focus on last-minute booking availability and promotions, as guests book with very short notice (11 days avg.).
- Target marketing efforts for the Summer season well in advance (at least 57 days) to capture early planners.
- Monitor your own booking lead times against these Arcugnano averages to identify opportunities for dynamic pricing adjustments.
Popular & Essential Airbnb Amenities in Arcugnano (2026)
Amenity Prevalence
Amenity Insights for Arcugnano
- Essential amenities in Arcugnano that guests expect include: Wifi, Heating, Free parking on premises, Air conditioning. Lacking these (any) could significantly impact bookings.
- Popular amenities like TV, Hair dryer, Kitchen are common but not universal. Offering these can provide a competitive edge.
Recommendations for Hosts
- Ensure your listing includes all essential amenities for Arcugnano: Wifi, Heating, Free parking on premises, Air conditioning.
- Prioritize adding missing essentials: Heating, Free parking on premises, Air conditioning.
- Consider adding popular differentiators like TV or Hair dryer to increase appeal.
- Highlight unique or less common amenities you offer (e.g., hot tub, dedicated workspace, EV charger) in your listing description and photos.
- Regularly check competitor amenities in Arcugnano to stay competitive.
Arcugnano Airbnb Guest Demographics & Profile Analysis (2026)
Guest Profile Summary for Arcugnano
- The typical guest profile for Airbnb in Arcugnano consists of predominantly international visitors (91%), with top international origins including United States, typically belonging to the Post-2000s (Gen Z/Alpha) group (50%), primarily speaking English or German.
- Domestic travelers account for 8.6% of guests.
- Key international markets include Germany (20%) and United States (14.3%).
- Top languages spoken are English (40.5%) followed by German (21.4%).
- A significant demographic segment is the Post-2000s (Gen Z/Alpha) group, representing 50% of guests.
Recommendations for Hosts
- Focus marketing internationally, particularly towards travelers from United States.
- Tailor amenities and listing descriptions to appeal to the dominant Post-2000s (Gen Z/Alpha) demographic (e.g., highlight fast WiFi, smart home features, local guides).
- Highlight unique local experiences or amenities relevant to the primary guest profile.
- Consider seasonal promotions aligned with peak travel times for key origin markets.
Nearby Short-Term Rental Market Comparison
How does the Arcugnano Airbnb market stack up against its neighbors? Compare key performance metrics like average monthly revenue, ADR, and occupancy rates in surrounding areas to understand the broader regional STR landscape.
| Market | Active Properties | Monthly Revenue | Daily Rate | Avg. Occupancy |
|---|---|---|---|---|
| Sankt Pankraz - San Pancrazio | 12 | $6,528 | $633.65 | 29% |
| Urtijëi - St. Ulrich in Gröden - Ortisei | 172 | $5,054 | $718.33 | 41% |
| Kiens - Chienes | 17 | $3,715 | $377.77 | 48% |
| Cortina d'Ampezzo | 309 | $3,646 | $474.12 | 40% |
| Moos in Passeier - Moso in Passiria | 20 | $3,504 | $547.30 | 23% |
| Colle Santa Lucia | 21 | $3,353 | $248.56 | 46% |
| Lajen - Laion | 96 | $3,338 | $548.27 | 36% |
| Merano | 28 | $3,288 | $309.99 | 46% |
| Santa Cristina Gherdëina - St. Christina in Gröden - Santa Cristina Valgardena | 102 | $3,264 | $408.62 | 41% |
| Großkirchheim | 12 | $3,022 | $273.94 | 39% |