Castelletto Airbnb Market Analysis 2026: Short Term Rental Data & Vacation Rental Statistics in Veneto, Italy
Is Airbnb profitable in Castelletto in 2026? Explore comprehensive Airbnb analytics for Castelletto, Veneto, Italy to uncover income potential. This 2026 STR market report for Castelletto, based on AirROI data from February 2025 to January 2026, reveals key trends in the niche market of 100 active listings.
Whether you're considering an Airbnb investment in Castelletto, optimizing your existing vacation rental, or exploring rental arbitrage opportunities, understanding the Castelletto Airbnb data is crucial. Navigating the high regulation landscape is key to maximizing your short term rental income potential. Let's dive into the specifics.
Key Castelletto Airbnb Performance Metrics Overview
Monthly Airbnb Revenue Variations & Income Potential in Castelletto (2026)
Understanding the monthly revenue variations for Airbnb listings in Castelletto is key to maximizing your short term rental income potential. Seasonality significantly impacts earnings. Our analysis, based on data from the past 12 months, shows that the peak revenue month for STRs in Castelletto is typically August, while February often presents the lowest earnings, highlighting opportunities for strategic pricing adjustments during shoulder and low seasons. Explore the typical Airbnb income in Castelletto across different performance tiers:
- Best-in-class properties (Top 10%) achieve $4,620+ monthly, often utilizing dynamic pricing and superior guest experiences.
- Strong performing properties (Top 25%) earn $3,067 or more, indicating effective management and desirable locations/amenities.
- Typical properties (Median) generate around $1,795 per month, representing the average market performance.
- Entry-level properties (Bottom 25%) see earnings around $810, often with potential for optimization.
Average Monthly Airbnb Earnings Trend in Castelletto
Castelletto Airbnb Occupancy Rate Trends (2026)
Maximize your bookings by understanding the Castelletto STR occupancy trends. Seasonal demand shifts significantly influence how often properties are booked. Typically, Augustsees the highest demand (peak season occupancy), while February experiences the lowest (low season). Effective strategies, like adjusting minimum stays or offering promotions, can boost occupancy during slower periods. Here's how different property tiers perform in Castelletto:
- Best-in-class properties (Top 10%) achieve 70%+ occupancy, indicating high desirability and potentially optimized availability.
- Strong performing properties (Top 25%) maintain 55% or higher occupancy, suggesting good market fit and guest satisfaction.
- Typical properties (Median) have an occupancy rate around 37%.
- Entry-level properties (Bottom 25%) average 19% occupancy, potentially facing higher vacancy.
Average Monthly Occupancy Rate Trend in Castelletto
Average Daily Rate (ADR) Airbnb Trends in Castelletto (2026)
Effective short term rental pricing strategy in Castelletto involves understanding monthly ADR fluctuations. The Average Daily Rate (ADR) for Airbnb in Castelletto typically peaks in August and dips lowest during March. Leveraging Airbnb dynamic pricing tools or strategies based on this seasonality can significantly boost revenue. Here's a look at the typical nightly rates achieved:
- Best-in-class properties (Top 10%) command rates of $356+ per night, often due to premium features or locations.
- Strong performing properties (Top 25%) achieve nightly rates of $222 or more.
- Typical properties (Median) charge around $152 per night.
- Entry-level properties (Bottom 25%) earn around $120 per night.
Average Daily Rate (ADR) Trend by Month in Castelletto
Get Live Castelletto Market Intelligence 👇

Explore Real-time Analytics
Airbnb Seasonality Analysis & Trends in Castelletto (2026)
Peak Season (August, July, September)
- Revenue averages $4,093 per month
- Occupancy rates average 60.2%
- Daily rates average $216
Shoulder Season
- Revenue averages $2,336 per month
- Occupancy maintains around 36.2%
- Daily rates hold near $204
Low Season (January, February, November)
- Revenue drops to average $862 per month
- Occupancy decreases to average 18.7%
- Daily rates adjust to average $199
Seasonality Insights for Castelletto
- The Airbnb seasonality in Castelletto shows highly seasonal trends requiring careful strategy. While the sections above show seasonal averages, it's also insightful to look at the extremes:
- During the high season, the absolute peak month showcases Castelletto's highest earning potential, with monthly revenues capable of climbing to $4,626, occupancy reaching a high of 65.6%, and ADRs peaking at $222.
- Conversely, the slowest single month of the year, typically falling within the low season, marks the market's lowest point. In this month, revenue might dip to $703, occupancy could drop to 18.2%, and ADRs may adjust down to $193.
- Understanding both the seasonal averages and these monthly peaks and troughs in revenue, occupancy, and ADR is crucial for maximizing your Airbnb profit potential in Castelletto.
Seasonal Strategies for Maximizing Profit
- Peak Season: Maximize revenue through premium pricing and potentially longer minimum stays. Ensure high availability.
- Low Season: Offer competitive pricing, special promotions (e.g., extended stay discounts), and flexible cancellation policies. Target off-season travelers like remote workers or budget-conscious guests.
- Shoulder Seasons: Implement dynamic pricing that balances peak and low rates. Target weekend travelers or specific events. Offer slightly more flexible terms than peak season.
- Regularly analyze your own performance against these Castelletto seasonality benchmarks and adjust your pricing and availability strategy accordingly.
Best Areas for Airbnb Investment in Castelletto (2026)
Exploring the top neighborhoods for short-term rentals in Castelletto? This section highlights key areas, outlining why they are attractive for hosts and guests, along with notable local attractions. Consider these locations based on your target guest profile and investment strategy.
| Neighborhood / Area | Why Host Here? (Target Guests & Appeal) | Key Attractions & Landmarks |
|---|---|---|
| Centro Storico | The historic center of Castelletto is charming and picturesque, offering a true Italian experience and close proximity to local shops and restaurants. | Castelletto's Piazza, Local artisan shops, Historic churches, Inviting cafes and trattorias |
| Lago di Garda | Proximity to Lake Garda makes this area exceptionally attractive to tourists looking for lakeside activities, beautiful views, and nature. | Lakeside beaches, Water sports, Hiking trails, Scenic viewpoints |
| Colli Berici | A beautiful hilly area known for its vineyards and picturesque landscapes, appealing to guests interested in wine tourism and stunning views. | Vineyards, Wine tasting tours, Outdoor activities, Charming villages |
| Parco delle Terme | Nearby thermal baths attract visitors looking for relaxation and wellness, which can be a great opportunity for Airbnb hosts to attract health-conscious tourists. | Thermal spas, Natural parks, Rejuvenating treatments |
| Val Liona | Another gorgeous valley that attracts nature lovers and hikers, as well as families looking to escape to the countryside. | Hiking trails, Nature parks, Cultural heritage sites |
| Monte Berico | Famous for its basilica and scenic routes, this area sees many visitors interested in culture and spirituality. | Basilica of Monte Berico, Panoramic views, Local history |
| Cittadella | A nearby fortified town that is rich in history, providing a unique cultural experience for tourists. | Medieval walls, Historic architecture, Cultural events |
| Vicenza | Close enough to Castelletto, it offers a wider range of urban attractions including museums, theaters, and historic sites, drawing more visitors. | Teatro Olimpico, Vicenza Cathedral, UNESCO World Heritage Sites, Local markets |
Understanding Airbnb License Requirements & STR Laws in Castelletto (2026)
Yes, Castelletto, Veneto, Italy enforces high STR regulations. Obtaining a license and ensuring compliance is almost certainly required according to current 2026 STR laws. Always verify the latest short term rental regulations and Airbnb license requirements directly with local government authorities for Castelletto to ensure full compliance before hosting.
(Source: AirROI data, 2026, based on 84% licensed listings)
Top Performing Airbnb Properties in Castelletto (2026)
Benchmark your potential! Explore examples of top-performing Airbnb properties in Castellettobased on Trailing Twelve Month (TTM) revenue. Analyze their characteristics, revenue, occupancy rate, and ADR to understand what drives success in this market.
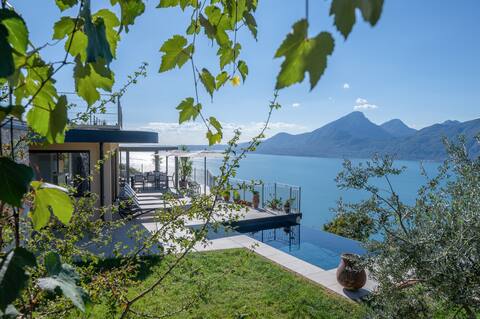
Between lake and sky: Amazing Lake View Villa
Entire Place • 3 bedrooms
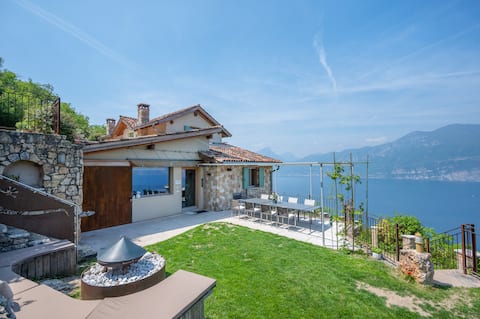
Private luxury villa with breathtaking lake views
Entire Place • 6 bedrooms
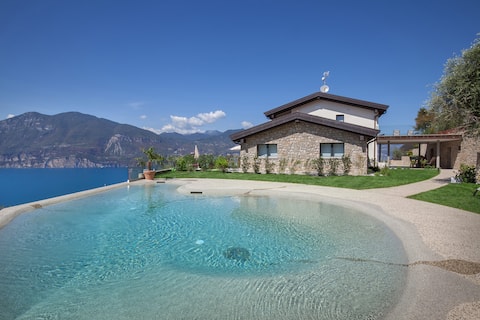
Villa Divina22-APT Divina Pool and lake view
Entire Place • 2 bedrooms
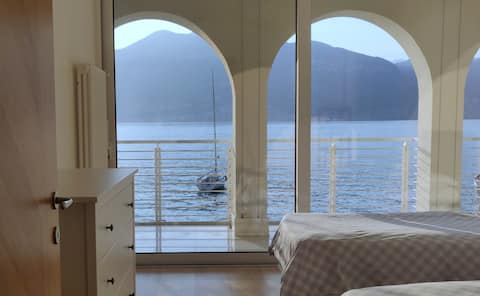
Residence Apartment Biancolago
Entire Place • 3 bedrooms
Villa Divina22 -APT Icona-With pool and lake view
Entire Place • 2 bedrooms
Villa al Feudo: Vacation Home with lake view
Entire Place • 1 bedroom
Note: Performance varies based on location, size, amenities, seasonality, and management quality. Data reflects the past 12 months.
Top Performing Airbnb Hosts in Castelletto (2026)
Learn from the best! This table showcases top-performing Airbnb hosts in Castelletto based on the number of properties managed and estimated total revenue over the past year. Analyze their scale and performance metrics.
| Host Name | Properties | Grossing Revenue | Stay Reviews | Avg Rating |
|---|---|---|---|---|
| Stefano | 6 | $311,217 | 397 | 4.81/5.0 |
| Maibrit | 2 | $261,767 | 25 | 4.96/5.0 |
| Giulia | 12 | $123,492 | 542 | 4.76/5.0 |
| Elisa E Anna | 3 | $107,322 | 200 | 4.96/5.0 |
| Erica | 6 | $103,377 | 362 | 4.85/5.0 |
| Gianangelo | 2 | $101,050 | 39 | 5.00/5.0 |
| Marco | 3 | $86,699 | 140 | 4.82/5.0 |
| Nora | 1 | $74,443 | 58 | 4.97/5.0 |
| Oreste | 10 | $72,606 | 119 | 4.82/5.0 |
| Laura | 2 | $63,244 | 88 | 4.93/5.0 |
Analyzing the strategies of top hosts, such as their property selection, pricing, and guest communication, can offer valuable lessons for optimizing your own Airbnb operations in Castelletto.
Dive Deeper: Advanced Castelletto STR Market Data (2026)
Ready to unlock more insights? AirROI provides access to advanced metrics and comprehensive Airbnb data for Castelletto. Explore detailed analytics beyond this report to refine your investment strategy, optimize pricing, and maximize your vacation rental profits.
Explore Advanced MetricsCastelletto Short-Term Rental Market Composition (2026): Property & Room Types
Room Type Distribution
Property Type Distribution
Market Composition Insights for Castelletto
- The Castelletto Airbnb market composition is heavily skewed towards Entire Home/Apt listings, which make up 93% of the 100 active rentals. This indicates strong guest preference for privacy and space.
- Looking at the property type distribution in Castelletto, Apartment/Condo properties are the most common (70%), reflecting the local real estate landscape.
- Houses represent a significant 19% portion, catering likely to families or larger groups.
- Smaller segments like hotel/boutique (combined 3.0%) offer potential for unique stay experiences.
Castelletto Airbnb Room Capacity Analysis (2026): Bedroom Distribution
Distribution of Listings by Number of Bedrooms
Room Capacity Insights for Castelletto
- The dominant room capacity in Castelletto is 2 bedrooms listings, making up 42% of the market. This suggests a strong demand for properties suitable for couples or solo travelers.
- Together, 2 bedrooms and 1 bedroom properties represent 71.0% of the active Airbnb listings in Castelletto, indicating a high concentration in these sizes.
- Listings with 3+ bedrooms (8.0%) represent a smaller niche, potentially indicating an underserved market for larger group accommodations in Castelletto.
Castelletto Vacation Rental Guest Capacity Trends (2026)
Distribution of Listings by Guest Capacity
Guest Capacity Insights for Castelletto
- The most common guest capacity trend in Castelletto vacation rentals is listings accommodating 4 guests (34%). This suggests the primary traveler segment is likely small families or groups.
- Properties designed for 4 guests and 2 guests dominate the Castelletto STR market, accounting for 54.0% of listings.
- 18.0% of properties accommodate 6+ guests, serving the market segment for larger families or group travel in Castelletto.
- On average, properties in Castelletto are equipped to host 3.8 guests.
Castelletto Airbnb Booking Patterns (2026): Available vs. Booked Days
Available Days Distribution
Booked Days Distribution
Booking Pattern Insights for Castelletto
- The most common availability pattern in Castelletto falls within the 271-366 days range, representing 53% of listings. This suggests many properties have significant open periods on their calendars.
- Approximately 88.0% of listings show high availability (181+ days open annually), indicating potential for increased bookings or specific owner usage patterns.
- For booked days, the 91-180 days range is most frequent in Castelletto (36%), reflecting common guest stay durations or potential owner blocking patterns.
- A notable 15.0% of properties secure long booking periods (181+ days booked per year), highlighting successful long-term rental strategies or significant owner usage.
Castelletto Airbnb Minimum Stay Requirements Analysis
Distribution of Listings by Minimum Night Requirement
1 Night
5 listings
5% of total
2 Nights
4 listings
4% of total
3 Nights
8 listings
8% of total
4-6 Nights
24 listings
24% of total
7-29 Nights
6 listings
6% of total
30+ Nights
53 listings
53% of total
Key Insights
- The most prevalent minimum stay requirement in Castelletto is 30+ Nights, adopted by 53% of listings. This highlights the market's preference for longer commitments.
- Very short stays (1-2 nights) are less common (9.0%), suggesting hosts prefer slightly longer bookings to optimize turnover.
- A significant segment (53%) caters to monthly stays (30+ nights) in Castelletto, pointing to opportunities in the extended-stay market.
Recommendations
- Align with the market by considering a 30+ Nights minimum stay, as 53% of Castelletto hosts use this setting.
- If feasible, allowing 1-night stays, especially midweek or during low season, could capture last-minute bookings, as only 5% currently do.
- Explore offering discounts for stays of 30+ nights to attract the 53% of the market seeking extended stays.
- Adjust minimum nights based on seasonality – potentially shorter during low season and longer during peak demand periods in Castelletto.
Castelletto Airbnb Cancellation Policy Trends Analysis (2026)
Limited
1 listings
1% of total
Super Strict 30 Days
6 listings
6% of total
Flexible
11 listings
11% of total
Moderate
45 listings
45% of total
Firm
34 listings
34% of total
Strict
3 listings
3% of total
Cancellation Policy Insights for Castelletto
- The prevailing Airbnb cancellation policy trend in Castelletto is Moderate, used by 45% of listings.
- There's a relatively balanced mix between guest-friendly (56.0%) and stricter (37.0%) policies, offering choices for different guest needs.
- Strict cancellation policies are quite rare (3%), potentially making listings with this policy less competitive unless justified by high demand or property type.
Recommendations for Hosts
- Consider adopting a Moderate policy to align with the 45% market standard in Castelletto.
- Using a Strict policy might deter some guests, as only 3% of listings use it. Evaluate if potential revenue protection outweighs possible lower booking rates.
- Regularly review your cancellation policy against competitors and market demand shifts in Castelletto.
Castelletto STR Booking Lead Time Analysis (2026)
Average Booking Lead Time by Month
Booking Lead Time Insights for Castelletto
- The overall average booking lead time for vacation rentals in Castelletto is 70 days.
- Guests book furthest in advance for stays during August (average 96 days), likely coinciding with peak travel demand or local events.
- The shortest booking windows occur for stays in December (average 29 days), indicating more last-minute travel plans during this time.
- Seasonally, Summer (86 days avg.) sees the longest lead times, while Winter (36 days avg.) has the shortest, reflecting typical travel planning cycles.
Recommendations for Hosts
- Use the overall average lead time (70 days) as a baseline for your pricing and availability strategy in Castelletto.
- For August stays, consider implementing length-of-stay discounts or slightly higher rates for bookings made less than 96 days out to capitalize on advance planning.
- Target marketing efforts for the Summer season well in advance (at least 86 days) to capture early planners.
- Monitor your own booking lead times against these Castelletto averages to identify opportunities for dynamic pricing adjustments.
Popular & Essential Airbnb Amenities in Castelletto (2026)
Amenity Prevalence
Amenity Insights for Castelletto
- Popular amenities like Wifi, Kitchen, Free parking on premises are common but not universal. Offering these can provide a competitive edge.
- Warning: Wifi is not universally provided but is considered essential globally. Ensure reliable Wifi is offered.
Recommendations for Hosts
- Consider adding popular differentiators like Wifi or Kitchen to increase appeal.
- Highlight unique or less common amenities you offer (e.g., hot tub, dedicated workspace, EV charger) in your listing description and photos.
- Regularly check competitor amenities in Castelletto to stay competitive.
Castelletto Airbnb Guest Demographics & Profile Analysis (2026)
Guest Profile Summary for Castelletto
- The typical guest profile for Airbnb in Castelletto consists of predominantly international visitors (96%), with top international origins including France, typically belonging to the Post-2000s (Gen Z/Alpha) group (50%), primarily speaking English or German.
- Domestic travelers account for 3.7% of guests.
- Key international markets include Germany (43.5%) and France (9.9%).
- Top languages spoken are English (42.6%) followed by German (24.4%).
- A significant demographic segment is the Post-2000s (Gen Z/Alpha) group, representing 50% of guests.
Recommendations for Hosts
- Focus marketing internationally, particularly towards travelers from France.
- Tailor amenities and listing descriptions to appeal to the dominant Post-2000s (Gen Z/Alpha) demographic (e.g., highlight fast WiFi, smart home features, local guides).
- Highlight unique local experiences or amenities relevant to the primary guest profile.
- Consider seasonal promotions aligned with peak travel times for key origin markets.
Nearby Short-Term Rental Market Comparison
How does the Castelletto Airbnb market stack up against its neighbors? Compare key performance metrics like average monthly revenue, ADR, and occupancy rates in surrounding areas to understand the broader regional STR landscape.
| Market | Active Properties | Monthly Revenue | Daily Rate | Avg. Occupancy |
|---|---|---|---|---|
| Sankt Pankraz - San Pancrazio | 12 | $6,528 | $633.65 | 29% |
| Urtijëi - St. Ulrich in Gröden - Ortisei | 172 | $5,054 | $718.33 | 41% |
| Laglio | 64 | $4,334 | $518.58 | 43% |
| Kiens - Chienes | 17 | $3,715 | $377.77 | 48% |
| Varenna | 226 | $3,641 | $300.50 | 52% |
| Portofino | 77 | $3,585 | $509.42 | 38% |
| Moos in Passeier - Moso in Passiria | 20 | $3,504 | $547.30 | 23% |
| Bellagio | 461 | $3,466 | $325.87 | 49% |
| Lajen - Laion | 96 | $3,338 | $548.27 | 36% |
| Sala Comacina | 73 | $3,332 | $451.20 | 46% |