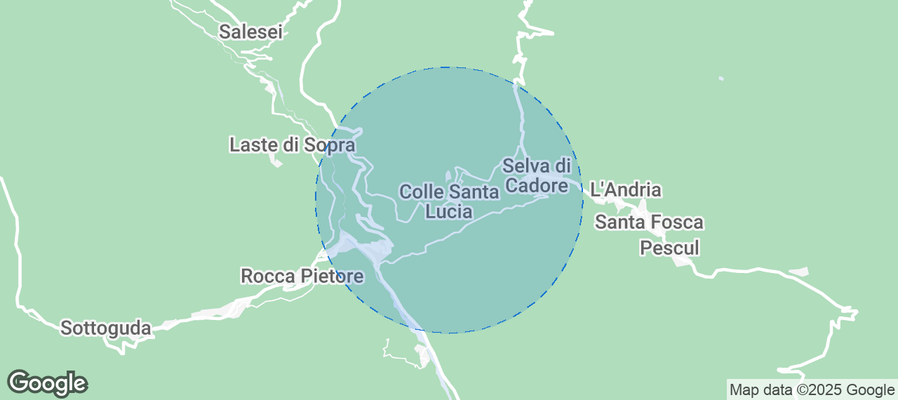
Colle Santa Lucia Airbnb Market Analysis 2026: Short Term Rental Data & Vacation Rental Statistics in Veneto, Italy
Is Airbnb profitable in Colle Santa Lucia in 2026? Explore comprehensive Airbnb analytics for Colle Santa Lucia, Veneto, Italy to uncover income potential. This 2026 STR market report for Colle Santa Lucia, based on AirROI data from February 2025 to January 2026, reveals key trends in the niche market of 21 active listings.
Whether you're considering an Airbnb investment in Colle Santa Lucia, optimizing your existing vacation rental, or exploring rental arbitrage opportunities, understanding the Colle Santa Lucia Airbnb data is crucial. Navigating the high regulation landscape is key to maximizing your short term rental income potential. Let's dive into the specifics.
Key Colle Santa Lucia Airbnb Performance Metrics Overview
Monthly Airbnb Revenue Variations & Income Potential in Colle Santa Lucia (2026)
Understanding the monthly revenue variations for Airbnb listings in Colle Santa Lucia is key to maximizing your short term rental income potential. Seasonality significantly impacts earnings. Our analysis, based on data from the past 12 months, shows that the peak revenue month for STRs in Colle Santa Lucia is typically August, while November often presents the lowest earnings, highlighting opportunities for strategic pricing adjustments during shoulder and low seasons. Explore the typical Airbnb income in Colle Santa Lucia across different performance tiers:
- Best-in-class properties (Top 10%) achieve $9,415+ monthly, often utilizing dynamic pricing and superior guest experiences.
- Strong performing properties (Top 25%) earn $4,200 or more, indicating effective management and desirable locations/amenities.
- Typical properties (Median) generate around $2,694 per month, representing the average market performance.
- Entry-level properties (Bottom 25%) see earnings around $1,705, often with potential for optimization.
Average Monthly Airbnb Earnings Trend in Colle Santa Lucia
Colle Santa Lucia Airbnb Occupancy Rate Trends (2026)
Maximize your bookings by understanding the Colle Santa Lucia STR occupancy trends. Seasonal demand shifts significantly influence how often properties are booked. Typically, Augustsees the highest demand (peak season occupancy), while November experiences the lowest (low season). Effective strategies, like adjusting minimum stays or offering promotions, can boost occupancy during slower periods. Here's how different property tiers perform in Colle Santa Lucia:
- Best-in-class properties (Top 10%) achieve 71%+ occupancy, indicating high desirability and potentially optimized availability.
- Strong performing properties (Top 25%) maintain 60% or higher occupancy, suggesting good market fit and guest satisfaction.
- Typical properties (Median) have an occupancy rate around 45%.
- Entry-level properties (Bottom 25%) average 32% occupancy, potentially facing higher vacancy.
Average Monthly Occupancy Rate Trend in Colle Santa Lucia
Average Daily Rate (ADR) Airbnb Trends in Colle Santa Lucia (2026)
Effective short term rental pricing strategy in Colle Santa Lucia involves understanding monthly ADR fluctuations. The Average Daily Rate (ADR) for Airbnb in Colle Santa Lucia typically peaks in January and dips lowest during April. Leveraging Airbnb dynamic pricing tools or strategies based on this seasonality can significantly boost revenue. Here's a look at the typical nightly rates achieved:
- Best-in-class properties (Top 10%) command rates of $444+ per night, often due to premium features or locations.
- Strong performing properties (Top 25%) achieve nightly rates of $297 or more.
- Typical properties (Median) charge around $174 per night.
- Entry-level properties (Bottom 25%) earn around $139 per night.
Average Daily Rate (ADR) Trend by Month in Colle Santa Lucia
Get Live Colle Santa Lucia Market Intelligence 👇
Explore Real-time Analytics
Airbnb Seasonality Analysis & Trends in Colle Santa Lucia (2026)
Peak Season (August, July, June)
- Revenue averages $7,060 per month
- Occupancy rates average 78.1%
- Daily rates average $250
Shoulder Season
- Revenue averages $3,400 per month
- Occupancy maintains around 43.1%
- Daily rates hold near $216
Low Season (January, November, December)
- Revenue drops to average $1,533 per month
- Occupancy decreases to average 20.2%
- Daily rates adjust to average $261
Seasonality Insights for Colle Santa Lucia
- The Airbnb seasonality in Colle Santa Lucia shows highly seasonal trends requiring careful strategy. While the sections above show seasonal averages, it's also insightful to look at the extremes:
- During the high season, the absolute peak month showcases Colle Santa Lucia's highest earning potential, with monthly revenues capable of climbing to $8,622, occupancy reaching a high of 88.0%, and ADRs peaking at $289.
- Conversely, the slowest single month of the year, typically falling within the low season, marks the market's lowest point. In this month, revenue might dip to $938, occupancy could drop to 18.8%, and ADRs may adjust down to $195.
- Understanding both the seasonal averages and these monthly peaks and troughs in revenue, occupancy, and ADR is crucial for maximizing your Airbnb profit potential in Colle Santa Lucia.
Seasonal Strategies for Maximizing Profit
- Peak Season: Maximize revenue through premium pricing and potentially longer minimum stays. Ensure high availability.
- Low Season: Offer competitive pricing, special promotions (e.g., extended stay discounts), and flexible cancellation policies. Target off-season travelers like remote workers or budget-conscious guests.
- Shoulder Seasons: Implement dynamic pricing that balances peak and low rates. Target weekend travelers or specific events. Offer slightly more flexible terms than peak season.
- Regularly analyze your own performance against these Colle Santa Lucia seasonality benchmarks and adjust your pricing and availability strategy accordingly.
Best Areas for Airbnb Investment in Colle Santa Lucia (2026)
Exploring the top neighborhoods for short-term rentals in Colle Santa Lucia? This section highlights key areas, outlining why they are attractive for hosts and guests, along with notable local attractions. Consider these locations based on your target guest profile and investment strategy.
| Neighborhood / Area | Why Host Here? (Target Guests & Appeal) | Key Attractions & Landmarks |
|---|---|---|
| Colle Santa Lucia Center | A charming village center that captures the essence of the Dolomites, making it attractive for tourists seeking authentic Italian culture and breathtaking mountain views. | Ski slopes of Alpe Lusia, Dolomiti Superski area, Hiking trails, Local restaurants and cafes, Annual festivals |
| Passo San Pellegrino | A nearby mountain pass known for its scenic views and winter sports. It draws adventure seekers year-round, appealing to both winter sports enthusiasts and summer hikers. | San Pellegrino Ski Area, Scenic viewpoints, Mountain biking trails, Alpine cuisine, Relaxation in nature |
| Falcade | A picturesque nearby town ideal for both winter and summer activities. It provides a more local experience away from the crowds, which can be a selling point for potential guests. | Falcade ski resort, Cable car rides, Nature hiking, Traditional Tyrolean architecture, Historic churches |
| Moena | Known as the 'Fairy of the Dolomites', Moena is popular among visitors for its relaxing atmosphere and beautiful scenery. It's a great spot for families and couples. | Beautiful walks in nature, Historic town center, Cultural events, Local food markets, Parks and playgrounds |
| Selva di Cadore | A tranquil village perfect for those looking to escape the busy tourist areas. Offers a strong sense of community, making it ideal for immersive experiences. | Scenic mountain views, Local artisan shops, Traditional festivals, Hiking paths |
| Cortina d'Ampezzo | A luxury ski resort town known worldwide. It attracts high-end tourists and is a prestigious location for hosting Airbnb offerings. | Cortina ski area, Historic centre, Shopping and dining, Cultural events, Dolomite landscapes |
| Zoldo Alto | A lesser-known but beautiful area that offers excellent hiking and skiing opportunities. Its quiet charm can be quite appealing for a more relaxed stay. | Hiking trails, Ski resorts, Scenic mountain vistas, Local gastronomy |
| Belluno | The capital of the province, it combines history and nature. Guests can enjoy both urban and outdoor activities in this less touristy setting. | Historical architecture, Parks, Museums, Cultural events |
Understanding Airbnb License Requirements & STR Laws in Colle Santa Lucia (2026)
Yes, Colle Santa Lucia, Veneto, Italy enforces high STR regulations. Obtaining a license and ensuring compliance is almost certainly required according to current 2026 STR laws. Always verify the latest short term rental regulations and Airbnb license requirements directly with local government authorities for Colle Santa Lucia to ensure full compliance before hosting.
(Source: AirROI data, 2026, based on 100% licensed listings)
Top Performing Airbnb Properties in Colle Santa Lucia (2026)
Benchmark your potential! Explore examples of top-performing Airbnb properties in Colle Santa Luciabased on Trailing Twelve Month (TTM) revenue. Analyze their characteristics, revenue, occupancy rate, and ADR to understand what drives success in this market.
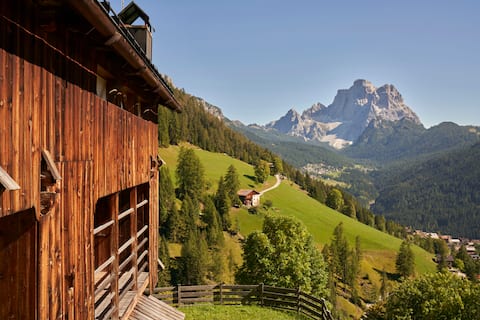
Stunning 3 storey barn with garden and great view
Entire Place • 4 bedrooms
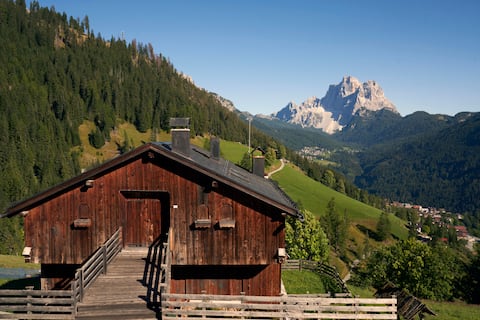
Stunning 2 storey barn with great mountain view
Entire Place • 3 bedrooms

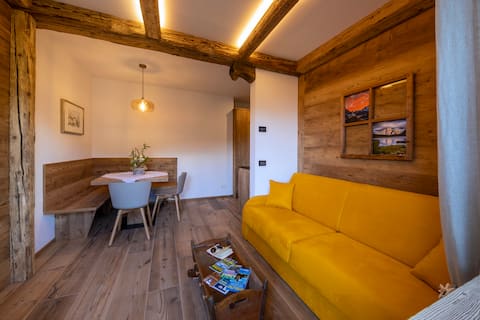
Casa Tie – Space, comfort, garden & stunning views
Entire Place • 4 bedrooms

Tabia Suite Pelmo
Entire Place • 1 bedroom

Panoramic apartment in Colle di Santa Lucia
Entire Place • 3 bedrooms
Luxury Apartment Volp
Entire Place • 1 bedroom
Note: Performance varies based on location, size, amenities, seasonality, and management quality. Data reflects the past 12 months.
Top Performing Airbnb Hosts in Colle Santa Lucia (2026)
Learn from the best! This table showcases top-performing Airbnb hosts in Colle Santa Lucia based on the number of properties managed and estimated total revenue over the past year. Analyze their scale and performance metrics.
| Host Name | Properties | Grossing Revenue | Stay Reviews | Avg Rating |
|---|---|---|---|---|
| James & Amber | 2 | $280,798 | 73 | 5.00/5.0 |
| Raffaella | 4 | $140,285 | 56 | 5.00/5.0 |
| Sven | 1 | $82,222 | 34 | 4.97/5.0 |
| Francesco | 2 | $82,080 | 59 | 4.71/5.0 |
| Luigi | 2 | $67,393 | 519 | 4.95/5.0 |
| Rosanna | 1 | $45,463 | 53 | 4.83/5.0 |
| Hannelore | 2 | $39,961 | 28 | 5.00/5.0 |
| Maurizio | 2 | $27,802 | 142 | 4.83/5.0 |
| Daniela | 1 | $25,453 | 20 | 4.95/5.0 |
| Iacopo | 1 | $14,670 | 12 | 4.67/5.0 |
Analyzing the strategies of top hosts, such as their property selection, pricing, and guest communication, can offer valuable lessons for optimizing your own Airbnb operations in Colle Santa Lucia.
Dive Deeper: Advanced Colle Santa Lucia STR Market Data (2026)
Ready to unlock more insights? AirROI provides access to advanced metrics and comprehensive Airbnb data for Colle Santa Lucia. Explore detailed analytics beyond this report to refine your investment strategy, optimize pricing, and maximize your vacation rental profits.
Explore Advanced MetricsColle Santa Lucia Short-Term Rental Market Composition (2026): Property & Room Types
Room Type Distribution
Property Type Distribution
Market Composition Insights for Colle Santa Lucia
- The Colle Santa Lucia Airbnb market composition is heavily skewed towards Entire Home/Apt listings, which make up 95.2% of the 21 active rentals. This indicates strong guest preference for privacy and space.
- Looking at the property type distribution in Colle Santa Lucia, Apartment/Condo properties are the most common (81%), reflecting the local real estate landscape.
Colle Santa Lucia Airbnb Room Capacity Analysis (2026): Bedroom Distribution
Distribution of Listings by Number of Bedrooms
Room Capacity Insights for Colle Santa Lucia
- The dominant room capacity in Colle Santa Lucia is 1 bedroom listings, making up 47.6% of the market. This suggests a strong demand for properties suitable for couples or solo travelers.
- Together, 1 bedroom and 3 bedrooms properties represent 71.4% of the active Airbnb listings in Colle Santa Lucia, indicating a high concentration in these sizes.
- A significant 38.1% of listings offer 3+ bedrooms, catering to larger groups and families seeking more space in Colle Santa Lucia.
Colle Santa Lucia Vacation Rental Guest Capacity Trends (2026)
Distribution of Listings by Guest Capacity
Guest Capacity Insights for Colle Santa Lucia
- The most common guest capacity trend in Colle Santa Lucia vacation rentals is listings accommodating 4 guests (33.3%). This suggests the primary traveler segment is likely small families or groups.
- Properties designed for 4 guests and 8+ guests dominate the Colle Santa Lucia STR market, accounting for 52.3% of listings.
- 28.6% of properties accommodate 6+ guests, serving the market segment for larger families or group travel in Colle Santa Lucia.
- On average, properties in Colle Santa Lucia are equipped to host 4.4 guests.
Colle Santa Lucia Airbnb Booking Patterns (2026): Available vs. Booked Days
Available Days Distribution
Booked Days Distribution
Booking Pattern Insights for Colle Santa Lucia
- The most common availability pattern in Colle Santa Lucia falls within the 181-270 days range, representing 47.6% of listings. This suggests many properties have significant open periods on their calendars.
- Approximately 66.6% of listings show high availability (181+ days open annually), indicating potential for increased bookings or specific owner usage patterns.
- For booked days, the 91-180 days range is most frequent in Colle Santa Lucia (47.6%), reflecting common guest stay durations or potential owner blocking patterns.
- A notable 33.3% of properties secure long booking periods (181+ days booked per year), highlighting successful long-term rental strategies or significant owner usage.
Colle Santa Lucia Airbnb Minimum Stay Requirements Analysis
Distribution of Listings by Minimum Night Requirement
2 Nights
3 listings
14.3% of total
4-6 Nights
6 listings
28.6% of total
30+ Nights
12 listings
57.1% of total
Key Insights
- The most prevalent minimum stay requirement in Colle Santa Lucia is 30+ Nights, adopted by 57.1% of listings. This highlights the market's preference for longer commitments.
- Very short stays (1-2 nights) are less common (14.3%), suggesting hosts prefer slightly longer bookings to optimize turnover.
- A significant segment (57.1%) caters to monthly stays (30+ nights) in Colle Santa Lucia, pointing to opportunities in the extended-stay market.
Recommendations
- Align with the market by considering a 30+ Nights minimum stay, as 57.1% of Colle Santa Lucia hosts use this setting.
- Explore offering discounts for stays of 30+ nights to attract the 57.1% of the market seeking extended stays.
- Adjust minimum nights based on seasonality – potentially shorter during low season and longer during peak demand periods in Colle Santa Lucia.
Colle Santa Lucia Airbnb Cancellation Policy Trends Analysis (2026)
Super Strict 60 Days
1 listings
4.8% of total
Limited
3 listings
14.3% of total
Flexible
5 listings
23.8% of total
Moderate
2 listings
9.5% of total
Firm
10 listings
47.6% of total
Cancellation Policy Insights for Colle Santa Lucia
- The prevailing Airbnb cancellation policy trend in Colle Santa Lucia is Firm, used by 47.6% of listings.
- There's a relatively balanced mix between guest-friendly (33.3%) and stricter (47.6%) policies, offering choices for different guest needs.
Recommendations for Hosts
- Consider adopting a Firm policy to align with the 47.6% market standard in Colle Santa Lucia.
- Regularly review your cancellation policy against competitors and market demand shifts in Colle Santa Lucia.
Colle Santa Lucia STR Booking Lead Time Analysis (2026)
Average Booking Lead Time by Month
Booking Lead Time Insights for Colle Santa Lucia
- The overall average booking lead time for vacation rentals in Colle Santa Lucia is 85 days.
- Guests book furthest in advance for stays during August (average 142 days), likely coinciding with peak travel demand or local events.
- The shortest booking windows occur for stays in November (average 10 days), indicating more last-minute travel plans during this time.
- Seasonally, Summer (131 days avg.) sees the longest lead times, while Fall (62 days avg.) has the shortest, reflecting typical travel planning cycles.
Recommendations for Hosts
- Use the overall average lead time (85 days) as a baseline for your pricing and availability strategy in Colle Santa Lucia.
- For August stays, consider implementing length-of-stay discounts or slightly higher rates for bookings made less than 142 days out to capitalize on advance planning.
- During November, focus on last-minute booking availability and promotions, as guests book with very short notice (10 days avg.).
- Target marketing efforts for the Summer season well in advance (at least 131 days) to capture early planners.
- Monitor your own booking lead times against these Colle Santa Lucia averages to identify opportunities for dynamic pricing adjustments.
Popular & Essential Airbnb Amenities in Colle Santa Lucia (2026)
Amenity Prevalence
No amenities with partial availability (less than 100%) were found to display in the chart. All essential amenities might be present in all listings. Check insights below.
Amenity Insights for Colle Santa Lucia
- Essential amenities in Colle Santa Lucia that guests expect include: Dishes and silverware, Refrigerator, Dining table, TV, Free parking on premises, Kitchen, Hot water, Heating, Bed linens, Stove. Lacking these (any) could significantly impact bookings.
Recommendations for Hosts
- Ensure your listing includes all essential amenities for Colle Santa Lucia: Dishes and silverware, Refrigerator, Dining table, TV, Free parking on premises, Kitchen, Hot water, Heating, Bed linens, Stove.
- Highlight unique or less common amenities you offer (e.g., hot tub, dedicated workspace, EV charger) in your listing description and photos.
- Regularly check competitor amenities in Colle Santa Lucia to stay competitive.
Colle Santa Lucia Airbnb Guest Demographics & Profile Analysis (2026)
Guest Profile Summary for Colle Santa Lucia
- The typical guest profile for Airbnb in Colle Santa Lucia consists of predominantly international visitors (93%), with top international origins including Germany, typically belonging to the Post-2000s (Gen Z/Alpha) group (50%), primarily speaking English or French.
- Domestic travelers account for 6.7% of guests.
- Key international markets include United States (18.3%) and Germany (10.6%).
- Top languages spoken are English (45%) followed by French (12.8%).
- A significant demographic segment is the Post-2000s (Gen Z/Alpha) group, representing 50% of guests.
Recommendations for Hosts
- Focus marketing internationally, particularly towards travelers from Germany.
- Tailor amenities and listing descriptions to appeal to the dominant Post-2000s (Gen Z/Alpha) demographic (e.g., highlight fast WiFi, smart home features, local guides).
- Highlight unique local experiences or amenities relevant to the primary guest profile.
- Consider seasonal promotions aligned with peak travel times for key origin markets.
Nearby Short-Term Rental Market Comparison
How does the Colle Santa Lucia Airbnb market stack up against its neighbors? Compare key performance metrics like average monthly revenue, ADR, and occupancy rates in surrounding areas to understand the broader regional STR landscape.
| Market | Active Properties | Monthly Revenue | Daily Rate | Avg. Occupancy |
|---|---|---|---|---|
| Scheffau am Wilden Kaiser | 12 | $6,669 | $906.83 | 30% |
| Sankt Pankraz - San Pancrazio | 12 | $6,528 | $633.65 | 29% |
| Urtijëi - St. Ulrich in Gröden - Ortisei | 172 | $5,054 | $718.33 | 41% |
| Hallstatt | 31 | $4,918 | $293.92 | 62% |
| Kiens - Chienes | 17 | $3,715 | $377.77 | 48% |
| Cortina d'Ampezzo | 309 | $3,646 | $474.12 | 40% |
| Going am Wilden Kaiser | 27 | $3,596 | $406.50 | 37% |
| Kramsach | 12 | $3,573 | $272.32 | 48% |
| Bayrischzell | 41 | $3,550 | $389.91 | 33% |
| Krimml | 53 | $3,544 | $359.14 | 41% |