Conegliano Airbnb Market Analysis 2026: Short Term Rental Data & Vacation Rental Statistics in Veneto, Italy
Is Airbnb profitable in Conegliano in 2026? Explore comprehensive Airbnb analytics for Conegliano, Veneto, Italy to uncover income potential. This 2026 STR market report for Conegliano, based on AirROI data from February 2025 to January 2026, reveals key trends in the niche market of 53 active listings.
Whether you're considering an Airbnb investment in Conegliano, optimizing your existing vacation rental, or exploring rental arbitrage opportunities, understanding the Conegliano Airbnb data is crucial. Navigating the high regulation landscape is key to maximizing your short term rental income potential. Let's dive into the specifics.
Key Conegliano Airbnb Performance Metrics Overview
Monthly Airbnb Revenue Variations & Income Potential in Conegliano (2026)
Understanding the monthly revenue variations for Airbnb listings in Conegliano is key to maximizing your short term rental income potential. Seasonality significantly impacts earnings. Our analysis, based on data from the past 12 months, shows that the peak revenue month for STRs in Conegliano is typically July, while February often presents the lowest earnings, highlighting opportunities for strategic pricing adjustments during shoulder and low seasons. Explore the typical Airbnb income in Conegliano across different performance tiers:
- Best-in-class properties (Top 10%) achieve $2,759+ monthly, often utilizing dynamic pricing and superior guest experiences.
- Strong performing properties (Top 25%) earn $1,822 or more, indicating effective management and desirable locations/amenities.
- Typical properties (Median) generate around $1,080 per month, representing the average market performance.
- Entry-level properties (Bottom 25%) see earnings around $500, often with potential for optimization.
Average Monthly Airbnb Earnings Trend in Conegliano
Conegliano Airbnb Occupancy Rate Trends (2026)
Maximize your bookings by understanding the Conegliano STR occupancy trends. Seasonal demand shifts significantly influence how often properties are booked. Typically, Augustsees the highest demand (peak season occupancy), while February experiences the lowest (low season). Effective strategies, like adjusting minimum stays or offering promotions, can boost occupancy during slower periods. Here's how different property tiers perform in Conegliano:
- Best-in-class properties (Top 10%) achieve 71%+ occupancy, indicating high desirability and potentially optimized availability.
- Strong performing properties (Top 25%) maintain 52% or higher occupancy, suggesting good market fit and guest satisfaction.
- Typical properties (Median) have an occupancy rate around 32%.
- Entry-level properties (Bottom 25%) average 15% occupancy, potentially facing higher vacancy.
Average Monthly Occupancy Rate Trend in Conegliano
Average Daily Rate (ADR) Airbnb Trends in Conegliano (2026)
Effective short term rental pricing strategy in Conegliano involves understanding monthly ADR fluctuations. The Average Daily Rate (ADR) for Airbnb in Conegliano typically peaks in January and dips lowest during February. Leveraging Airbnb dynamic pricing tools or strategies based on this seasonality can significantly boost revenue. Here's a look at the typical nightly rates achieved:
- Best-in-class properties (Top 10%) command rates of $171+ per night, often due to premium features or locations.
- Strong performing properties (Top 25%) achieve nightly rates of $132 or more.
- Typical properties (Median) charge around $99 per night.
- Entry-level properties (Bottom 25%) earn around $81 per night.
Average Daily Rate (ADR) Trend by Month in Conegliano
Get Live Conegliano Market Intelligence 👇

Explore Real-time Analytics
Airbnb Seasonality Analysis & Trends in Conegliano (2026)
Peak Season (July, June, August)
- Revenue averages $1,817 per month
- Occupancy rates average 40.2%
- Daily rates average $121
Shoulder Season
- Revenue averages $1,375 per month
- Occupancy maintains around 35.4%
- Daily rates hold near $123
Low Season (February, March, November)
- Revenue drops to average $1,017 per month
- Occupancy decreases to average 31.7%
- Daily rates adjust to average $110
Seasonality Insights for Conegliano
- The Airbnb seasonality in Conegliano shows moderate seasonality with distinct peak and low periods. While the sections above show seasonal averages, it's also insightful to look at the extremes:
- During the high season, the absolute peak month showcases Conegliano's highest earning potential, with monthly revenues capable of climbing to $1,865, occupancy reaching a high of 44.0%, and ADRs peaking at $130.
- Conversely, the slowest single month of the year, typically falling within the low season, marks the market's lowest point. In this month, revenue might dip to $908, occupancy could drop to 28.7%, and ADRs may adjust down to $104.
- Understanding both the seasonal averages and these monthly peaks and troughs in revenue, occupancy, and ADR is crucial for maximizing your Airbnb profit potential in Conegliano.
Seasonal Strategies for Maximizing Profit
- Peak Season: Maximize revenue through premium pricing and potentially longer minimum stays. Ensure high availability.
- Low Season: Offer competitive pricing, special promotions (e.g., extended stay discounts), and flexible cancellation policies. Target off-season travelers like remote workers or budget-conscious guests.
- Shoulder Seasons: Implement dynamic pricing that balances peak and low rates. Target weekend travelers or specific events. Offer slightly more flexible terms than peak season.
- Regularly analyze your own performance against these Conegliano seasonality benchmarks and adjust your pricing and availability strategy accordingly.
Best Areas for Airbnb Investment in Conegliano (2026)
Exploring the top neighborhoods for short-term rentals in Conegliano? This section highlights key areas, outlining why they are attractive for hosts and guests, along with notable local attractions. Consider these locations based on your target guest profile and investment strategy.
| Neighborhood / Area | Why Host Here? (Target Guests & Appeal) | Key Attractions & Landmarks |
|---|---|---|
| Centro Storico | The historical center of Conegliano is rich in culture and history, attracting tourists who want to explore its charming streets, architecture, and local cuisine. | Castello di Conegliano, Duomo di Conegliano, Museo del Caffè, Piazza Cima, Porta di Sant'Antonio |
| Colli di Conegliano | This picturesque area surrounding Conegliano is known for its stunning vineyards and beautiful hills, ideal for tourists seeking wine tours and nature. | Prosecco Wine Tours, Vineyard Walks, Scenic Lookouts, Local Wineries, Nature Trails |
| Villa di Villa | A beautiful 18th-century villa located just outside Conegliano, attracting visitors interested in historical architecture and art. | Villa di Villa, Gardens of Villa di Villa, Art exhibitions, Cultural events |
| Castelbrando | This historic castle turned hotel offers unique accommodation options and attracts visitors looking for a romantic getaway with a view. | Castelbrando Castle, Scenic Views, Culinary Experiences, Historical Tours |
| San Francesco | A tranquil suburb of Conegliano that offers a more relaxed atmosphere, perfect for families and extended stays. | Parks and Recreation Areas, Local Markets, Community Events |
| Strada del Prosecco | Famous for its Prosecco wine, this scenic road attracts wine enthusiasts and foodies alike, with numerous opportunities for tastings and tours. | Vineyards, Wine Tastings, Scenic Drives, Local Bistros |
| Conegliano Golf Club | For sports enthusiasts, this area features a beautiful golf course that attracts visitors looking to enjoy outdoor activities. | Golf Course, Club House, Golf Events |
| Nearby Treviso | Treviso, a neighboring city, offers additional cultural and historical attractions and is a great base for exploring Veneto. | Piazza dei Signori, Canal di Treviso, Bottega Veneta Headquarters, Local Cuisine |
Understanding Airbnb License Requirements & STR Laws in Conegliano (2026)
Yes, Conegliano, Veneto, Italy enforces high STR regulations. Obtaining a license and ensuring compliance is almost certainly required according to current 2026 STR laws. Always verify the latest short term rental regulations and Airbnb license requirements directly with local government authorities for Conegliano to ensure full compliance before hosting.
(Source: AirROI data, 2026, based on 87% licensed listings)
Top Performing Airbnb Properties in Conegliano (2026)
Benchmark your potential! Explore examples of top-performing Airbnb properties in Coneglianobased on Trailing Twelve Month (TTM) revenue. Analyze their characteristics, revenue, occupancy rate, and ADR to understand what drives success in this market.
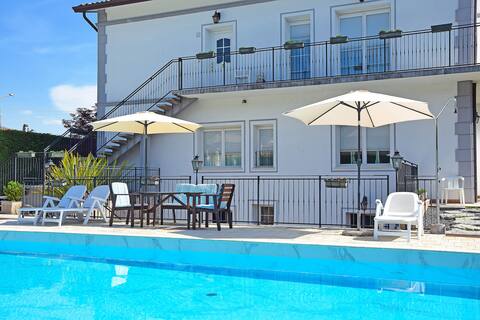
Entire villa with private pool in Conegliano
Entire Place • 5 bedrooms

The Central
Entire Place • 3 bedrooms

Wine & Relax on the hills of Prosecco!
Entire Place • 5 bedrooms
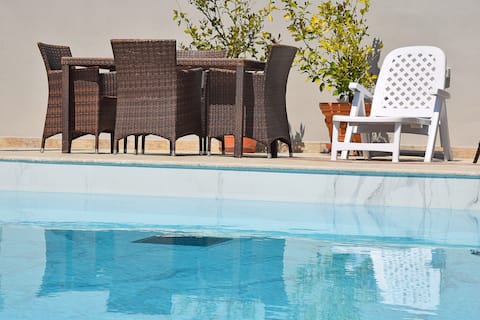
Colline dei Dogi in Conegliano in a villa with pool
Entire Place • 2 bedrooms

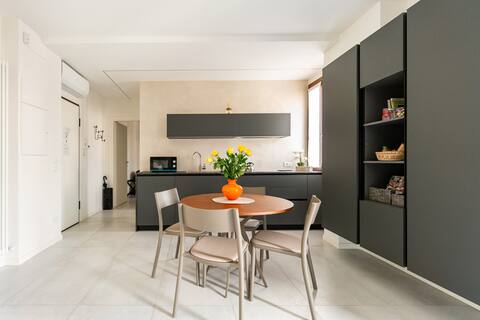
Luxury Apartment Conegliano Centro
Entire Place • 2 bedrooms
Conegliano Deluxe Apartment
Entire Place • 1 bedroom
Note: Performance varies based on location, size, amenities, seasonality, and management quality. Data reflects the past 12 months.
Top Performing Airbnb Hosts in Conegliano (2026)
Learn from the best! This table showcases top-performing Airbnb hosts in Conegliano based on the number of properties managed and estimated total revenue over the past year. Analyze their scale and performance metrics.
| Host Name | Properties | Grossing Revenue | Stay Reviews | Avg Rating |
|---|---|---|---|---|
| Flavio | 3 | $103,684 | 75 | 4.89/5.0 |
| Saverio | 1 | $39,915 | 136 | 4.95/5.0 |
| Agriturismo | 4 | $38,330 | 37 | 4.83/5.0 |
| Eva | 1 | $36,046 | 27 | 4.85/5.0 |
| Rossella | 2 | $35,014 | 48 | 4.92/5.0 |
| Ides | 2 | $34,524 | 93 | 4.73/5.0 |
| Gianluca | 5 | $29,158 | 121 | 4.94/5.0 |
| Sonia | 1 | $21,674 | 41 | 4.95/5.0 |
| Mariavittoria | 1 | $21,252 | 33 | 4.82/5.0 |
| Attico Di Piazza Cima | 2 | $20,798 | 13 | 4.93/5.0 |
Analyzing the strategies of top hosts, such as their property selection, pricing, and guest communication, can offer valuable lessons for optimizing your own Airbnb operations in Conegliano.
Dive Deeper: Advanced Conegliano STR Market Data (2026)
Ready to unlock more insights? AirROI provides access to advanced metrics and comprehensive Airbnb data for Conegliano. Explore detailed analytics beyond this report to refine your investment strategy, optimize pricing, and maximize your vacation rental profits.
Explore Advanced MetricsConegliano Short-Term Rental Market Composition (2026): Property & Room Types
Room Type Distribution
Property Type Distribution
Market Composition Insights for Conegliano
- The Conegliano Airbnb market composition is heavily skewed towards Entire Home/Apt listings, which make up 71.7% of the 53 active rentals. This indicates strong guest preference for privacy and space.
- Looking at the property type distribution in Conegliano, Apartment/Condo properties are the most common (60.4%), reflecting the local real estate landscape.
- Houses represent a significant 20.8% portion, catering likely to families or larger groups.
- The presence of 15.1% Hotel/Boutique listings indicates integration with traditional hospitality.
- Smaller segments like others, unique stays (combined 3.8%) offer potential for unique stay experiences.
Conegliano Airbnb Room Capacity Analysis (2026): Bedroom Distribution
Distribution of Listings by Number of Bedrooms
Room Capacity Insights for Conegliano
- The dominant room capacity in Conegliano is 2 bedrooms listings, making up 24.5% of the market. This suggests a strong demand for properties suitable for couples or solo travelers.
- Together, 2 bedrooms and 1 bedroom properties represent 49.0% of the active Airbnb listings in Conegliano, indicating a high concentration in these sizes.
- A significant 24.6% of listings offer 3+ bedrooms, catering to larger groups and families seeking more space in Conegliano.
Conegliano Vacation Rental Guest Capacity Trends (2026)
Distribution of Listings by Guest Capacity
Guest Capacity Insights for Conegliano
- The most common guest capacity trend in Conegliano vacation rentals is listings accommodating 4 guests (20.8%). This suggests the primary traveler segment is likely small families or groups.
- Properties designed for 4 guests and 3 guests dominate the Conegliano STR market, accounting for 35.9% of listings.
- 20.7% of properties accommodate 6+ guests, serving the market segment for larger families or group travel in Conegliano.
- On average, properties in Conegliano are equipped to host 3.2 guests.
Conegliano Airbnb Booking Patterns (2026): Available vs. Booked Days
Available Days Distribution
Booked Days Distribution
Booking Pattern Insights for Conegliano
- The most common availability pattern in Conegliano falls within the 271-366 days range, representing 58.5% of listings. This suggests many properties have significant open periods on their calendars.
- Approximately 88.7% of listings show high availability (181+ days open annually), indicating potential for increased bookings or specific owner usage patterns.
- For booked days, the 31-90 days range is most frequent in Conegliano (37.7%), reflecting common guest stay durations or potential owner blocking patterns.
- A notable 13.2% of properties secure long booking periods (181+ days booked per year), highlighting successful long-term rental strategies or significant owner usage.
Conegliano Airbnb Minimum Stay Requirements Analysis
Distribution of Listings by Minimum Night Requirement
1 Night
20 listings
37.7% of total
2 Nights
7 listings
13.2% of total
3 Nights
5 listings
9.4% of total
4-6 Nights
2 listings
3.8% of total
7-29 Nights
3 listings
5.7% of total
30+ Nights
16 listings
30.2% of total
Key Insights
- The most prevalent minimum stay requirement in Conegliano is 1 Night, adopted by 37.7% of listings. This highlights the market's preference for shorter, flexible bookings.
- A significant segment (30.2%) caters to monthly stays (30+ nights) in Conegliano, pointing to opportunities in the extended-stay market.
Recommendations
- Align with the market by considering a 1 Night minimum stay, as 37.7% of Conegliano hosts use this setting.
- Explore offering discounts for stays of 30+ nights to attract the 30.2% of the market seeking extended stays.
- Adjust minimum nights based on seasonality – potentially shorter during low season and longer during peak demand periods in Conegliano.
Conegliano Airbnb Cancellation Policy Trends Analysis (2026)
Super Strict 30 Days
1 listings
1.9% of total
Limited
1 listings
1.9% of total
Flexible
27 listings
50.9% of total
Moderate
20 listings
37.7% of total
Firm
3 listings
5.7% of total
Strict
1 listings
1.9% of total
Cancellation Policy Insights for Conegliano
- The prevailing Airbnb cancellation policy trend in Conegliano is Flexible, used by 50.9% of listings.
- The market strongly favors guest-friendly terms, with 88.6% of listings offering Flexible or Moderate policies. This suggests guests in Conegliano may expect booking flexibility.
- Strict cancellation policies are quite rare (1.9%), potentially making listings with this policy less competitive unless justified by high demand or property type.
Recommendations for Hosts
- Consider adopting a Flexible policy to align with the 50.9% market standard in Conegliano.
- Given the high prevalence of Flexible policies (50.9%), offering this can enhance booking appeal, especially during shoulder seasons.
- Using a Strict policy might deter some guests, as only 1.9% of listings use it. Evaluate if potential revenue protection outweighs possible lower booking rates.
- Regularly review your cancellation policy against competitors and market demand shifts in Conegliano.
Conegliano STR Booking Lead Time Analysis (2026)
Average Booking Lead Time by Month
Booking Lead Time Insights for Conegliano
- The overall average booking lead time for vacation rentals in Conegliano is 45 days.
- Guests book furthest in advance for stays during June (average 68 days), likely coinciding with peak travel demand or local events.
- The shortest booking windows occur for stays in March (average 14 days), indicating more last-minute travel plans during this time.
- Seasonally, Summer (57 days avg.) sees the longest lead times, while Winter (34 days avg.) has the shortest, reflecting typical travel planning cycles.
Recommendations for Hosts
- Use the overall average lead time (45 days) as a baseline for your pricing and availability strategy in Conegliano.
- For June stays, consider implementing length-of-stay discounts or slightly higher rates for bookings made less than 68 days out to capitalize on advance planning.
- During March, focus on last-minute booking availability and promotions, as guests book with very short notice (14 days avg.).
- Target marketing efforts for the Summer season well in advance (at least 57 days) to capture early planners.
- Monitor your own booking lead times against these Conegliano averages to identify opportunities for dynamic pricing adjustments.
Popular & Essential Airbnb Amenities in Conegliano (2026)
Amenity Prevalence
Amenity Insights for Conegliano
- Essential amenities in Conegliano that guests expect include: Wifi. Lacking these (this) could significantly impact bookings.
- Popular amenities like Heating, Hot water, Hair dryer are common but not universal. Offering these can provide a competitive edge.
Recommendations for Hosts
- Ensure your listing includes all essential amenities for Conegliano: Wifi.
- Prioritize adding missing essentials: Wifi.
- Consider adding popular differentiators like Heating or Hot water to increase appeal.
- Highlight unique or less common amenities you offer (e.g., hot tub, dedicated workspace, EV charger) in your listing description and photos.
- Regularly check competitor amenities in Conegliano to stay competitive.
Conegliano Airbnb Guest Demographics & Profile Analysis (2026)
Guest Profile Summary for Conegliano
- The typical guest profile for Airbnb in Conegliano consists of predominantly international visitors (78%), with top international origins including United States, typically belonging to the Post-2000s (Gen Z/Alpha) group (50%), primarily speaking English or Italian.
- Domestic travelers account for 22.2% of guests.
- Key international markets include Italy (22.2%) and United States (10.6%).
- Top languages spoken are English (37.8%) followed by Italian (13.5%).
- A significant demographic segment is the Post-2000s (Gen Z/Alpha) group, representing 50% of guests.
Recommendations for Hosts
- Focus marketing internationally, particularly towards travelers from United States.
- Tailor amenities and listing descriptions to appeal to the dominant Post-2000s (Gen Z/Alpha) demographic (e.g., highlight fast WiFi, smart home features, local guides).
- Highlight unique local experiences or amenities relevant to the primary guest profile.
- Consider seasonal promotions aligned with peak travel times for key origin markets.
Nearby Short-Term Rental Market Comparison
How does the Conegliano Airbnb market stack up against its neighbors? Compare key performance metrics like average monthly revenue, ADR, and occupancy rates in surrounding areas to understand the broader regional STR landscape.
| Market | Active Properties | Monthly Revenue | Daily Rate | Avg. Occupancy |
|---|---|---|---|---|
| Sankt Pankraz - San Pancrazio | 12 | $6,528 | $633.65 | 29% |
| Urtijëi - St. Ulrich in Gröden - Ortisei | 172 | $5,054 | $718.33 | 41% |
| Kiens - Chienes | 17 | $3,715 | $377.77 | 48% |
| Cortina d'Ampezzo | 309 | $3,646 | $474.12 | 40% |
| Moos in Passeier - Moso in Passiria | 20 | $3,504 | $547.30 | 23% |
| Colle Santa Lucia | 21 | $3,353 | $248.56 | 46% |
| Selina | 15 | $3,339 | $351.70 | 49% |
| Lajen - Laion | 96 | $3,338 | $548.27 | 36% |
| Merano | 28 | $3,288 | $309.99 | 46% |
| Santa Cristina Gherdëina - St. Christina in Gröden - Santa Cristina Valgardena | 102 | $3,264 | $408.62 | 41% |