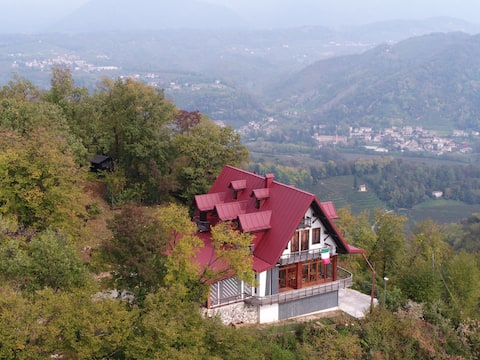
Farra di Soligo Airbnb Market Analysis 2026: Short Term Rental Data & Vacation Rental Statistics in Veneto, Italy
Is Airbnb profitable in Farra di Soligo in 2026? Explore comprehensive Airbnb analytics for Farra di Soligo, Veneto, Italy to uncover income potential. This 2026 STR market report for Farra di Soligo, based on AirROI data from February 2025 to January 2026, reveals key trends in the niche market of 19 active listings.
Whether you're considering an Airbnb investment in Farra di Soligo, optimizing your existing vacation rental, or exploring rental arbitrage opportunities, understanding the Farra di Soligo Airbnb data is crucial. Navigating the high regulation landscape is key to maximizing your short term rental income potential. Let's dive into the specifics.
Key Farra di Soligo Airbnb Performance Metrics Overview
Monthly Airbnb Revenue Variations & Income Potential in Farra di Soligo (2026)
Understanding the monthly revenue variations for Airbnb listings in Farra di Soligo is key to maximizing your short term rental income potential. Seasonality significantly impacts earnings. Our analysis, based on data from the past 12 months, shows that the peak revenue month for STRs in Farra di Soligo is typically August, while February often presents the lowest earnings, highlighting opportunities for strategic pricing adjustments during shoulder and low seasons. Explore the typical Airbnb income in Farra di Soligo across different performance tiers:
- Best-in-class properties (Top 10%) achieve $3,623+ monthly, often utilizing dynamic pricing and superior guest experiences.
- Strong performing properties (Top 25%) earn $1,819 or more, indicating effective management and desirable locations/amenities.
- Typical properties (Median) generate around $1,120 per month, representing the average market performance.
- Entry-level properties (Bottom 25%) see earnings around $544, often with potential for optimization.
Average Monthly Airbnb Earnings Trend in Farra di Soligo
Farra di Soligo Airbnb Occupancy Rate Trends (2026)
Maximize your bookings by understanding the Farra di Soligo STR occupancy trends. Seasonal demand shifts significantly influence how often properties are booked. Typically, Augustsees the highest demand (peak season occupancy), while February experiences the lowest (low season). Effective strategies, like adjusting minimum stays or offering promotions, can boost occupancy during slower periods. Here's how different property tiers perform in Farra di Soligo:
- Best-in-class properties (Top 10%) achieve 63%+ occupancy, indicating high desirability and potentially optimized availability.
- Strong performing properties (Top 25%) maintain 50% or higher occupancy, suggesting good market fit and guest satisfaction.
- Typical properties (Median) have an occupancy rate around 37%.
- Entry-level properties (Bottom 25%) average 21% occupancy, potentially facing higher vacancy.
Average Monthly Occupancy Rate Trend in Farra di Soligo
Average Daily Rate (ADR) Airbnb Trends in Farra di Soligo (2026)
Effective short term rental pricing strategy in Farra di Soligo involves understanding monthly ADR fluctuations. The Average Daily Rate (ADR) for Airbnb in Farra di Soligo typically peaks in February and dips lowest during May. Leveraging Airbnb dynamic pricing tools or strategies based on this seasonality can significantly boost revenue. Here's a look at the typical nightly rates achieved:
- Best-in-class properties (Top 10%) command rates of $271+ per night, often due to premium features or locations.
- Strong performing properties (Top 25%) achieve nightly rates of $139 or more.
- Typical properties (Median) charge around $93 per night.
- Entry-level properties (Bottom 25%) earn around $73 per night.
Average Daily Rate (ADR) Trend by Month in Farra di Soligo
Get Live Farra di Soligo Market Intelligence 👇

Explore Real-time Analytics
Airbnb Seasonality Analysis & Trends in Farra di Soligo (2026)
Peak Season (August, July, September)
- Revenue averages $2,470 per month
- Occupancy rates average 53.3%
- Daily rates average $122
Shoulder Season
- Revenue averages $1,455 per month
- Occupancy maintains around 36.7%
- Daily rates hold near $123
Low Season (February, March, November)
- Revenue drops to average $805 per month
- Occupancy decreases to average 21.2%
- Daily rates adjust to average $139
Seasonality Insights for Farra di Soligo
- The Airbnb seasonality in Farra di Soligo shows highly seasonal trends requiring careful strategy. While the sections above show seasonal averages, it's also insightful to look at the extremes:
- During the high season, the absolute peak month showcases Farra di Soligo's highest earning potential, with monthly revenues capable of climbing to $2,930, occupancy reaching a high of 67.1%, and ADRs peaking at $150.
- Conversely, the slowest single month of the year, typically falling within the low season, marks the market's lowest point. In this month, revenue might dip to $498, occupancy could drop to 15.4%, and ADRs may adjust down to $116.
- Understanding both the seasonal averages and these monthly peaks and troughs in revenue, occupancy, and ADR is crucial for maximizing your Airbnb profit potential in Farra di Soligo.
Seasonal Strategies for Maximizing Profit
- Peak Season: Maximize revenue through premium pricing and potentially longer minimum stays. Ensure high availability.
- Low Season: Offer competitive pricing, special promotions (e.g., extended stay discounts), and flexible cancellation policies. Target off-season travelers like remote workers or budget-conscious guests.
- Shoulder Seasons: Implement dynamic pricing that balances peak and low rates. Target weekend travelers or specific events. Offer slightly more flexible terms than peak season.
- Regularly analyze your own performance against these Farra di Soligo seasonality benchmarks and adjust your pricing and availability strategy accordingly.
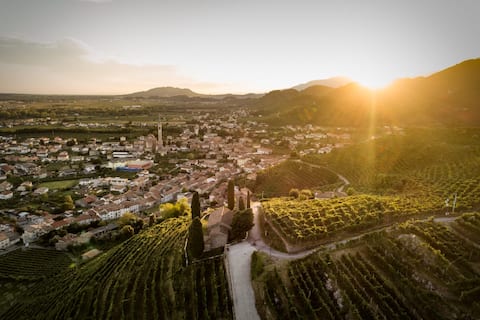
Best Areas for Airbnb Investment in Farra di Soligo (2026)
Exploring the top neighborhoods for short-term rentals in Farra di Soligo? This section highlights key areas, outlining why they are attractive for hosts and guests, along with notable local attractions. Consider these locations based on your target guest profile and investment strategy.
| Neighborhood / Area | Why Host Here? (Target Guests & Appeal) | Key Attractions & Landmarks |
|---|---|---|
| Centro Storico | The historic center of Farra di Soligo is charming and full of character. It's perfect for guests interested in local culture and history, making it a desirable spot for Airbnb hosts. | Church of San Bartolomeo, Piazza della Libertà, Local wine shops, Traditional Osterias, Nearby Prosecco hills |
| Prosecco Hills | Renowned for its beautiful vineyards and wine production, this area attracts wine enthusiasts and nature lovers. Hosting guests here offers a taste of the local lifestyle and stunning views. | Vineyard tours, Prosecco tastings, Nature walks, Scenic viewpoints |
| Farra di Soligo Train Station area | Convenient for travelers using public transport, this area is ideal for those visiting nearby cities like Treviso and Conegliano, making it attractive for business and leisure stays. | Easy access to public transport, Cafes and local shops, Local parks |
| Local Parks and Green Spaces | Farra di Soligo has several parks that can appeal to families and outdoor enthusiasts looking to relax and unwind in nature, making it an attractive option for various guest demographics. | Parks for picnics, Walking trails, Playgrounds |
| Nearby Conegliano | Just a short drive away, Conegliano is famous for its historic sites and as an important center for Prosecco wine. Hosting in this area can attract people visiting for wine tours and town exploration. | Conegliano Castle, Bottega del Vino, Historic downtown, Local museums |
| Sporting Facilities | Farra di Soligo offers options for sports enthusiasts, whether it's hiking, cycling or other recreational activities. This can bring in a niche market of active travelers. | Cycling paths, Hiking trails, Local sports events |
| Cultural Events Venues | Hosting near venues that frequently host events can attract guests who are attending concerts, fairs, and festivals, making it a strategic location for Airbnb. | Local fairs and festivals, Cultural events, Exhibitions |
| Nearby Treviso | Proximity to the beautiful city of Treviso enhances the appeal for tourists looking for a home base with easy access to urban attractions and conveniences. | Historic Treviso, Parks, Local cafes, Shops, Art galleries |
Understanding Airbnb License Requirements & STR Laws in Farra di Soligo (2026)
Yes, Farra di Soligo, Veneto, Italy enforces high STR regulations. Obtaining a license and ensuring compliance is almost certainly required according to current 2026 STR laws. Always verify the latest short term rental regulations and Airbnb license requirements directly with local government authorities for Farra di Soligo to ensure full compliance before hosting.
(Source: AirROI data, 2026, based on 89% licensed listings)
Top Performing Airbnb Properties in Farra di Soligo (2026)
Benchmark your potential! Explore examples of top-performing Airbnb properties in Farra di Soligobased on Trailing Twelve Month (TTM) revenue. Analyze their characteristics, revenue, occupancy rate, and ADR to understand what drives success in this market.

SWEET VILLA BETWEEN VENICE AND THE DOLOMITES "PROSECCO AREA"
Entire Place • 4 bedrooms
Villa Luigia - Prosecco hills Unesco
Entire Place • 3 bedrooms

Le Vigne Panoramiche
Entire Place • 1 bedroom

Rustic Costa d'oro - Prosecco Hills UNESCO
Entire Place • 2 bedrooms
Bollicine&Relax
Entire Place • 3 bedrooms

DELIGHTFUL APARTMENT IN THE PROSECCO AREA
Entire Place • 3 bedrooms
Note: Performance varies based on location, size, amenities, seasonality, and management quality. Data reflects the past 12 months.
Top Performing Airbnb Hosts in Farra di Soligo (2026)
Learn from the best! This table showcases top-performing Airbnb hosts in Farra di Soligo based on the number of properties managed and estimated total revenue over the past year. Analyze their scale and performance metrics.
| Host Name | Properties | Grossing Revenue | Stay Reviews | Avg Rating |
|---|---|---|---|---|
| Gianmaria | 1 | $65,324 | 68 | 4.94/5.0 |
| Icaro | 2 | $54,957 | 35 | 4.87/5.0 |
| Annalisa | 1 | $28,387 | 56 | 4.95/5.0 |
| Gelmina | 2 | $21,007 | 28 | 4.92/5.0 |
| Paolo | 2 | $20,120 | 236 | 4.91/5.0 |
| Marusca | 1 | $17,036 | 20 | 4.95/5.0 |
| Beatrice | 1 | $16,176 | 90 | 4.93/5.0 |
| Andrea | 1 | $12,938 | 45 | 4.91/5.0 |
| Katy | 1 | $12,922 | 26 | 4.96/5.0 |
| Meri | 2 | $11,105 | 22 | 5.00/5.0 |
Analyzing the strategies of top hosts, such as their property selection, pricing, and guest communication, can offer valuable lessons for optimizing your own Airbnb operations in Farra di Soligo.
Dive Deeper: Advanced Farra di Soligo STR Market Data (2026)
Ready to unlock more insights? AirROI provides access to advanced metrics and comprehensive Airbnb data for Farra di Soligo. Explore detailed analytics beyond this report to refine your investment strategy, optimize pricing, and maximize your vacation rental profits.
Explore Advanced MetricsFarra di Soligo Short-Term Rental Market Composition (2026): Property & Room Types
Room Type Distribution
Property Type Distribution
Market Composition Insights for Farra di Soligo
- The Farra di Soligo Airbnb market composition is heavily skewed towards Entire Home/Apt listings, which make up 84.2% of the 19 active rentals. This indicates strong guest preference for privacy and space.
- Looking at the property type distribution in Farra di Soligo, Apartment/Condo properties are the most common (57.9%), reflecting the local real estate landscape.
- Houses represent a significant 42.1% portion, catering likely to families or larger groups.
Farra di Soligo Airbnb Room Capacity Analysis (2026): Bedroom Distribution
Distribution of Listings by Number of Bedrooms
Room Capacity Insights for Farra di Soligo
- The dominant room capacity in Farra di Soligo is 3 bedrooms listings, making up 31.6% of the market. This suggests a strong demand for properties suitable for families or small groups.
- Together, 3 bedrooms and 2 bedrooms properties represent 57.9% of the active Airbnb listings in Farra di Soligo, indicating a high concentration in these sizes.
- A significant 36.9% of listings offer 3+ bedrooms, catering to larger groups and families seeking more space in Farra di Soligo.
Farra di Soligo Vacation Rental Guest Capacity Trends (2026)
Distribution of Listings by Guest Capacity
Guest Capacity Insights for Farra di Soligo
- The most common guest capacity trend in Farra di Soligo vacation rentals is listings accommodating 6 guests (31.6%). This suggests the primary traveler segment is likely larger groups.
- Properties designed for 6 guests and 2 guests dominate the Farra di Soligo STR market, accounting for 52.7% of listings.
- 47.4% of properties accommodate 6+ guests, serving the market segment for larger families or group travel in Farra di Soligo.
- On average, properties in Farra di Soligo are equipped to host 4.4 guests.
Farra di Soligo Airbnb Booking Patterns (2026): Available vs. Booked Days
Available Days Distribution
Booked Days Distribution
Booking Pattern Insights for Farra di Soligo
- The most common availability pattern in Farra di Soligo falls within the 181-270 days range, representing 73.7% of listings. This suggests many properties have significant open periods on their calendars.
- Approximately 100.0% of listings show high availability (181+ days open annually), indicating potential for increased bookings or specific owner usage patterns.
- For booked days, the 91-180 days range is most frequent in Farra di Soligo (73.7%), reflecting common guest stay durations or potential owner blocking patterns.
Farra di Soligo Airbnb Minimum Stay Requirements Analysis
Distribution of Listings by Minimum Night Requirement
1 Night
7 listings
36.8% of total
2 Nights
5 listings
26.3% of total
4-6 Nights
2 listings
10.5% of total
30+ Nights
5 listings
26.3% of total
Key Insights
- The most prevalent minimum stay requirement in Farra di Soligo is 1 Night, adopted by 36.8% of listings. This highlights the market's preference for shorter, flexible bookings.
- A strong majority (63.1%) of the Farra di Soligo Airbnb data shows acceptance of very short stays (1-2 nights), indicating a dynamic, high-turnover market.
- A significant segment (26.3%) caters to monthly stays (30+ nights) in Farra di Soligo, pointing to opportunities in the extended-stay market.
Recommendations
- Align with the market by considering a 1 Night minimum stay, as 36.8% of Farra di Soligo hosts use this setting.
- Explore offering discounts for stays of 30+ nights to attract the 26.3% of the market seeking extended stays.
- Adjust minimum nights based on seasonality – potentially shorter during low season and longer during peak demand periods in Farra di Soligo.
Farra di Soligo Airbnb Cancellation Policy Trends Analysis (2026)
Flexible
13 listings
68.4% of total
Moderate
5 listings
26.3% of total
Firm
1 listings
5.3% of total
Cancellation Policy Insights for Farra di Soligo
- The prevailing Airbnb cancellation policy trend in Farra di Soligo is Flexible, used by 68.4% of listings.
- The market strongly favors guest-friendly terms, with 94.7% of listings offering Flexible or Moderate policies. This suggests guests in Farra di Soligo may expect booking flexibility.
Recommendations for Hosts
- Consider adopting a Flexible policy to align with the 68.4% market standard in Farra di Soligo.
- Given the high prevalence of Flexible policies (68.4%), offering this can enhance booking appeal, especially during shoulder seasons.
- Regularly review your cancellation policy against competitors and market demand shifts in Farra di Soligo.
Farra di Soligo STR Booking Lead Time Analysis (2026)
Average Booking Lead Time by Month
Booking Lead Time Insights for Farra di Soligo
- The overall average booking lead time for vacation rentals in Farra di Soligo is 49 days.
- Guests book furthest in advance for stays during September (average 81 days), likely coinciding with peak travel demand or local events.
- The shortest booking windows occur for stays in February (average 14 days), indicating more last-minute travel plans during this time.
- Seasonally, Summer (69 days avg.) sees the longest lead times, while Winter (31 days avg.) has the shortest, reflecting typical travel planning cycles.
Recommendations for Hosts
- Use the overall average lead time (49 days) as a baseline for your pricing and availability strategy in Farra di Soligo.
- For September stays, consider implementing length-of-stay discounts or slightly higher rates for bookings made less than 81 days out to capitalize on advance planning.
- During February, focus on last-minute booking availability and promotions, as guests book with very short notice (14 days avg.).
- Target marketing efforts for the Summer season well in advance (at least 69 days) to capture early planners.
- Monitor your own booking lead times against these Farra di Soligo averages to identify opportunities for dynamic pricing adjustments.
Popular & Essential Airbnb Amenities in Farra di Soligo (2026)
Amenity Prevalence
Amenity Insights for Farra di Soligo
- Essential amenities in Farra di Soligo that guests expect include: Bed linens, Heating, Kitchen, Free parking on premises. Lacking these (any) could significantly impact bookings.
- Popular amenities like Dishes and silverware, Hot water, Cooking basics are common but not universal. Offering these can provide a competitive edge.
Recommendations for Hosts
- Ensure your listing includes all essential amenities for Farra di Soligo: Bed linens, Heating, Kitchen, Free parking on premises.
- Consider adding popular differentiators like Dishes and silverware or Hot water to increase appeal.
- Highlight unique or less common amenities you offer (e.g., hot tub, dedicated workspace, EV charger) in your listing description and photos.
- Regularly check competitor amenities in Farra di Soligo to stay competitive.
Farra di Soligo Airbnb Guest Demographics & Profile Analysis (2026)
Guest Profile Summary for Farra di Soligo
- The typical guest profile for Airbnb in Farra di Soligo consists of predominantly international visitors (89%), with top international origins including Germany, typically belonging to the Post-2000s (Gen Z/Alpha) group (50%), primarily speaking English or German.
- Domestic travelers account for 11.5% of guests.
- Key international markets include France (15.4%) and Germany (14.1%).
- Top languages spoken are English (40.9%) followed by German (10.2%).
- A significant demographic segment is the Post-2000s (Gen Z/Alpha) group, representing 50% of guests.
Recommendations for Hosts
- Focus marketing internationally, particularly towards travelers from Germany.
- Tailor amenities and listing descriptions to appeal to the dominant Post-2000s (Gen Z/Alpha) demographic (e.g., highlight fast WiFi, smart home features, local guides).
- Highlight unique local experiences or amenities relevant to the primary guest profile.
- Consider seasonal promotions aligned with peak travel times for key origin markets.
Nearby Short-Term Rental Market Comparison
How does the Farra di Soligo Airbnb market stack up against its neighbors? Compare key performance metrics like average monthly revenue, ADR, and occupancy rates in surrounding areas to understand the broader regional STR landscape.
| Market | Active Properties | Monthly Revenue | Daily Rate | Avg. Occupancy |
|---|---|---|---|---|
| Sankt Pankraz - San Pancrazio | 12 | $6,528 | $633.65 | 29% |
| Urtijëi - St. Ulrich in Gröden - Ortisei | 172 | $5,054 | $718.33 | 41% |
| Kiens - Chienes | 17 | $3,715 | $377.77 | 48% |
| Cortina d'Ampezzo | 309 | $3,646 | $474.12 | 40% |
| Moos in Passeier - Moso in Passiria | 20 | $3,504 | $547.30 | 23% |
| Colle Santa Lucia | 21 | $3,353 | $248.56 | 46% |
| Selina | 15 | $3,339 | $351.70 | 49% |
| Lajen - Laion | 96 | $3,338 | $548.27 | 36% |
| Merano | 28 | $3,288 | $309.99 | 46% |
| Santa Cristina Gherdëina - St. Christina in Gröden - Santa Cristina Valgardena | 102 | $3,264 | $408.62 | 41% |