Oriago Airbnb Market Analysis 2026: Short Term Rental Data & Vacation Rental Statistics in Veneto, Italy
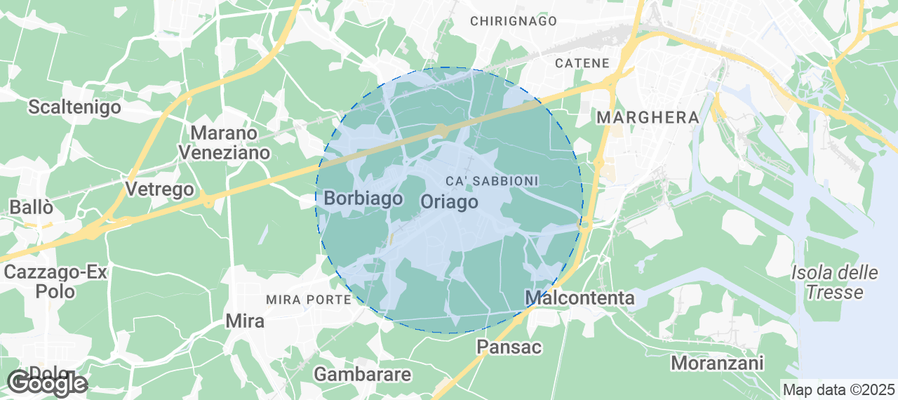
Is Airbnb profitable in Oriago in 2026? Explore comprehensive Airbnb analytics for Oriago, Veneto, Italy to uncover income potential. This 2026 STR market report for Oriago, based on AirROI data from February 2025 to January 2026, reveals key trends in the niche market of 21 active listings.
Whether you're considering an Airbnb investment in Oriago, optimizing your existing vacation rental, or exploring rental arbitrage opportunities, understanding the Oriago Airbnb data is crucial. Navigating the high regulation landscape is key to maximizing your short term rental income potential. Let's dive into the specifics.
Key Oriago Airbnb Performance Metrics Overview
Monthly Airbnb Revenue Variations & Income Potential in Oriago (2026)
Understanding the monthly revenue variations for Airbnb listings in Oriago is key to maximizing your short term rental income potential. Seasonality significantly impacts earnings. Our analysis, based on data from the past 12 months, shows that the peak revenue month for STRs in Oriago is typically July, while January often presents the lowest earnings, highlighting opportunities for strategic pricing adjustments during shoulder and low seasons. Explore the typical Airbnb income in Oriago across different performance tiers:
- Best-in-class properties (Top 10%) achieve $3,168+ monthly, often utilizing dynamic pricing and superior guest experiences.
- Strong performing properties (Top 25%) earn $2,213 or more, indicating effective management and desirable locations/amenities.
- Typical properties (Median) generate around $1,400 per month, representing the average market performance.
- Entry-level properties (Bottom 25%) see earnings around $752, often with potential for optimization.
Average Monthly Airbnb Earnings Trend in Oriago
Oriago Airbnb Occupancy Rate Trends (2026)
Maximize your bookings by understanding the Oriago STR occupancy trends. Seasonal demand shifts significantly influence how often properties are booked. Typically, Julysees the highest demand (peak season occupancy), while January experiences the lowest (low season). Effective strategies, like adjusting minimum stays or offering promotions, can boost occupancy during slower periods. Here's how different property tiers perform in Oriago:
- Best-in-class properties (Top 10%) achieve 75%+ occupancy, indicating high desirability and potentially optimized availability.
- Strong performing properties (Top 25%) maintain 62% or higher occupancy, suggesting good market fit and guest satisfaction.
- Typical properties (Median) have an occupancy rate around 45%.
- Entry-level properties (Bottom 25%) average 29% occupancy, potentially facing higher vacancy.
Average Monthly Occupancy Rate Trend in Oriago
Average Daily Rate (ADR) Airbnb Trends in Oriago (2026)
Effective short term rental pricing strategy in Oriago involves understanding monthly ADR fluctuations. The Average Daily Rate (ADR) for Airbnb in Oriago typically peaks in August and dips lowest during March. Leveraging Airbnb dynamic pricing tools or strategies based on this seasonality can significantly boost revenue. Here's a look at the typical nightly rates achieved:
- Best-in-class properties (Top 10%) command rates of $182+ per night, often due to premium features or locations.
- Strong performing properties (Top 25%) achieve nightly rates of $138 or more.
- Typical properties (Median) charge around $110 per night.
- Entry-level properties (Bottom 25%) earn around $86 per night.
Average Daily Rate (ADR) Trend by Month in Oriago
Get Live Oriago Market Intelligence 👇
Explore Real-time Analytics
Airbnb Seasonality Analysis & Trends in Oriago (2026)
Peak Season (July, August, June)
- Revenue averages $2,710 per month
- Occupancy rates average 62.3%
- Daily rates average $133
Shoulder Season
- Revenue averages $1,525 per month
- Occupancy maintains around 44.7%
- Daily rates hold near $116
Low Season (January, February, December)
- Revenue drops to average $767 per month
- Occupancy decreases to average 25.2%
- Daily rates adjust to average $112
Seasonality Insights for Oriago
- The Airbnb seasonality in Oriago shows highly seasonal trends requiring careful strategy. While the sections above show seasonal averages, it's also insightful to look at the extremes:
- During the high season, the absolute peak month showcases Oriago's highest earning potential, with monthly revenues capable of climbing to $3,046, occupancy reaching a high of 66.3%, and ADRs peaking at $134.
- Conversely, the slowest single month of the year, typically falling within the low season, marks the market's lowest point. In this month, revenue might dip to $495, occupancy could drop to 15.9%, and ADRs may adjust down to $104.
- Understanding both the seasonal averages and these monthly peaks and troughs in revenue, occupancy, and ADR is crucial for maximizing your Airbnb profit potential in Oriago.
Seasonal Strategies for Maximizing Profit
- Peak Season: Maximize revenue through premium pricing and potentially longer minimum stays. Ensure high availability.
- Low Season: Offer competitive pricing, special promotions (e.g., extended stay discounts), and flexible cancellation policies. Target off-season travelers like remote workers or budget-conscious guests.
- Shoulder Seasons: Implement dynamic pricing that balances peak and low rates. Target weekend travelers or specific events. Offer slightly more flexible terms than peak season.
- Regularly analyze your own performance against these Oriago seasonality benchmarks and adjust your pricing and availability strategy accordingly.
Best Areas for Airbnb Investment in Oriago (2026)
Exploring the top neighborhoods for short-term rentals in Oriago? This section highlights key areas, outlining why they are attractive for hosts and guests, along with notable local attractions. Consider these locations based on your target guest profile and investment strategy.
| Neighborhood / Area | Why Host Here? (Target Guests & Appeal) | Key Attractions & Landmarks |
|---|---|---|
| Centro Storico | The historic center of Oriago, featuring charming streets and traditional Italian architecture. Its proximity to Venice makes it attractive to tourists seeking an authentic experience close to the iconic city. | Villa delle Mischie, Parco del Burchiello, Church of Santa Maria delle Grazie, Canal del Brenta, Local food markets |
| Brenta River | Beautiful riverside area perfect for scenic walks and cycling. Popular for those looking to enjoy nature while still being close to urban amenities. | Brenta River pathways, Sporting activities, Nature parks, Dining along the river, Historical villas |
| Via Roma | Main thoroughfare in Oriago with shops, cafes, and easy access to public transportation. Ideal for guests looking for convenience and local culture. | Local shops, Cafes and restaurants, Public transport hub, Cultural events, Parks nearby |
| Malcontenta | A quiet suburb with a mix of historical sites and local life. Great for families and travelers seeking a peaceful retreat with access to Venice. | Villa Foscari, Nature reserves, Local eateries, Parks, Historic architecture |
| Chioggia | Nearby coastal town known for its beaches and seafood. Offers a different seaside experience compared to Venice, attracting sun-seekers and food lovers. | Sottomarina Beach, Chioggia Fish Market, Historical town center, Canals of Chioggia, Local seafood restaurants |
| Mestre | Larger town offering various amenities, shopping, and transportation options. Good for budget-conscious travelers looking for good access to Venice. | Shopping centers, Cinemas, Parks, Museums, Public transport to Venice |
| Salzano | Small town with a quaint atmosphere, ideal for travelers looking to experience the rural side of Veneto. Offers a quiet escape with local charm. | Countryside views, Local festivals, Historic churches, Cultural experiences, Gastronomic delights |
| Castelfranco Veneto | Charming medieval town renowned for its historical richness and beautiful architecture. Attracts visitors interested in history and culture. | Castelfranco castle, Historical buildings, Local artisans, Art galleries, Cultural events |
Understanding Airbnb License Requirements & STR Laws in Oriago (2026)
Yes, Oriago, Veneto, Italy enforces high STR regulations. Obtaining a license and ensuring compliance is almost certainly required according to current 2026 STR laws. Always verify the latest short term rental regulations and Airbnb license requirements directly with local government authorities for Oriago to ensure full compliance before hosting.
(Source: AirROI data, 2026, based on 100% licensed listings)
Top Performing Airbnb Properties in Oriago (2026)
Benchmark your potential! Explore examples of top-performing Airbnb properties in Oriagobased on Trailing Twelve Month (TTM) revenue. Analyze their characteristics, revenue, occupancy rate, and ADR to understand what drives success in this market.
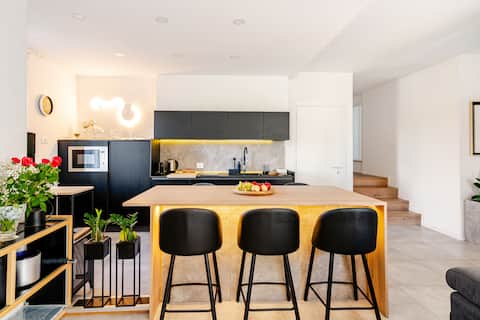
Risorgimento Villa
Entire Place • 3 bedrooms
Details of Brenta - Apt Chiara near Venice
Entire Place • 2 bedrooms
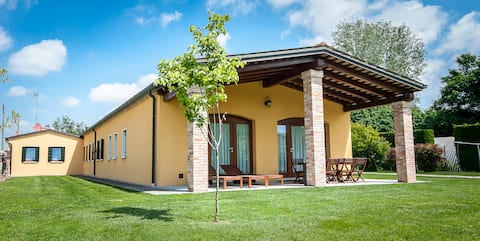
Private apartment in farmhouse with pool
Entire Place • 2 bedrooms
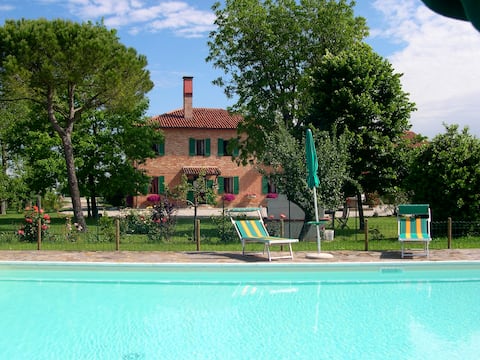
private apartment close to Venice with pool
Entire Place • 1 bedroom
Private apartment in farmhouse with pool
Entire Place • 2 bedrooms

Details of the Brenta - Casa Daniela near Venice
Entire Place • 2 bedrooms
Note: Performance varies based on location, size, amenities, seasonality, and management quality. Data reflects the past 12 months.
Top Performing Airbnb Hosts in Oriago (2026)
Learn from the best! This table showcases top-performing Airbnb hosts in Oriago based on the number of properties managed and estimated total revenue over the past year. Analyze their scale and performance metrics.
| Host Name | Properties | Grossing Revenue | Stay Reviews | Avg Rating |
|---|---|---|---|---|
| Fabienne | 5 | $121,079 | 220 | 4.93/5.0 |
| Daniela | 4 | $90,690 | 603 | 4.95/5.0 |
| Notti D’Oriente | 4 | $52,859 | 589 | 4.95/5.0 |
| Marco | 1 | $47,062 | 78 | 4.97/5.0 |
| GuestHost - Welcome To Veneto | 1 | $14,560 | 8 | 4.38/5.0 |
| Alberto | 2 | $8,947 | 43 | 4.71/5.0 |
| Ugo | 1 | $8,051 | 2 | Not Rated |
| Ornella | 2 | $7,556 | 14 | 4.29/5.0 |
| Isabella | 1 | $2,058 | 3 | 5.00/5.0 |
Analyzing the strategies of top hosts, such as their property selection, pricing, and guest communication, can offer valuable lessons for optimizing your own Airbnb operations in Oriago.
Dive Deeper: Advanced Oriago STR Market Data (2026)
Ready to unlock more insights? AirROI provides access to advanced metrics and comprehensive Airbnb data for Oriago. Explore detailed analytics beyond this report to refine your investment strategy, optimize pricing, and maximize your vacation rental profits.
Explore Advanced MetricsOriago Short-Term Rental Market Composition (2026): Property & Room Types
Room Type Distribution
Property Type Distribution
Market Composition Insights for Oriago
- The Oriago Airbnb market composition is heavily skewed towards Entire Home/Apt listings, which make up 71.4% of the 21 active rentals. This indicates strong guest preference for privacy and space.
- Looking at the property type distribution in Oriago, Apartment/Condo properties are the most common (57.1%), reflecting the local real estate landscape.
- Smaller segments like hotel/boutique (combined 4.8%) offer potential for unique stay experiences.
Oriago Airbnb Room Capacity Analysis (2026): Bedroom Distribution
Distribution of Listings by Number of Bedrooms
Room Capacity Insights for Oriago
- The dominant room capacity in Oriago is 1 bedroom listings, making up 47.6% of the market. This suggests a strong demand for properties suitable for couples or solo travelers.
- Together, 1 bedroom and 2 bedrooms properties represent 71.4% of the active Airbnb listings in Oriago, indicating a high concentration in these sizes.
Oriago Vacation Rental Guest Capacity Trends (2026)
Distribution of Listings by Guest Capacity
Guest Capacity Insights for Oriago
- The most common guest capacity trend in Oriago vacation rentals is listings accommodating 4 guests (23.8%). This suggests the primary traveler segment is likely small families or groups.
- Properties designed for 4 guests and 2 guests dominate the Oriago STR market, accounting for 47.6% of listings.
- 19.1% of properties accommodate 6+ guests, serving the market segment for larger families or group travel in Oriago.
- On average, properties in Oriago are equipped to host 3.5 guests.
Oriago Airbnb Booking Patterns (2026): Available vs. Booked Days
Available Days Distribution
Booked Days Distribution
Booking Pattern Insights for Oriago
- The most common availability pattern in Oriago falls within the 91-180 days range, representing 38.1% of listings. This suggests many properties have significant open periods on their calendars.
- Approximately 61.9% of listings show high availability (181+ days open annually), indicating potential for increased bookings or specific owner usage patterns.
- For booked days, the 181-270 days range is most frequent in Oriago (42.9%), reflecting common guest stay durations or potential owner blocking patterns.
- A notable 42.9% of properties secure long booking periods (181+ days booked per year), highlighting successful long-term rental strategies or significant owner usage.
Oriago Airbnb Minimum Stay Requirements Analysis
Distribution of Listings by Minimum Night Requirement
1 Night
1 listings
4.8% of total
2 Nights
7 listings
33.3% of total
4-6 Nights
2 listings
9.5% of total
30+ Nights
11 listings
52.4% of total
Key Insights
- The most prevalent minimum stay requirement in Oriago is 30+ Nights, adopted by 52.4% of listings. This highlights the market's preference for longer commitments.
- A significant segment (52.4%) caters to monthly stays (30+ nights) in Oriago, pointing to opportunities in the extended-stay market.
Recommendations
- Align with the market by considering a 30+ Nights minimum stay, as 52.4% of Oriago hosts use this setting.
- If feasible, allowing 1-night stays, especially midweek or during low season, could capture last-minute bookings, as only 4.8% currently do.
- A 2-night minimum appears standard (33.3%). Consider this for weekends or peak periods.
- Explore offering discounts for stays of 30+ nights to attract the 52.4% of the market seeking extended stays.
- Adjust minimum nights based on seasonality – potentially shorter during low season and longer during peak demand periods in Oriago.
Oriago Airbnb Cancellation Policy Trends Analysis (2026)
Super Strict 30 Days
5 listings
23.8% of total
Flexible
2 listings
9.5% of total
Moderate
14 listings
66.7% of total
Cancellation Policy Insights for Oriago
- The prevailing Airbnb cancellation policy trend in Oriago is Moderate, used by 66.7% of listings.
- The market strongly favors guest-friendly terms, with 76.2% of listings offering Flexible or Moderate policies. This suggests guests in Oriago may expect booking flexibility.
Recommendations for Hosts
- Consider adopting a Moderate policy to align with the 66.7% market standard in Oriago.
- Regularly review your cancellation policy against competitors and market demand shifts in Oriago.
Oriago STR Booking Lead Time Analysis (2026)
Average Booking Lead Time by Month
Booking Lead Time Insights for Oriago
- The overall average booking lead time for vacation rentals in Oriago is 57 days.
- Guests book furthest in advance for stays during July (average 88 days), likely coinciding with peak travel demand or local events.
- The shortest booking windows occur for stays in January (average 21 days), indicating more last-minute travel plans during this time.
- Seasonally, Summer (86 days avg.) sees the longest lead times, while Winter (33 days avg.) has the shortest, reflecting typical travel planning cycles.
Recommendations for Hosts
- Use the overall average lead time (57 days) as a baseline for your pricing and availability strategy in Oriago.
- For July stays, consider implementing length-of-stay discounts or slightly higher rates for bookings made less than 88 days out to capitalize on advance planning.
- Target marketing efforts for the Summer season well in advance (at least 86 days) to capture early planners.
- Monitor your own booking lead times against these Oriago averages to identify opportunities for dynamic pricing adjustments.
Popular & Essential Airbnb Amenities in Oriago (2026)
Amenity Prevalence
Amenity Insights for Oriago
- Essential amenities in Oriago that guests expect include: Heating, Hot water, Wifi, Hair dryer, Bed linens, Free parking on premises, Essentials. Lacking these (any) could significantly impact bookings.
- Popular amenities like TV, Bidet, Refrigerator are common but not universal. Offering these can provide a competitive edge.
Recommendations for Hosts
- Ensure your listing includes all essential amenities for Oriago: Heating, Hot water, Wifi, Hair dryer, Bed linens, Free parking on premises, Essentials.
- Prioritize adding missing essentials: Bed linens, Free parking on premises, Essentials.
- Consider adding popular differentiators like TV or Bidet to increase appeal.
- Highlight unique or less common amenities you offer (e.g., hot tub, dedicated workspace, EV charger) in your listing description and photos.
- Regularly check competitor amenities in Oriago to stay competitive.
Oriago Airbnb Guest Demographics & Profile Analysis (2026)
Guest Profile Summary for Oriago
- The typical guest profile for Airbnb in Oriago consists of predominantly international visitors (96%), with top international origins including United States, typically belonging to the Post-2000s (Gen Z/Alpha) group (50%), primarily speaking English or German.
- Domestic travelers account for 3.9% of guests.
- Key international markets include Germany (25.5%) and United States (14.7%).
- Top languages spoken are English (41.4%) followed by German (13.8%).
- A significant demographic segment is the Post-2000s (Gen Z/Alpha) group, representing 50% of guests.
Recommendations for Hosts
- Focus marketing internationally, particularly towards travelers from United States.
- Tailor amenities and listing descriptions to appeal to the dominant Post-2000s (Gen Z/Alpha) demographic (e.g., highlight fast WiFi, smart home features, local guides).
- Highlight unique local experiences or amenities relevant to the primary guest profile.
- Consider seasonal promotions aligned with peak travel times for key origin markets.
Nearby Short-Term Rental Market Comparison
How does the Oriago Airbnb market stack up against its neighbors? Compare key performance metrics like average monthly revenue, ADR, and occupancy rates in surrounding areas to understand the broader regional STR landscape.
| Market | Active Properties | Monthly Revenue | Daily Rate | Avg. Occupancy |
|---|---|---|---|---|
| Sankt Pankraz - San Pancrazio | 12 | $6,528 | $633.65 | 29% |
| Urtijëi - St. Ulrich in Gröden - Ortisei | 172 | $5,054 | $718.33 | 41% |
| Kiens - Chienes | 17 | $3,715 | $377.77 | 48% |
| Cortina d'Ampezzo | 309 | $3,646 | $474.12 | 40% |
| Moos in Passeier - Moso in Passiria | 20 | $3,504 | $547.30 | 23% |
| Colle Santa Lucia | 21 | $3,353 | $248.56 | 46% |
| Selina | 15 | $3,339 | $351.70 | 49% |
| Lajen - Laion | 96 | $3,338 | $548.27 | 36% |
| Merano | 28 | $3,288 | $309.99 | 46% |
| Santa Cristina Gherdëina - St. Christina in Gröden - Santa Cristina Valgardena | 102 | $3,264 | $408.62 | 41% |