Rubano Airbnb Market Analysis 2026: Short Term Rental Data & Vacation Rental Statistics in Veneto, Italy
Is Airbnb profitable in Rubano in 2026? Explore comprehensive Airbnb analytics for Rubano, Veneto, Italy to uncover income potential. This 2026 STR market report for Rubano, based on AirROI data from November 2024 to October 2025, reveals key trends in the niche market of 18 active listings.
Whether you're considering an Airbnb investment in Rubano, optimizing your existing vacation rental, or exploring rental arbitrage opportunities, understanding the Rubano Airbnb data is crucial. Navigating the high regulation landscape is key to maximizing your short term rental income potential. Let's dive into the specifics.
Key Rubano Airbnb Performance Metrics Overview
Monthly Airbnb Revenue Variations & Income Potential in Rubano (2026)
Understanding the monthly revenue variations for Airbnb listings in Rubano is key to maximizing your short term rental income potential. Seasonality significantly impacts earnings. Our analysis, based on data from the past 12 months, shows that the peak revenue month for STRs in Rubano is typically August, while July often presents the lowest earnings, highlighting opportunities for strategic pricing adjustments during shoulder and low seasons. Explore the typical Airbnb income in Rubano across different performance tiers:
- Best-in-class properties (Top 10%) achieve $2,534+ monthly, often utilizing dynamic pricing and superior guest experiences.
- Strong performing properties (Top 25%) earn $1,178 or more, indicating effective management and desirable locations/amenities.
- Typical properties (Median) generate around $664 per month, representing the average market performance.
- Entry-level properties (Bottom 25%) see earnings around $332, often with potential for optimization.
Average Monthly Airbnb Earnings Trend in Rubano
Rubano Airbnb Occupancy Rate Trends (2026)
Maximize your bookings by understanding the Rubano STR occupancy trends. Seasonal demand shifts significantly influence how often properties are booked. Typically, Octobersees the highest demand (peak season occupancy), while July experiences the lowest (low season). Effective strategies, like adjusting minimum stays or offering promotions, can boost occupancy during slower periods. Here's how different property tiers perform in Rubano:
- Best-in-class properties (Top 10%) achieve 71%+ occupancy, indicating high desirability and potentially optimized availability.
- Strong performing properties (Top 25%) maintain 48% or higher occupancy, suggesting good market fit and guest satisfaction.
- Typical properties (Median) have an occupancy rate around 28%.
- Entry-level properties (Bottom 25%) average 14% occupancy, potentially facing higher vacancy.
Average Monthly Occupancy Rate Trend in Rubano
Average Daily Rate (ADR) Airbnb Trends in Rubano (2026)
Effective short term rental pricing strategy in Rubano involves understanding monthly ADR fluctuations. The Average Daily Rate (ADR) for Airbnb in Rubano typically peaks in August and dips lowest during March. Leveraging Airbnb dynamic pricing tools or strategies based on this seasonality can significantly boost revenue. Here's a look at the typical nightly rates achieved:
- Best-in-class properties (Top 10%) command rates of $159+ per night, often due to premium features or locations.
- Strong performing properties (Top 25%) achieve nightly rates of $94 or more.
- Typical properties (Median) charge around $78 per night.
- Entry-level properties (Bottom 25%) earn around $52 per night.
Average Daily Rate (ADR) Trend by Month in Rubano
Get Live Rubano Market Intelligence 👇
Explore Real-time Analytics
Airbnb Seasonality Analysis & Trends in Rubano (2025)
Peak Season (August, September, October)
- Revenue averages $1,309 per month
- Occupancy rates average 43.6%
- Daily rates average $93
Shoulder Season
- Revenue averages $1,004 per month
- Occupancy maintains around 36.8%
- Daily rates hold near $84
Low Season (April, June, July)
- Revenue drops to average $749 per month
- Occupancy decreases to average 29.4%
- Daily rates adjust to average $89
Seasonality Insights for Rubano
- The Airbnb seasonality in Rubano shows highly seasonal trends requiring careful strategy. While the sections above show seasonal averages, it's also insightful to look at the extremes:
- During the high season, the absolute peak month showcases Rubano's highest earning potential, with monthly revenues capable of climbing to $1,460, occupancy reaching a high of 50.8%, and ADRs peaking at $94.
- Conversely, the slowest single month of the year, typically falling within the low season, marks the market's lowest point. In this month, revenue might dip to $669, occupancy could drop to 25.3%, and ADRs may adjust down to $82.
- Understanding both the seasonal averages and these monthly peaks and troughs in revenue, occupancy, and ADR is crucial for maximizing your Airbnb profit potential in Rubano.
Seasonal Strategies for Maximizing Profit
- Peak Season: Maximize revenue through premium pricing and potentially longer minimum stays. Ensure high availability.
- Low Season: Offer competitive pricing, special promotions (e.g., extended stay discounts), and flexible cancellation policies. Target off-season travelers like remote workers or budget-conscious guests.
- Shoulder Seasons: Implement dynamic pricing that balances peak and low rates. Target weekend travelers or specific events. Offer slightly more flexible terms than peak season.
- Regularly analyze your own performance against these Rubano seasonality benchmarks and adjust your pricing and availability strategy accordingly.
Best Areas for Airbnb Investment in Rubano (2026)
Exploring the top neighborhoods for short-term rentals in Rubano? This section highlights key areas, outlining why they are attractive for hosts and guests, along with notable local attractions. Consider these locations based on your target guest profile and investment strategy.
| Neighborhood / Area | Why Host Here? (Target Guests & Appeal) | Key Attractions & Landmarks |
|---|---|---|
| Rubano Centro | The heart of Rubano features easy access to local shops, cafes, and restaurants, making it ideal for travelers who want to experience the daily life of the town. | Parco della Musica, Villa Dondi, Local eateries and cafes, Rubano Market |
| Parco delle Langhe | A beautiful park area with walking trails and nature, attracting visitors who enjoy outdoor activities and tranquility. | Natural trails, Scenic viewpoints, Picnic areas |
| Nearby Padova | Just a short distance from Rubano, Padova is rich in historical architecture and cultural sites, making it attractive for tourists. | Scrovegni Chapel, Prato della Valle, Basilica di Sant'Antonio, Padua University |
| Costa di Rubano | A residential area known for its peaceful environment, great for families looking for a relaxing stay while being close to urban amenities. | Family parks, Community spaces, Local festivals |
| Cento Zoo | A small but interactive zoo that attracts families and children, making it a unique niche for Airbnb hosting. | Cento Zoo exhibits, Children's activities, Educational programs |
| Villa Giustiniani | Historical villa that hosts events and shows, providing a cultural experience for guests interested in local history. | Villa tours, Cultural events, Gardens and historical exhibits |
| Ospedale di Rubano | Proximity to the hospital makes it suitable for medical tourism, accommodating families and patients seeking care. | Medical facilities, Patient support accommodations |
| Shopping Districts | Areas devoted to shopping and entertainment attract visitors looking for both convenience and leisure activities. | Centro Commerciale Le Brentelle, Boutiques, Cafes and restaurants nearby |
Understanding Airbnb License Requirements & STR Laws in Rubano (2026)
Yes, Rubano, Veneto, Italy enforces high STR regulations. Obtaining a license and ensuring compliance is almost certainly required according to current 2026 STR laws. Always verify the latest short term rental regulations and Airbnb license requirements directly with local government authorities for Rubano to ensure full compliance before hosting.
(Source: AirROI data, 2026, based on 56% licensed listings)
Top Performing Airbnb Properties in Rubano (2026)
Benchmark your potential! Explore examples of top-performing Airbnb properties in Rubanobased on Trailing Twelve Month (TTM) revenue. Analyze their characteristics, revenue, occupancy rate, and ADR to understand what drives success in this market.
![[Padova - 35 min Venezia] Suite Picasso Deluxe](https://a0.muscache.com/im/pictures/hosting/Hosting-710761694060849948/original/ebff67e5-957f-41c7-a18f-c168fa2d3292.jpeg?im_w=480&im_format=avif)
[Padova - 35 min Venezia] Suite Picasso Deluxe
Entire Place • 2 bedrooms
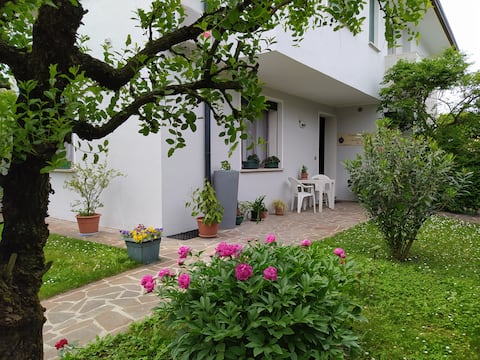
5 rooms & breakfast "Forest House" Rubano (PD)
Entire Place • 5 bedrooms
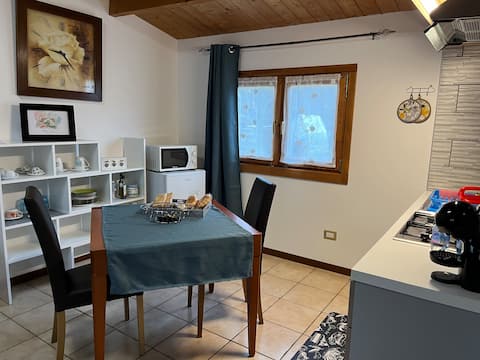
Casa Miky
Entire Place • 1 bedroom
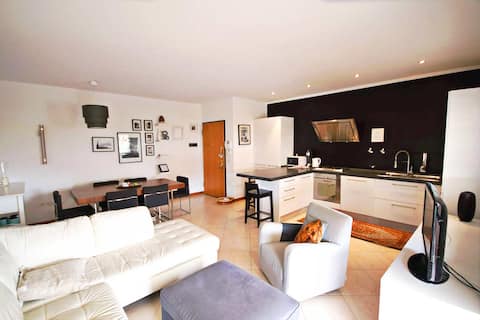
Deluxe Padova Apartment
Entire Place • 2 bedrooms
Good feeling
Entire Place • 2 bedrooms

The student's lodging in Padua , Room 1
Private Room • N/A
Note: Performance varies based on location, size, amenities, seasonality, and management quality. Data reflects the past 12 months.
Top Performing Airbnb Hosts in Rubano (2026)
Learn from the best! This table showcases top-performing Airbnb hosts in Rubano based on the number of properties managed and estimated total revenue over the past year. Analyze their scale and performance metrics.
| Host Name | Properties | Grossing Revenue | Stay Reviews | Avg Rating |
|---|---|---|---|---|
| Michele | 1 | $29,836 | 44 | 4.98/5.0 |
| Filippo | 2 | $17,501 | 91 | 4.83/5.0 |
| Katia | 2 | $14,611 | 55 | 4.88/5.0 |
| Tecla | 2 | $12,042 | 143 | 4.71/5.0 |
| Beatrice | 1 | $9,948 | 12 | 4.75/5.0 |
| Metello | 1 | $7,679 | 63 | 4.94/5.0 |
| Marco | 1 | $6,146 | 25 | 5.00/5.0 |
| Elia | 3 | $4,364 | 142 | 4.63/5.0 |
| Monica | 2 | $2,589 | 38 | 4.71/5.0 |
| Svetlana | 1 | $1,620 | 42 | 4.88/5.0 |
Analyzing the strategies of top hosts, such as their property selection, pricing, and guest communication, can offer valuable lessons for optimizing your own Airbnb operations in Rubano.
Dive Deeper: Advanced Rubano STR Market Data (2026)
Ready to unlock more insights? AirROI provides access to advanced metrics and comprehensive Airbnb data for Rubano. Explore detailed analytics beyond this report to refine your investment strategy, optimize pricing, and maximize your vacation rental profits.
Explore Advanced MetricsRubano Short-Term Rental Market Composition (2026): Property & Room Types
Room Type Distribution
Property Type Distribution
Market Composition Insights for Rubano
- The Rubano Airbnb market composition is heavily skewed towards Private Room listings, which make up 61.1% of the 18 active rentals. This indicates strong guest preference for privacy and space.
- Looking at the property type distribution in Rubano, House properties are the most common (44.4%), reflecting the local real estate landscape.
- Houses represent a significant 44.4% portion, catering likely to families or larger groups.
- The presence of 22.2% Hotel/Boutique listings indicates integration with traditional hospitality.
Rubano Airbnb Room Capacity Analysis (2026): Bedroom Distribution
Distribution of Listings by Number of Bedrooms
Room Capacity Insights for Rubano
- The dominant room capacity in Rubano is 2 bedrooms listings, making up 33.3% of the market. This suggests a strong demand for properties suitable for couples or solo travelers.
- Together, 2 bedrooms and 1 bedroom properties represent 50.0% of the active Airbnb listings in Rubano, indicating a high concentration in these sizes.
Rubano Vacation Rental Guest Capacity Trends (2026)
Distribution of Listings by Guest Capacity
Guest Capacity Insights for Rubano
- The most common guest capacity trend in Rubano vacation rentals is listings accommodating 4 guests (22.2%). This suggests the primary traveler segment is likely small families or groups.
- Properties designed for 4 guests and 6 guests dominate the Rubano STR market, accounting for 33.3% of listings.
- 16.7% of properties accommodate 6+ guests, serving the market segment for larger families or group travel in Rubano.
- On average, properties in Rubano are equipped to host 2.2 guests.
Rubano Airbnb Booking Patterns (2026): Available vs. Booked Days
Available Days Distribution
Booked Days Distribution
Booking Pattern Insights for Rubano
- The most common availability pattern in Rubano falls within the 271-366 days range, representing 72.2% of listings. This suggests many properties have significant open periods on their calendars.
- Approximately 100.0% of listings show high availability (181+ days open annually), indicating potential for increased bookings or specific owner usage patterns.
- For booked days, the 1-30 days range is most frequent in Rubano (38.9%), reflecting common guest stay durations or potential owner blocking patterns.
Rubano Airbnb Minimum Stay Requirements Analysis
Distribution of Listings by Minimum Night Requirement
1 Night
8 listings
44.4% of total
2 Nights
6 listings
33.3% of total
3 Nights
2 listings
11.1% of total
30+ Nights
2 listings
11.1% of total
Key Insights
- The most prevalent minimum stay requirement in Rubano is 1 Night, adopted by 44.4% of listings. This highlights the market's preference for shorter, flexible bookings.
- A strong majority (77.7%) of the Rubano Airbnb data shows acceptance of very short stays (1-2 nights), indicating a dynamic, high-turnover market.
- A significant segment (11.1%) caters to monthly stays (30+ nights) in Rubano, pointing to opportunities in the extended-stay market.
Recommendations
- Align with the market by considering a 1 Night minimum stay, as 44.4% of Rubano hosts use this setting.
- Explore offering discounts for stays of 30+ nights to attract the 11.1% of the market seeking extended stays.
- Adjust minimum nights based on seasonality – potentially shorter during low season and longer during peak demand periods in Rubano.
Rubano Airbnb Cancellation Policy Trends Analysis (2026)
Flexible
5 listings
27.8% of total
Moderate
12 listings
66.7% of total
Firm
1 listings
5.6% of total
Cancellation Policy Insights for Rubano
- The prevailing Airbnb cancellation policy trend in Rubano is Moderate, used by 66.7% of listings.
- The market strongly favors guest-friendly terms, with 94.5% of listings offering Flexible or Moderate policies. This suggests guests in Rubano may expect booking flexibility.
Recommendations for Hosts
- Consider adopting a Moderate policy to align with the 66.7% market standard in Rubano.
- Regularly review your cancellation policy against competitors and market demand shifts in Rubano.
Rubano STR Booking Lead Time Analysis (2026)
Average Booking Lead Time by Month
Booking Lead Time Insights for Rubano
- The overall average booking lead time for vacation rentals in Rubano is 42 days.
- Guests book furthest in advance for stays during August (average 80 days), likely coinciding with peak travel demand or local events.
- The shortest booking windows occur for stays in October (average 7 days), indicating more last-minute travel plans during this time.
- Seasonally, Summer (74 days avg.) sees the longest lead times, while Winter (20 days avg.) has the shortest, reflecting typical travel planning cycles.
Recommendations for Hosts
- Use the overall average lead time (42 days) as a baseline for your pricing and availability strategy in Rubano.
- For August stays, consider implementing length-of-stay discounts or slightly higher rates for bookings made less than 80 days out to capitalize on advance planning.
- During October, focus on last-minute booking availability and promotions, as guests book with very short notice (7 days avg.).
- Target marketing efforts for the Summer season well in advance (at least 74 days) to capture early planners.
- Monitor your own booking lead times against these Rubano averages to identify opportunities for dynamic pricing adjustments.
Popular & Essential Airbnb Amenities in Rubano (2026)
Amenity Prevalence
Amenity Insights for Rubano
- Essential amenities in Rubano that guests expect include: Wifi, Heating. Lacking these (any) could significantly impact bookings.
- Popular amenities like Hot water, Hangers, Hair dryer are common but not universal. Offering these can provide a competitive edge.
Recommendations for Hosts
- Ensure your listing includes all essential amenities for Rubano: Wifi, Heating.
- Consider adding popular differentiators like Hot water or Hangers to increase appeal.
- Highlight unique or less common amenities you offer (e.g., hot tub, dedicated workspace, EV charger) in your listing description and photos.
- Regularly check competitor amenities in Rubano to stay competitive.
Rubano Airbnb Guest Demographics & Profile Analysis (2026)
Guest Profile Summary for Rubano
- The typical guest profile for Airbnb in Rubano consists of a mix of domestic (52%) and international guests, often arriving from nearby Gorla Minore, typically belonging to the Post-2000s (Gen Z/Alpha) group (50%), primarily speaking English or Italian.
- Domestic travelers account for 51.9% of guests.
- Key international markets include Italy (51.9%) and France (11.5%).
- Top languages spoken are English (38.3%) followed by Italian (27.2%).
- A significant demographic segment is the Post-2000s (Gen Z/Alpha) group, representing 50% of guests.
Recommendations for Hosts
- Balance marketing efforts between domestic and international channels based on the guest mix.
- Tailor amenities and listing descriptions to appeal to the dominant Post-2000s (Gen Z/Alpha) demographic (e.g., highlight fast WiFi, smart home features, local guides).
- Highlight unique local experiences or amenities relevant to the primary guest profile.
- Consider seasonal promotions aligned with peak travel times for key origin markets.
Nearby Short-Term Rental Market Comparison
How does the Rubano Airbnb market stack up against its neighbors? Compare key performance metrics like average monthly revenue, ADR, and occupancy rates in surrounding areas to understand the broader regional STR landscape.
| Market | Active Properties | Monthly Revenue | Daily Rate | Avg. Occupancy |
|---|---|---|---|---|
| Sankt Pankraz - San Pancrazio | 14 | $5,664 | $696.09 | 24% |
| Urtijëi - St. Ulrich in Gröden - Ortisei | 173 | $4,980 | $718.12 | 40% |
| Moos in Passeier - Moso in Passiria | 19 | $4,142 | $575.75 | 25% |
| Cortina d'Ampezzo | 286 | $3,909 | $430.26 | 41% |
| Kiens - Chienes | 17 | $3,898 | $380.85 | 49% |
| Colle Santa Lucia | 20 | $3,502 | $237.34 | 47% |
| Brenzone sul Garda | 23 | $3,399 | $334.23 | 43% |
| Lajen - Laion | 94 | $3,319 | $573.69 | 35% |
| Großkirchheim | 12 | $3,173 | $282.64 | 41% |
| Venice | 6,522 | $3,122 | $256.10 | 46% |