Treviso Airbnb Market Analysis 2026: Short Term Rental Data & Vacation Rental Statistics in Veneto, Italy
Is Airbnb profitable in Treviso in 2026? Explore comprehensive Airbnb analytics for Treviso, Veneto, Italy to uncover income potential. This 2026 STR market report for Treviso, based on AirROI data from February 2025 to January 2026, reveals key trends in the market of 370 active listings.
Whether you're considering an Airbnb investment in Treviso, optimizing your existing vacation rental, or exploring rental arbitrage opportunities, understanding the Treviso Airbnb data is crucial. Navigating the high regulation landscape is key to maximizing your short term rental income potential. Let's dive into the specifics.
Key Treviso Airbnb Performance Metrics Overview
Monthly Airbnb Revenue Variations & Income Potential in Treviso (2026)
Understanding the monthly revenue variations for Airbnb listings in Treviso is key to maximizing your short term rental income potential. Seasonality significantly impacts earnings. Our analysis, based on data from the past 12 months, shows that the peak revenue month for STRs in Treviso is typically August, while January often presents the lowest earnings, highlighting opportunities for strategic pricing adjustments during shoulder and low seasons. Explore the typical Airbnb income in Treviso across different performance tiers:
- Best-in-class properties (Top 10%) achieve $2,968+ monthly, often utilizing dynamic pricing and superior guest experiences.
- Strong performing properties (Top 25%) earn $2,177 or more, indicating effective management and desirable locations/amenities.
- Typical properties (Median) generate around $1,421 per month, representing the average market performance.
- Entry-level properties (Bottom 25%) see earnings around $760, often with potential for optimization.
Average Monthly Airbnb Earnings Trend in Treviso
Treviso Airbnb Occupancy Rate Trends (2026)
Maximize your bookings by understanding the Treviso STR occupancy trends. Seasonal demand shifts significantly influence how often properties are booked. Typically, Maysees the highest demand (peak season occupancy), while January experiences the lowest (low season). Effective strategies, like adjusting minimum stays or offering promotions, can boost occupancy during slower periods. Here's how different property tiers perform in Treviso:
- Best-in-class properties (Top 10%) achieve 76%+ occupancy, indicating high desirability and potentially optimized availability.
- Strong performing properties (Top 25%) maintain 61% or higher occupancy, suggesting good market fit and guest satisfaction.
- Typical properties (Median) have an occupancy rate around 40%.
- Entry-level properties (Bottom 25%) average 20% occupancy, potentially facing higher vacancy.
Average Monthly Occupancy Rate Trend in Treviso
Average Daily Rate (ADR) Airbnb Trends in Treviso (2026)
Effective short term rental pricing strategy in Treviso involves understanding monthly ADR fluctuations. The Average Daily Rate (ADR) for Airbnb in Treviso typically peaks in June and dips lowest during March. Leveraging Airbnb dynamic pricing tools or strategies based on this seasonality can significantly boost revenue. Here's a look at the typical nightly rates achieved:
- Best-in-class properties (Top 10%) command rates of $196+ per night, often due to premium features or locations.
- Strong performing properties (Top 25%) achieve nightly rates of $150 or more.
- Typical properties (Median) charge around $116 per night.
- Entry-level properties (Bottom 25%) earn around $91 per night.
Average Daily Rate (ADR) Trend by Month in Treviso
Get Live Treviso Market Intelligence 👇

Explore Real-time Analytics
Airbnb Seasonality Analysis & Trends in Treviso (2026)
Peak Season (August, September, July)
- Revenue averages $2,070 per month
- Occupancy rates average 47.5%
- Daily rates average $136
Shoulder Season
- Revenue averages $1,743 per month
- Occupancy maintains around 43.8%
- Daily rates hold near $133
Low Season (January, February, November)
- Revenue drops to average $1,128 per month
- Occupancy decreases to average 30.8%
- Daily rates adjust to average $132
Seasonality Insights for Treviso
- The Airbnb seasonality in Treviso shows moderate seasonality with distinct peak and low periods. While the sections above show seasonal averages, it's also insightful to look at the extremes:
- During the high season, the absolute peak month showcases Treviso's highest earning potential, with monthly revenues capable of climbing to $2,135, occupancy reaching a high of 50.0%, and ADRs peaking at $138.
- Conversely, the slowest single month of the year, typically falling within the low season, marks the market's lowest point. In this month, revenue might dip to $973, occupancy could drop to 24.0%, and ADRs may adjust down to $126.
- Understanding both the seasonal averages and these monthly peaks and troughs in revenue, occupancy, and ADR is crucial for maximizing your Airbnb profit potential in Treviso.
Seasonal Strategies for Maximizing Profit
- Peak Season: Maximize revenue through premium pricing and potentially longer minimum stays. Ensure high availability.
- Low Season: Offer competitive pricing, special promotions (e.g., extended stay discounts), and flexible cancellation policies. Target off-season travelers like remote workers or budget-conscious guests.
- Shoulder Seasons: Implement dynamic pricing that balances peak and low rates. Target weekend travelers or specific events. Offer slightly more flexible terms than peak season.
- Regularly analyze your own performance against these Treviso seasonality benchmarks and adjust your pricing and availability strategy accordingly.
Best Areas for Airbnb Investment in Treviso (2026)
Exploring the top neighborhoods for short-term rentals in Treviso? This section highlights key areas, outlining why they are attractive for hosts and guests, along with notable local attractions. Consider these locations based on your target guest profile and investment strategy.
| Neighborhood / Area | Why Host Here? (Target Guests & Appeal) | Key Attractions & Landmarks |
|---|---|---|
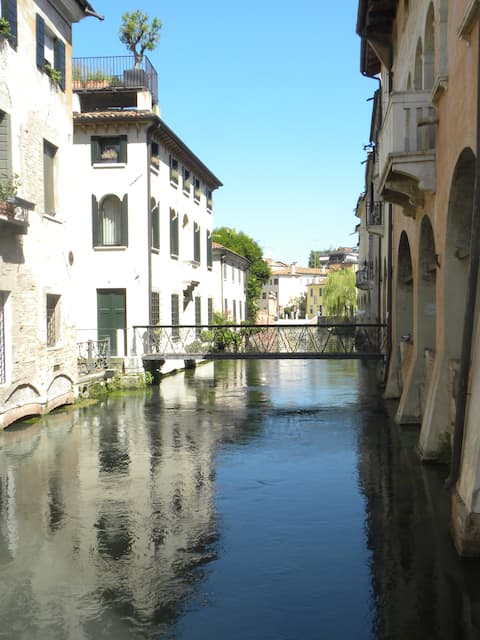
| Treviso Historic Center | Charming medieval area with picturesque canals, historic buildings, and vibrant squares. Ideal for travelers seeking culture and history during their stay in Treviso. | Piazza dei Signori, Treviso Cathedral, Museo di Santa Caterina, Ponte di Santa Croce, Cappella di Santa Lucia |
| Silea | A peaceful suburb of Treviso, known for its natural beauty and proximity to the Sile River. Attracts families and those looking for a quieter atmosphere. | Parco naturale del Sile, Isola della Carta, Sile River Park, Chiesa di San Niccolò |
| Casier | Beautiful small town near Treviso, with access to the Sile River and great for outdoor activities. Attractive for travelers interested in nature and tranquility. | Villa Revedin, Chiesetta di San Martino, Parks along the Sile River |
| Crocetta del Montello | Famous for its wine production, this area attracts wine enthusiasts and those looking to experience local Veneto culture. | Montello Hill, Wine cellars, Scenic views over the vineyards |
| Villorba | A growing town close to Treviso, ideal for those seeking a residential feel with easy access to urban amenities. | Parco della Fattoria, Local markets, Nearby cycling paths |
| Treviso Nord | Commercial area with convenient access to Treviso's city facilities, suitable for business travelers and families. | Shopping centers, Local restaurants, Events venues |
| Mogliano Veneto | A charming town with a historic center, appealing to those who want to enjoy Treviso's proximity while being in a quieter environment. | Villa Condulmer, Chiesa di Santa Maria Assunta, Shopping and dining options |
| Roncade | Known for its beautiful countryside and proximity to Venice, it attracts tourists wishing to explore the Veneto region. | Castello di Roncade, Natural parks, Local vineyards |
Understanding Airbnb License Requirements & STR Laws in Treviso (2026)
Yes, Treviso, Veneto, Italy enforces high STR regulations. Obtaining a license and ensuring compliance is almost certainly required according to current 2026 STR laws. Always verify the latest short term rental regulations and Airbnb license requirements directly with local government authorities for Treviso to ensure full compliance before hosting.
(Source: AirROI data, 2026, based on 94% licensed listings)
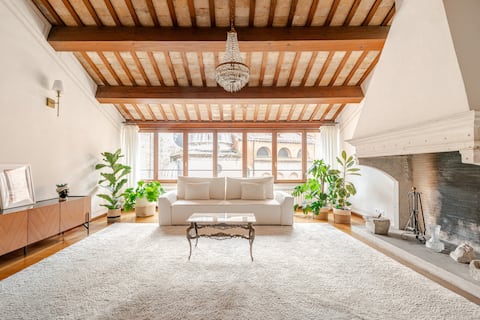
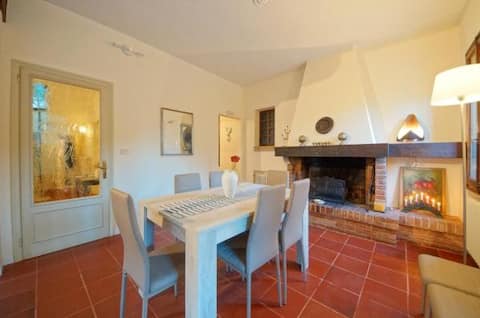
Top Performing Airbnb Properties in Treviso (2026)
Benchmark your potential! Explore examples of top-performing Airbnb properties in Trevisobased on Trailing Twelve Month (TTM) revenue. Analyze their characteristics, revenue, occupancy rate, and ADR to understand what drives success in this market.

Villa Leopold Villa Veneta with swimming pool
Entire Place • 6 bedrooms
Calmaggiore Apartment
Entire Place • 4 bedrooms

LA LOGGIA AL DUOMO (THE LOGGIA AT THE CATHEDRAL) - TREVISO
Entire Place • 2 bedrooms
Ca' dei Buranelli - Downtown Treviso
Entire Place • 3 bedrooms
Treviso Casa Magnolie Wi-Fi
Entire Place • 4 bedrooms

3-Bedroom Family Apartment Cadorna with Terrace
Entire Place • 3 bedrooms
Note: Performance varies based on location, size, amenities, seasonality, and management quality. Data reflects the past 12 months.
Top Performing Airbnb Hosts in Treviso (2026)
Learn from the best! This table showcases top-performing Airbnb hosts in Treviso based on the number of properties managed and estimated total revenue over the past year. Analyze their scale and performance metrics.
| Host Name | Properties | Grossing Revenue | Stay Reviews | Avg Rating |
|---|---|---|---|---|
| Marco & Elia | 16 | $308,711 | 1148 | 4.91/5.0 |
| Davide | 24 | $261,387 | 782 | 4.68/5.0 |
| Marco | 1 | $213,496 | 31 | 4.84/5.0 |
| Joivy Italy | 9 | $141,295 | 348 | 4.39/5.0 |
| Monica | 8 | $135,292 | 196 | 4.90/5.0 |
| Riccardo | 3 | $124,602 | 145 | 4.90/5.0 |
| Francesco Maria | 9 | $110,617 | 49 | 4.71/5.0 |
| Vincenzo | 1 | $106,026 | 44 | 4.86/5.0 |
| I-Home | 6 | $104,807 | 83 | 4.59/5.0 |
| Rs Apartments S.A.S | 6 | $96,326 | 141 | 4.70/5.0 |
Analyzing the strategies of top hosts, such as their property selection, pricing, and guest communication, can offer valuable lessons for optimizing your own Airbnb operations in Treviso.
Dive Deeper: Advanced Treviso STR Market Data (2026)
Ready to unlock more insights? AirROI provides access to advanced metrics and comprehensive Airbnb data for Treviso. Explore detailed analytics beyond this report to refine your investment strategy, optimize pricing, and maximize your vacation rental profits.
Explore Advanced MetricsTreviso Short-Term Rental Market Composition (2026): Property & Room Types
Room Type Distribution
Property Type Distribution
Market Composition Insights for Treviso
- The Treviso Airbnb market composition is heavily skewed towards Entire Home/Apt listings, which make up 77.3% of the 370 active rentals. This indicates strong guest preference for privacy and space.
- Looking at the property type distribution in Treviso, Apartment/Condo properties are the most common (78.6%), reflecting the local real estate landscape.
- The presence of 7.3% Hotel/Boutique listings indicates integration with traditional hospitality.
- Smaller segments like others, unique stays (combined 1.4%) offer potential for unique stay experiences.
Treviso Airbnb Room Capacity Analysis (2026): Bedroom Distribution
Distribution of Listings by Number of Bedrooms
Room Capacity Insights for Treviso
- The dominant room capacity in Treviso is 1 bedroom listings, making up 45.9% of the market. This suggests a strong demand for properties suitable for couples or solo travelers.
- Together, 1 bedroom and 2 bedrooms properties represent 75.6% of the active Airbnb listings in Treviso, indicating a high concentration in these sizes.
- Listings with 3+ bedrooms (6.4%) represent a smaller niche, potentially indicating an underserved market for larger group accommodations in Treviso.
Treviso Vacation Rental Guest Capacity Trends (2026)
Distribution of Listings by Guest Capacity
Guest Capacity Insights for Treviso
- The most common guest capacity trend in Treviso vacation rentals is listings accommodating 4 guests (32.7%). This suggests the primary traveler segment is likely small families or groups.
- Properties designed for 4 guests and 2 guests dominate the Treviso STR market, accounting for 48.9% of listings.
- 14.7% of properties accommodate 6+ guests, serving the market segment for larger families or group travel in Treviso.
- On average, properties in Treviso are equipped to host 3.3 guests.
Treviso Airbnb Booking Patterns (2026): Available vs. Booked Days
Available Days Distribution
Booked Days Distribution
Booking Pattern Insights for Treviso
- The most common availability pattern in Treviso falls within the 271-366 days range, representing 42.2% of listings. This suggests many properties have significant open periods on their calendars.
- Approximately 76.5% of listings show high availability (181+ days open annually), indicating potential for increased bookings or specific owner usage patterns.
- For booked days, the 91-180 days range is most frequent in Treviso (34.3%), reflecting common guest stay durations or potential owner blocking patterns.
- A notable 25.1% of properties secure long booking periods (181+ days booked per year), highlighting successful long-term rental strategies or significant owner usage.
Treviso Airbnb Minimum Stay Requirements Analysis
Distribution of Listings by Minimum Night Requirement
1 Night
121 listings
32.7% of total
2 Nights
113 listings
30.5% of total
3 Nights
9 listings
2.4% of total
4-6 Nights
8 listings
2.2% of total
7-29 Nights
2 listings
0.5% of total
30+ Nights
117 listings
31.6% of total
Key Insights
- The most prevalent minimum stay requirement in Treviso is 1 Night, adopted by 32.7% of listings. This highlights the market's preference for shorter, flexible bookings.
- A strong majority (63.2%) of the Treviso Airbnb data shows acceptance of very short stays (1-2 nights), indicating a dynamic, high-turnover market.
- A significant segment (31.6%) caters to monthly stays (30+ nights) in Treviso, pointing to opportunities in the extended-stay market.
Recommendations
- Align with the market by considering a 1 Night minimum stay, as 32.7% of Treviso hosts use this setting.
- Explore offering discounts for stays of 30+ nights to attract the 31.6% of the market seeking extended stays.
- Adjust minimum nights based on seasonality – potentially shorter during low season and longer during peak demand periods in Treviso.
Treviso Airbnb Cancellation Policy Trends Analysis (2026)
Super Strict 30 Days
5 listings
1.4% of total
Limited
4 listings
1.1% of total
Flexible
120 listings
32.4% of total
Moderate
204 listings
55.1% of total
Firm
34 listings
9.2% of total
Strict
3 listings
0.8% of total
Cancellation Policy Insights for Treviso
- The prevailing Airbnb cancellation policy trend in Treviso is Moderate, used by 55.1% of listings.
- The market strongly favors guest-friendly terms, with 87.5% of listings offering Flexible or Moderate policies. This suggests guests in Treviso may expect booking flexibility.
- Strict cancellation policies are quite rare (0.8%), potentially making listings with this policy less competitive unless justified by high demand or property type.
Recommendations for Hosts
- Consider adopting a Moderate policy to align with the 55.1% market standard in Treviso.
- Using a Strict policy might deter some guests, as only 0.8% of listings use it. Evaluate if potential revenue protection outweighs possible lower booking rates.
- Regularly review your cancellation policy against competitors and market demand shifts in Treviso.
Treviso STR Booking Lead Time Analysis (2026)
Average Booking Lead Time by Month
Booking Lead Time Insights for Treviso
- The overall average booking lead time for vacation rentals in Treviso is 44 days.
- Guests book furthest in advance for stays during May (average 64 days), likely coinciding with peak travel demand or local events.
- The shortest booking windows occur for stays in February (average 27 days), indicating more last-minute travel plans during this time.
- Seasonally, Summer (52 days avg.) sees the longest lead times, while Winter (38 days avg.) has the shortest, reflecting typical travel planning cycles.
Recommendations for Hosts
- Use the overall average lead time (44 days) as a baseline for your pricing and availability strategy in Treviso.
- For May stays, consider implementing length-of-stay discounts or slightly higher rates for bookings made less than 64 days out to capitalize on advance planning.
- Target marketing efforts for the Summer season well in advance (at least 52 days) to capture early planners.
- Monitor your own booking lead times against these Treviso averages to identify opportunities for dynamic pricing adjustments.
Popular & Essential Airbnb Amenities in Treviso (2026)
Amenity Prevalence
Amenity Insights for Treviso
- Essential amenities in Treviso that guests expect include: Wifi. Lacking these (this) could significantly impact bookings.
- Popular amenities like Heating, Air conditioning, TV are common but not universal. Offering these can provide a competitive edge.
Recommendations for Hosts
- Ensure your listing includes all essential amenities for Treviso: Wifi.
- Prioritize adding missing essentials: Wifi.
- Consider adding popular differentiators like Heating or Air conditioning to increase appeal.
- Highlight unique or less common amenities you offer (e.g., hot tub, dedicated workspace, EV charger) in your listing description and photos.
- Regularly check competitor amenities in Treviso to stay competitive.
Treviso Airbnb Guest Demographics & Profile Analysis (2026)
Guest Profile Summary for Treviso
- The typical guest profile for Airbnb in Treviso consists of predominantly international visitors (82%), with top international origins including United Kingdom, typically belonging to the Post-2000s (Gen Z/Alpha) group (50%), primarily speaking English or Italian.
- Domestic travelers account for 17.8% of guests.
- Key international markets include Italy (17.8%) and United Kingdom (13.9%).
- Top languages spoken are English (39.8%) followed by Italian (13.7%).
- A significant demographic segment is the Post-2000s (Gen Z/Alpha) group, representing 50% of guests.
Recommendations for Hosts
- Focus marketing internationally, particularly towards travelers from United Kingdom.
- Tailor amenities and listing descriptions to appeal to the dominant Post-2000s (Gen Z/Alpha) demographic (e.g., highlight fast WiFi, smart home features, local guides).
- Highlight unique local experiences or amenities relevant to the primary guest profile.
- Consider seasonal promotions aligned with peak travel times for key origin markets.
Nearby Short-Term Rental Market Comparison
How does the Treviso Airbnb market stack up against its neighbors? Compare key performance metrics like average monthly revenue, ADR, and occupancy rates in surrounding areas to understand the broader regional STR landscape.
| Market | Active Properties | Monthly Revenue | Daily Rate | Avg. Occupancy |
|---|---|---|---|---|
| Sankt Pankraz - San Pancrazio | 12 | $6,528 | $633.65 | 29% |
| Urtijëi - St. Ulrich in Gröden - Ortisei | 172 | $5,054 | $718.33 | 41% |
| Kiens - Chienes | 17 | $3,715 | $377.77 | 48% |
| Cortina d'Ampezzo | 309 | $3,646 | $474.12 | 40% |
| Moos in Passeier - Moso in Passiria | 20 | $3,504 | $547.30 | 23% |
| Colle Santa Lucia | 21 | $3,353 | $248.56 | 46% |
| Selina | 15 | $3,339 | $351.70 | 49% |
| Lajen - Laion | 96 | $3,338 | $548.27 | 36% |
| Merano | 28 | $3,288 | $309.99 | 46% |
| Santa Cristina Gherdëina - St. Christina in Gröden - Santa Cristina Valgardena | 102 | $3,264 | $408.62 | 41% |